Downloaded 62 times

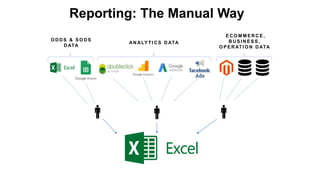
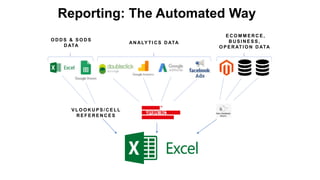
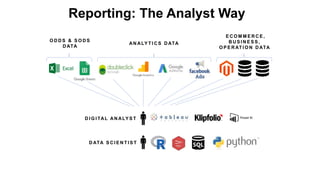
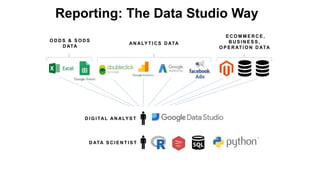
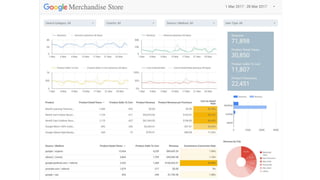
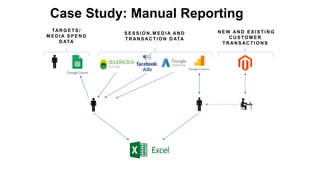
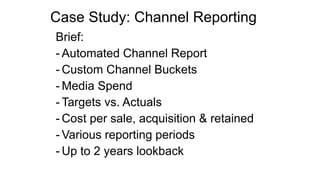
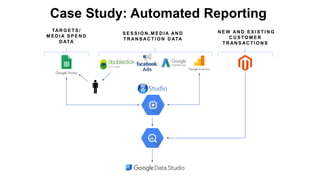
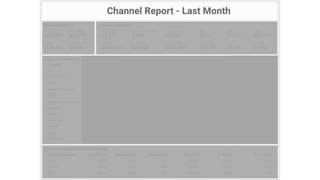
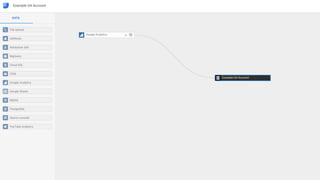


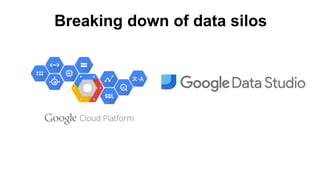


This document discusses how Google Data Studio can be used for reporting. It provides an overview of Data Studio's key features, including connecting to various data sources, visualizing data through charts and tables, and sharing customizable reports. The document also presents a case study example where Data Studio was used to automate a marketing channel reporting dashboard that integrated multiple data sources and provided metrics like costs per sale and customer acquisition/retention over time. The takeaways emphasize how Data Studio can become a default reporting tool by breaking down data silos and focusing on business needs rather than just the technical capabilities of the tool.


![제 23회 보아즈(BOAZ) 빅데이터 컨퍼런스 - [MBOAX] : ABSA를 활용한 소비자 반응 분석 기반 운영 효율화 대시보드 설계](https://cdn.slidesharecdn.com/ss_thumbnails/3-1boaz23rdconferencemboax-260203102709-9d519923-thumbnail.jpg?width=640&height=640&fit=bounds)
![Hacking-Uncovered-How-People-Get-Hacked-and-How-to-Stay-Safe[1].pptx](https://cdn.slidesharecdn.com/ss_thumbnails/hacking-uncovered-how-people-get-hacked-and-how-to-stay-safe1-260130170011-4883a9c7-thumbnail.jpg?width=640&height=640&fit=bounds)

