Download to read offline
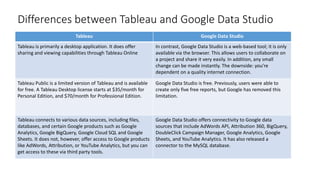
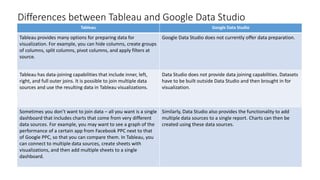

Tableau and Google Data Studio are both popular data visualization tools. Tableau is primarily a desktop application that allows for advanced data preparation and custom visualizations, while Google Data Studio is web-based and free, allowing for easy collaboration. Both tools can connect to various data sources and create dashboards with multiple visualizations, but Tableau offers more functionality for data wrangling and customization. While Tableau may be more full-featured, Google Data Studio provides strong options for basic reporting and sharing at no cost.