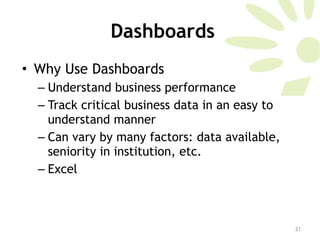
Interactive Metrics  What You  Really  Need to Know June 18, 2009 Presented by: Maria Harrison  www.iclarityonline.com
Agenda Introduction Tracking vs. Analytics & Analysis What It Means to Be Average Dashboards Resources
Introduction Maria Harrison 12 year Internet industry veteran  Experience in online marketing strategies, online marketing plans, online media buying plans, web site usability, email marketing, search engine marketing, web 2.0, affiliate marketing, social media and more.  Previous Roles & Accomplishments:  Vice President of Marketing, The Laredo Group  Director of Online Marketing, Interval International, an InterActive Corp (IAC) company Interactive marketing consultant for IAC’s new business opportunity unit Former President, South Florida Interactive Marketing Association and founding board member Founded and operated Key Promotions, Inc., a private web consulting firm for clients such as Barbizon International Modeling, the National Cancer Health Institute, Lexus and others.
Quote of The Day Everything that can be counted does not necessarily count; everything that counts  cannot necessarily be counted.   Albert Einstein
Tracking vs. Analytics & Analysis Website tracking  refers to the act of archiving existing websites and tracking changes to the website over time.  –Wikipedia.com Web analytics  is the measurement, collection, analysis and reporting of internet data for purposes of understanding and optimizing web usage. There are two categories of web analytics;  off-site  and  on-site  web analytics. – Wikipedia.com
Tracking vs. Analytics & Analysis Web analytics suites  do the tracking and allow you to  report   on the data you’re tracking. Web analytics suites give you:  Ways to slice and dice the data Charts and graphs Reports - aggregate your log file data Examples of some popular ones:  Google Analytics (It’s FREE!)   Omniture Coremetrics Webtrends Etc.
Tracking vs. Analytics & Analysis Knowing what to track and selecting the right tracking tools are NOT accomplishing ANALYSIS!  Analysis is hard work. Analysis is hard work. Analysis is hard work. Analysis is hard work.
Tracking vs. Analytics & Analysis Breaking it down Tracking gives you data points such as:  Hits Visitors to site – unique and repeat Average time on site Referring sites Bounce rate Keywords Pages visited within a site Clickstream data
Bounce Rate Represents the percentage of initial visitors to a site who "bounce" away to a different site, rather than continue on to other pages within the same site. Anything over 50% should scare you  Anything over 35% should be testing page elements to lower it Anything between 25-35% is OK Anything under 25% is worth doing a back-flip over!  Tracking vs. Analytics & Analysis
Tracking vs. Analytics & Analysis Goals -  Before you start analysis, you need to understand your goals.  Actionable Insights –  If what you’re tracking, and what your web analytics suite is reporting on does not help you form actionable insights, you’re tracking the wrong thing OR you don’t understand how to use the data.
Tracking vs. Analytics & Analysis Inclusive  – Being inclusive when it comes to analytics means two things:  Not analyzing data that exists in silos Not analyzing in silos – include your stakeholders!  Classic Example of the former:
Tracking vs. Analytics & Analysis Click Data Analysis What can we learn from this data?
Tracking vs. Analytics & Analysis Conversion Data Analysis What can we learn from this data?
Tracking vs. Analytics & Analysis Click Data Conversion Data
What it Means to Be Average Why Averages Are Like Dessert Like a good dessert buffet, it’s very tempting to use averages when talking about your web metrics.  But averages are not always the answer. Dive deeper, look beyond the surface.
What it Means to Be Average A quantity, rating, or the like that represents or approximates an arithmetic mean; a typical amount, rate, degree, etc.; norm. –  Dictionary.com Aggregate averages are more or less, useless, especially for high volume trafficked sites. It’s lazy.
What it Means to Be Average So, what is one to do? Check out what every user is doing and give them each a separate path through the site to accommodate them?  No.  Segmentation  is the answer. Take  all that rolled-up aggregate data that you your web analytics tool spits out in it’s invariably pre-programmed, pre-defined report and segment it.  Dig into your analytics suite and figure out its segmentation capabilities.
What it Means to Be Average Segmentation Example by Channel:
What it Means to Be Average
What it Means to Be Average Hey! Now we can gain some real insights about visitors!
Dashboards Why Use Dashboards Understand business performance Track critical business data in an easy to understand manner Can vary by many factors: data available, seniority in institution, etc.  Excel
Dashboards General concepts that should be considered when creating your dashboard:  Benchmark & Segment  Provide context for dashboard readers For example: previous sales, industry benchmarks, goals, etc. Isolate Critical Few Metrics  10 metrics or LESS Each has to have context Each has to be further segmented
Dashboards Don’t Stop at Metrics—Include Insights Summarize Recommended Next Steps Opportunities/Missed Opportunities Don’t make your executives think!  The Power of a Single Page  Evolution (and stay relevant)  Your business evolves So should your dashboard *Avinash blog post, Five Rules for High Impact Dashboards, March2007
Dashboards Google Analytics Dashboard Needs Context and A Summary!  Segmentation by Channel Segmentation by Metric
Dashboards Benchmark by Date
Resources Web Analytics Association  www.webanalyticsassociation.org   Great article on ClickZ about what digital analysis is:  www.clickz.com/3633924   Avinash’s blog, author of  Web Analytics: An Hour a Day  www.kaushik.net/avinash/
Shameless Self Promotion:  University of San Francisco www.usanfranonline.com   Masters Certificate in Internet Marketing Integrated Online Strategies Search Engine Marketing & Usability Advanced Interactive Marketing Web Analytics & Measurement
Thank You Want a copy of this presentation?  Go to  http://iclarityonline.blogspot.com Stay In Touch:  Twitter: @iclarity [email_address]

Interactive Metrics, What You Really Need to Know

  • 1.
    Interactive Metrics What You Really Need to Know June 18, 2009 Presented by: Maria Harrison www.iclarityonline.com
  • 2.
    Agenda Introduction Trackingvs. Analytics & Analysis What It Means to Be Average Dashboards Resources
  • 3.
    Introduction Maria Harrison12 year Internet industry veteran Experience in online marketing strategies, online marketing plans, online media buying plans, web site usability, email marketing, search engine marketing, web 2.0, affiliate marketing, social media and more. Previous Roles & Accomplishments: Vice President of Marketing, The Laredo Group Director of Online Marketing, Interval International, an InterActive Corp (IAC) company Interactive marketing consultant for IAC’s new business opportunity unit Former President, South Florida Interactive Marketing Association and founding board member Founded and operated Key Promotions, Inc., a private web consulting firm for clients such as Barbizon International Modeling, the National Cancer Health Institute, Lexus and others.
  • 4.
    Quote of TheDay Everything that can be counted does not necessarily count; everything that counts cannot necessarily be counted. Albert Einstein
  • 5.
    Tracking vs. Analytics& Analysis Website tracking refers to the act of archiving existing websites and tracking changes to the website over time. –Wikipedia.com Web analytics is the measurement, collection, analysis and reporting of internet data for purposes of understanding and optimizing web usage. There are two categories of web analytics; off-site and on-site web analytics. – Wikipedia.com
  • 6.
    Tracking vs. Analytics& Analysis Web analytics suites do the tracking and allow you to report on the data you’re tracking. Web analytics suites give you: Ways to slice and dice the data Charts and graphs Reports - aggregate your log file data Examples of some popular ones: Google Analytics (It’s FREE!)  Omniture Coremetrics Webtrends Etc.
  • 7.
    Tracking vs. Analytics& Analysis Knowing what to track and selecting the right tracking tools are NOT accomplishing ANALYSIS! Analysis is hard work. Analysis is hard work. Analysis is hard work. Analysis is hard work.
  • 8.
    Tracking vs. Analytics& Analysis Breaking it down Tracking gives you data points such as: Hits Visitors to site – unique and repeat Average time on site Referring sites Bounce rate Keywords Pages visited within a site Clickstream data
  • 9.
    Bounce Rate Representsthe percentage of initial visitors to a site who "bounce" away to a different site, rather than continue on to other pages within the same site. Anything over 50% should scare you Anything over 35% should be testing page elements to lower it Anything between 25-35% is OK Anything under 25% is worth doing a back-flip over! Tracking vs. Analytics & Analysis
  • 10.
    Tracking vs. Analytics& Analysis Goals - Before you start analysis, you need to understand your goals. Actionable Insights – If what you’re tracking, and what your web analytics suite is reporting on does not help you form actionable insights, you’re tracking the wrong thing OR you don’t understand how to use the data.
  • 11.
    Tracking vs. Analytics& Analysis Inclusive – Being inclusive when it comes to analytics means two things: Not analyzing data that exists in silos Not analyzing in silos – include your stakeholders! Classic Example of the former:
  • 12.
    Tracking vs. Analytics& Analysis Click Data Analysis What can we learn from this data?
  • 13.
    Tracking vs. Analytics& Analysis Conversion Data Analysis What can we learn from this data?
  • 14.
    Tracking vs. Analytics& Analysis Click Data Conversion Data
  • 15.
    What it Meansto Be Average Why Averages Are Like Dessert Like a good dessert buffet, it’s very tempting to use averages when talking about your web metrics. But averages are not always the answer. Dive deeper, look beyond the surface.
  • 16.
    What it Meansto Be Average A quantity, rating, or the like that represents or approximates an arithmetic mean; a typical amount, rate, degree, etc.; norm. – Dictionary.com Aggregate averages are more or less, useless, especially for high volume trafficked sites. It’s lazy.
  • 17.
    What it Meansto Be Average So, what is one to do? Check out what every user is doing and give them each a separate path through the site to accommodate them? No. Segmentation is the answer. Take all that rolled-up aggregate data that you your web analytics tool spits out in it’s invariably pre-programmed, pre-defined report and segment it. Dig into your analytics suite and figure out its segmentation capabilities.
  • 18.
    What it Meansto Be Average Segmentation Example by Channel:
  • 19.
    What it Meansto Be Average
  • 20.
    What it Meansto Be Average Hey! Now we can gain some real insights about visitors!
  • 21.
    Dashboards Why UseDashboards Understand business performance Track critical business data in an easy to understand manner Can vary by many factors: data available, seniority in institution, etc. Excel
  • 22.
    Dashboards General conceptsthat should be considered when creating your dashboard: Benchmark & Segment Provide context for dashboard readers For example: previous sales, industry benchmarks, goals, etc. Isolate Critical Few Metrics 10 metrics or LESS Each has to have context Each has to be further segmented
  • 23.
    Dashboards Don’t Stopat Metrics—Include Insights Summarize Recommended Next Steps Opportunities/Missed Opportunities Don’t make your executives think! The Power of a Single Page Evolution (and stay relevant) Your business evolves So should your dashboard *Avinash blog post, Five Rules for High Impact Dashboards, March2007
  • 24.
    Dashboards Google AnalyticsDashboard Needs Context and A Summary! Segmentation by Channel Segmentation by Metric
  • 25.
  • 26.
    Resources Web AnalyticsAssociation www.webanalyticsassociation.org Great article on ClickZ about what digital analysis is: www.clickz.com/3633924 Avinash’s blog, author of Web Analytics: An Hour a Day www.kaushik.net/avinash/
  • 27.
    Shameless Self Promotion: University of San Francisco www.usanfranonline.com Masters Certificate in Internet Marketing Integrated Online Strategies Search Engine Marketing & Usability Advanced Interactive Marketing Web Analytics & Measurement
  • 28.
    Thank You Wanta copy of this presentation? Go to http://iclarityonline.blogspot.com Stay In Touch: Twitter: @iclarity [email_address]