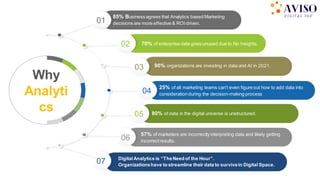
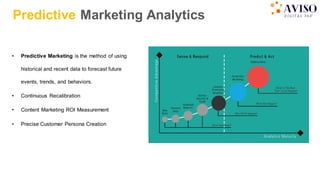
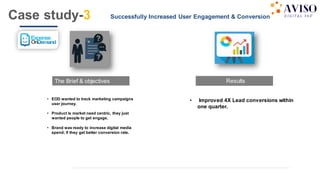
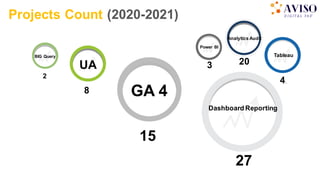
Google Analytics 4
Concept & Performance Marketing Benefits
2
Core Solution
01
Advanced Analytics Key
Factors
02
Analytics Roadmap
03
Advanced Analytics
Features
05
Advertising Benefits
06
Data Flow And Integration
07
Proposal Agenda
Analytics Case Study
04 Company Profile
08
01
80% of data in the digital universe is unstructured.
07
02 70% of enterprise data goes unused due to No Insights.
06
57% of marketers are incorrectly interpreting data and likely getting
incorrectresults.
05
85% Business agrees that Analytics based Marketing
decisions are more effective & ROI driven.
03
04
25% of all marketing teams can’t even figure out how to add data into
considerationduring the decision-making process
Why
Analyti
cs
90% organizations are investing in data and AI in 2021.
DigitalAnalytics is “TheNeed of the Hour”.
Organizationshave to streamline their data to survivein Digital Space.
4 2
1
3
Effective
Marketing
Data Source Integration
Tag Manager
Decision Structure
Business focusedData
Modeling
Data Management
Google Big Query/Cloud
Storage
Data Driven Insights
Reporting,Dashboards,
Data Storytelling
Success Model
Analytics Services
5
Advanced Analytics
&
Tag Implementation
Setup
01
Retainer
02
Marketing Dashboards
Sales Dashboards
Custom Dashboard
FunnelDashboard
CRM Dashboard
Dashboard
03
Ad-Hoc Support.
Tag Implementation.
Data Reporting.
Marketing Data Insights.
Quarterly Web/App Audit
Setup {Integration & Data Flow}
Planning & Setup
o Setup GA/GTM Account
o GTM Container Setup &
testing
o Requirement Gathering
o Platform Understanding
o Filter & Annotation
o Web Analytics Planning
o Google Ads & Product
linking
o Data Layer Planning
o Tagging Guide Planning
Phase
01
Data Stimulation
o Website Data testing
o Funnel Journey
o GA Custom Reports
o Segmentation
o Retargeting
o Data Modeling
o Goals & Conversion
Setup
o Custom Reports
Phase
03
Establishment
o Data layer Design
o Tag, Trigger, Variable
o Organize GTM
o 3rd party Script
o Campaign Pixel
o Setting up Workflow
o Custom Dimension
o E Commerce
o Enhanced Ecommerce
o Social tracking
Phase
02
Data Insights
o GA4 Reporting
o GDS Dashboards
o Campaign Dashboards
o Ecommerce Dashboards
o Performance Dashboards
o Testing (Integration)
o Testing(UAT)
o End User GA4Training
Phase
04
PredictiveModelling
o Attribution Modeling
o Audience Creation
o User Churn Reports
Phase
05
Note:
1)Depending on the package selected, the phases and w orkcomponents willdiffer.
2)Meeting deadlines is contingent on development assistance, w hich willbe given by the brand.
3)Provided durations w ould only includes w orking days, weekends &public holidays are not counted
7-10 Days 15-20 Days 10-15 Days 10-15 Days 15-20 Days
Hard-coded Vs Google Tag Manager
Reduce Page
Load Time
All tags are
controlledin one
place.
Built-in 3rd party
testing tools.
Preview and
Debug mode
with GTM
debugging
solutions
Reduce time
from weeks to
hours.
It allows user
permissions
access.
Increase
Page Load
Time
Multiple
Steps &
stages
Hardcoded
Campaigns
pixel Set-up
No
Debugging
solutions
Complex &
Time Taking
Process
Dependency
on
developers
Hard Code
OUT
Analytics Ecosystem
IN
Tag
Management
Ad Serving
Display
Buying
Media
Data
Pipeline
On Site
Analytics
Data
Warehousing
Report,
Dashboard,
Storytelling
Advance Analytics Eco-System
Search
Management
Web
Presence
Predictive Analytics
Data-base Structuring
Advanced Google Analytics 4
01 User FocusApproach
07 Better Data Visualization
02 Funnel Exploration
06 Data Control
05 AI Base Data Predictions
03
04
Data Protection by
Design
Key
Features
Event Base Cookie Less Tracking
Glimpse of GA4
11
NEW REAL-TIME REPORTS
NEW DEBUG MODE
AUTOMATIC (ENHANCED) MEASUREMENT
NEW REPORTING IDENTITY
02
Dashboard
01
 Web Analytics
 Tag Implementation Support
 GA + GTM Health check testing
 Monthly Analysis Review
Support
03
Marketing Insight
Retainer Service
Note: Phases & w orkcomponents would vary depending upon the package has been chosen
Monthly
Retainer  Marketing Performance Dashboard
 eCommerce Marketing Dashboard
 Google Data Studio
 Power BI and Tableau Dashboard
 Campaign Performance Analysis
 User Drop-off Insights
 Segment Based Re-Marketing Audience
 Leveraging the Attribution Modeling
We Convert Boring Excel Reports in to
Insightful Live Dashboards..
Marketing Performance Dashboard
Key Highlights:
 Dashboard helps advertiser to review enlarged picture of campaign performance within single visualized
frame.
 Dashboard reporting ensures smart marketing allocations to drive efficiency.
 A good marketing dashboard will make use of a variety of data sources to provides comprehensive insights.
Predictive Marketing Analytics
• Predictive Marketing is the method of using
historical and recent data to forecast future
events, trends, and behaviors.
• Continuous Recalibration
• Content Marketing ROI Measurement
• Precise Customer Persona Creation
Analytics
Packages
50
5
50
2
100
15
100
5
150
25
150
15
Web GA4 Set-up
Event & Behavior tracking
Custom Dimension
Custom Parameters
Performance Dashboards (GDS)
Attribution Modeling
User Churn Reports
Basic
(Static site)
Explorer
(Advance)
Pro-Fit
(Ecom + Dynamic)
Campaign & 3rd party pixel Tracking
User Base Segmentation
Funnel, Goals & Conversions
Big Query Set-up
Analytics GA4 Training (Up to 5 Hours)
Note: 1. Action Items & Deliverables would vary depending upon the package has been chosen.
2. Google Big Query Costwill be additional.& directlypaid by clientbasis platform invoice.
3. Above given package costis only for Analytics Set-up & integration.Recurring costwill be separate.
Project Execution Timeline
Post
Implementation
Support
1- 2 1-2 3-4 2-3 1-2
Requirement
Gathering
Object
Planning
Execution Testing Handover
In Weeks
Observation:
 We strongly recommend “Explorer Advance” Package basis on Your Brand Audit review. Above given
timelines are mentioned for implementation phase.
Case Study-
1
The Brief & objectives
 PVR wanted to track all marketing
campaignsuser journey.
 Wanted to run affiliate campaign with
multiple vendors on costper sale
model.
 Theywanted to debugall analytics
issues to track all possible data in
correctformat.
Reduced Time to Manage Tags from Weeks & Months to Hours.
User Funnel Improvement.
 Reduced time to managetags from
weeks & months to hours.
 Streamlined implementationof
Remarketing Lists for Search Ads
acrossmultiple web properties,
decreasingcostper acquisition by 25%.
 20% increasein affiliate partnershipdue
to the accuratetagging.
Results
Case study-2
• We were not able to identify the actual
performance of the different channels we were
running to acquire a new customer.
• We were doing a lots of activities & online
campaigns from different channels like Google,
Facebook, Organic, Email, SMS and affiliates.
• According to the client his Organic is giving
higher conversion than other channels and
why not we should reduce the Google &
Facebook ads marketing budget.
Identify the actual performance of media
channels with help of attribution modelling
• Increase the ROIby 1.4X.
• We have also reducedthe acquisitionthe
cycle from 7 days to 5 days.
The Brief & objectives Results
Case study-3
• EOD wanted to track marketing campaigns
user journey.
• Product is market need centric, they just
wanted people to get engage.
• Brand was ready to increase digital media
spend; if they get better conversion rate.
Successfully Increased User Engagement & Conversion
• Improved 4X Lead conversions within
one quarter.
The Brief & objectives Results
GA 4
UA
Dashboard Reporting
Tableau
BIG Query
Power BI
2
8
15
4.
Projects Count (2020-2021)
27
3
Analytics Audit
20
Some of Our Esteemed
Clients
Partner Agencies Trust On
Us
ContactUs
ThankY
ou.
AVISODigital360
880 0158111
9716901521
Pioneer Presidia
Gurgaon -122101

Advanced Google Analytics 4.0 by Aviso Digital

  • 1.
    Google Analytics 4 Concept& Performance Marketing Benefits
  • 2.
    2 Core Solution 01 Advanced AnalyticsKey Factors 02 Analytics Roadmap 03 Advanced Analytics Features 05 Advertising Benefits 06 Data Flow And Integration 07 Proposal Agenda Analytics Case Study 04 Company Profile 08
  • 3.
    01 80% of datain the digital universe is unstructured. 07 02 70% of enterprise data goes unused due to No Insights. 06 57% of marketers are incorrectly interpreting data and likely getting incorrectresults. 05 85% Business agrees that Analytics based Marketing decisions are more effective & ROI driven. 03 04 25% of all marketing teams can’t even figure out how to add data into considerationduring the decision-making process Why Analyti cs 90% organizations are investing in data and AI in 2021. DigitalAnalytics is “TheNeed of the Hour”. Organizationshave to streamline their data to survivein Digital Space.
  • 4.
    4 2 1 3 Effective Marketing Data SourceIntegration Tag Manager Decision Structure Business focusedData Modeling Data Management Google Big Query/Cloud Storage Data Driven Insights Reporting,Dashboards, Data Storytelling Success Model
  • 5.
    Analytics Services 5 Advanced Analytics & TagImplementation Setup 01 Retainer 02 Marketing Dashboards Sales Dashboards Custom Dashboard FunnelDashboard CRM Dashboard Dashboard 03 Ad-Hoc Support. Tag Implementation. Data Reporting. Marketing Data Insights. Quarterly Web/App Audit
  • 6.
    Setup {Integration &Data Flow} Planning & Setup o Setup GA/GTM Account o GTM Container Setup & testing o Requirement Gathering o Platform Understanding o Filter & Annotation o Web Analytics Planning o Google Ads & Product linking o Data Layer Planning o Tagging Guide Planning Phase 01 Data Stimulation o Website Data testing o Funnel Journey o GA Custom Reports o Segmentation o Retargeting o Data Modeling o Goals & Conversion Setup o Custom Reports Phase 03 Establishment o Data layer Design o Tag, Trigger, Variable o Organize GTM o 3rd party Script o Campaign Pixel o Setting up Workflow o Custom Dimension o E Commerce o Enhanced Ecommerce o Social tracking Phase 02 Data Insights o GA4 Reporting o GDS Dashboards o Campaign Dashboards o Ecommerce Dashboards o Performance Dashboards o Testing (Integration) o Testing(UAT) o End User GA4Training Phase 04 PredictiveModelling o Attribution Modeling o Audience Creation o User Churn Reports Phase 05 Note: 1)Depending on the package selected, the phases and w orkcomponents willdiffer. 2)Meeting deadlines is contingent on development assistance, w hich willbe given by the brand. 3)Provided durations w ould only includes w orking days, weekends &public holidays are not counted 7-10 Days 15-20 Days 10-15 Days 10-15 Days 15-20 Days
  • 7.
    Hard-coded Vs GoogleTag Manager Reduce Page Load Time All tags are controlledin one place. Built-in 3rd party testing tools. Preview and Debug mode with GTM debugging solutions Reduce time from weeks to hours. It allows user permissions access. Increase Page Load Time Multiple Steps & stages Hardcoded Campaigns pixel Set-up No Debugging solutions Complex & Time Taking Process Dependency on developers Hard Code
  • 8.
    OUT Analytics Ecosystem IN Tag Management Ad Serving Display Buying Media Data Pipeline OnSite Analytics Data Warehousing Report, Dashboard, Storytelling Advance Analytics Eco-System Search Management Web Presence Predictive Analytics
  • 9.
  • 10.
    Advanced Google Analytics4 01 User FocusApproach 07 Better Data Visualization 02 Funnel Exploration 06 Data Control 05 AI Base Data Predictions 03 04 Data Protection by Design Key Features Event Base Cookie Less Tracking
  • 11.
    Glimpse of GA4 11 NEWREAL-TIME REPORTS NEW DEBUG MODE AUTOMATIC (ENHANCED) MEASUREMENT NEW REPORTING IDENTITY
  • 12.
    02 Dashboard 01  Web Analytics Tag Implementation Support  GA + GTM Health check testing  Monthly Analysis Review Support 03 Marketing Insight Retainer Service Note: Phases & w orkcomponents would vary depending upon the package has been chosen Monthly Retainer  Marketing Performance Dashboard  eCommerce Marketing Dashboard  Google Data Studio  Power BI and Tableau Dashboard  Campaign Performance Analysis  User Drop-off Insights  Segment Based Re-Marketing Audience  Leveraging the Attribution Modeling
  • 13.
    We Convert BoringExcel Reports in to Insightful Live Dashboards..
  • 14.
    Marketing Performance Dashboard KeyHighlights:  Dashboard helps advertiser to review enlarged picture of campaign performance within single visualized frame.  Dashboard reporting ensures smart marketing allocations to drive efficiency.  A good marketing dashboard will make use of a variety of data sources to provides comprehensive insights.
  • 15.
    Predictive Marketing Analytics •Predictive Marketing is the method of using historical and recent data to forecast future events, trends, and behaviors. • Continuous Recalibration • Content Marketing ROI Measurement • Precise Customer Persona Creation
  • 16.
    Analytics Packages 50 5 50 2 100 15 100 5 150 25 150 15 Web GA4 Set-up Event& Behavior tracking Custom Dimension Custom Parameters Performance Dashboards (GDS) Attribution Modeling User Churn Reports Basic (Static site) Explorer (Advance) Pro-Fit (Ecom + Dynamic) Campaign & 3rd party pixel Tracking User Base Segmentation Funnel, Goals & Conversions Big Query Set-up Analytics GA4 Training (Up to 5 Hours) Note: 1. Action Items & Deliverables would vary depending upon the package has been chosen. 2. Google Big Query Costwill be additional.& directlypaid by clientbasis platform invoice. 3. Above given package costis only for Analytics Set-up & integration.Recurring costwill be separate.
  • 17.
    Project Execution Timeline Post Implementation Support 1-2 1-2 3-4 2-3 1-2 Requirement Gathering Object Planning Execution Testing Handover In Weeks Observation:  We strongly recommend “Explorer Advance” Package basis on Your Brand Audit review. Above given timelines are mentioned for implementation phase.
  • 18.
    Case Study- 1 The Brief& objectives  PVR wanted to track all marketing campaignsuser journey.  Wanted to run affiliate campaign with multiple vendors on costper sale model.  Theywanted to debugall analytics issues to track all possible data in correctformat. Reduced Time to Manage Tags from Weeks & Months to Hours. User Funnel Improvement.  Reduced time to managetags from weeks & months to hours.  Streamlined implementationof Remarketing Lists for Search Ads acrossmultiple web properties, decreasingcostper acquisition by 25%.  20% increasein affiliate partnershipdue to the accuratetagging. Results
  • 19.
    Case study-2 • Wewere not able to identify the actual performance of the different channels we were running to acquire a new customer. • We were doing a lots of activities & online campaigns from different channels like Google, Facebook, Organic, Email, SMS and affiliates. • According to the client his Organic is giving higher conversion than other channels and why not we should reduce the Google & Facebook ads marketing budget. Identify the actual performance of media channels with help of attribution modelling • Increase the ROIby 1.4X. • We have also reducedthe acquisitionthe cycle from 7 days to 5 days. The Brief & objectives Results
  • 20.
    Case study-3 • EODwanted to track marketing campaigns user journey. • Product is market need centric, they just wanted people to get engage. • Brand was ready to increase digital media spend; if they get better conversion rate. Successfully Increased User Engagement & Conversion • Improved 4X Lead conversions within one quarter. The Brief & objectives Results
  • 21.
    GA 4 UA Dashboard Reporting Tableau BIGQuery Power BI 2 8 15 4. Projects Count (2020-2021) 27 3 Analytics Audit 20
  • 22.
    Some of OurEsteemed Clients
  • 23.
  • 24.