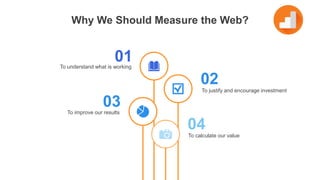
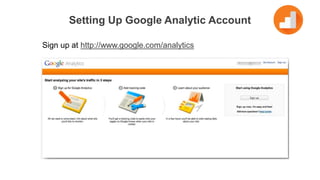
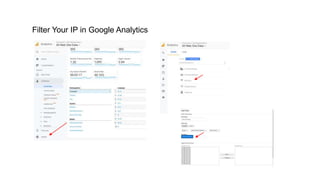
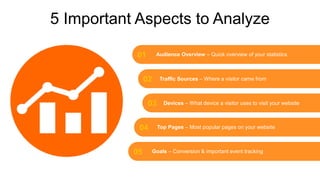
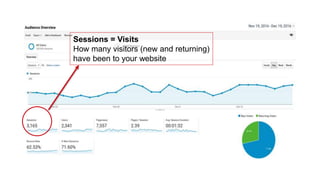
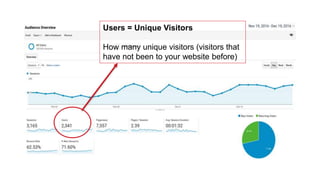
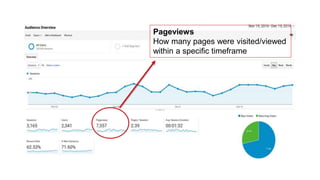
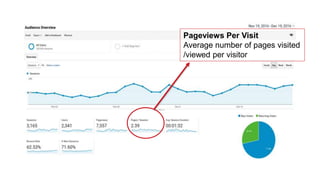
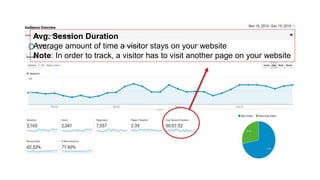
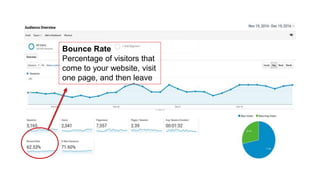
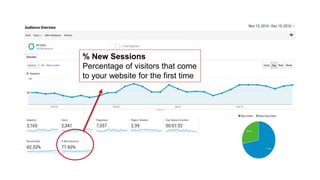
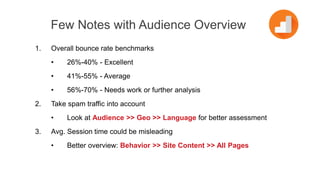
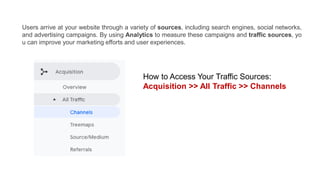
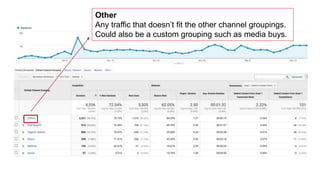
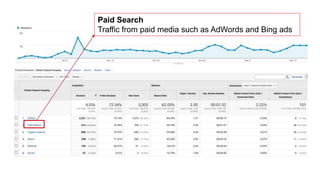
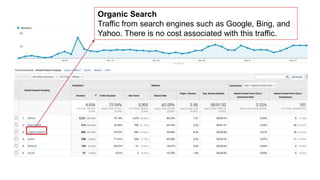
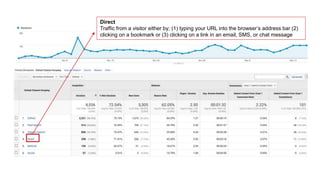
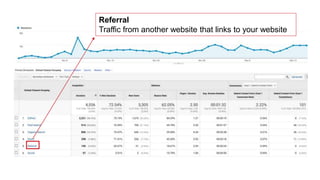
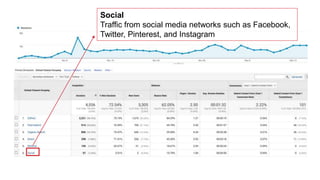
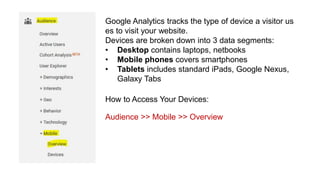
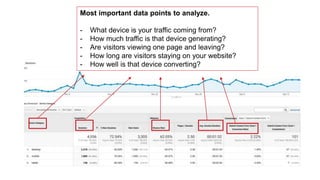
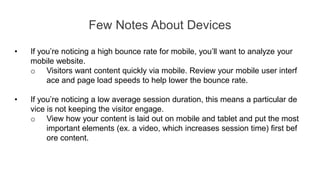
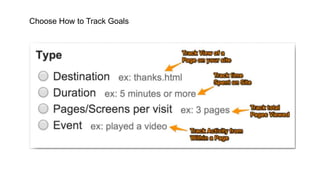
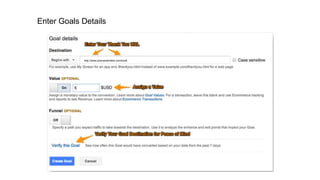
http://www.free-powerpoint-templates-design.com
FREE PPT
TEMPLATES
INSERT THE TITLE
OF YOUR PRESENTATION HERE
Google
Analytics
Getting Started and
How to Measure Success
https://www.linkedin.com/in/anindyasd/
01
02
03
04
To justify and encourage investment
To calculate our value
To understand what is working
To improve our results
Why We Should Measure the Web?
Setting Up Google Analytic Account
Sign up at http://www.google.com/analytics
Get the code for your site
Copy and paste the code on your site template
Getting Clean Data on Your Website
Don’t be fooled by your traffic!
Search “whatsmyip” on Google
Copy your IP
Filter Your IP in Google Analytics
01
02
03
04
05
Audience Overview – Quick overview of your statistics
Traffic Sources – Where a visitor came from
Devices – What device a visitor uses to visit your website
Top Pages – Most popular pages on your website
Goals – Conversion & important event tracking
5 Important Aspects to Analyze
Quick overview of your statistics
Audience Overview
Sessions = Visits
How many visitors (new and returning)
have been to your website
Users = Unique Visitors
How many unique visitors (visitors that
have not been to your website before)
Pageviews
How many pages were visited/viewed
within a specific timeframe
Pageviews Per Visit
Average number of pages visited
/viewed per visitor
Avg. Session Duration
Average amount of time a visitor stays on your website
Note: In order to track, a visitor has to visit another page on your website
Bounce Rate
Percentage of visitors that
come to your website, visit
one page, and then leave
% New Sessions
Percentage of visitors that come
to your website for the first time
Few Notes with Audience Overview
1. Overall bounce rate benchmarks
• 26%-40% - Excellent
• 41%-55% - Average
• 56%-70% - Needs work or further analysis
2. Take spam traffic into account
• Look at Audience >> Geo >> Language for better assessment
3. Avg. Session time could be misleading
• Better overview: Behavior >> Site Content >> All Pages
Where a visitor came from
Traffic Sources
Users arrive at your website through a variety of sources, including search engines, social networks,
and advertising campaigns. By using Analytics to measure these campaigns and traffic sources, yo
u can improve your marketing efforts and user experiences.
How to Access Your Traffic Sources:
Acquisition >> All Traffic >> Channels
Other
Any traffic that doesn’t fit the other channel groupings.
Could also be a custom grouping such as media buys.
Paid Search
Traffic from paid media such as AdWords and Bing ads
Organic Search
Traffic from search engines such as Google, Bing, and
Yahoo. There is no cost associated with this traffic.
Direct
Traffic from a visitor either by; (1) typing your URL into the browser’s address bar (2)
clicking on a bookmark or (3) clicking on a link in an email, SMS, or chat message
Referral
Traffic from another website that links to your website
Social
Traffic from social media networks such as Facebook,
Twitter, Pinterest, and Instagram
What device a visitor uses to visit your website
Devices
Google Analytics tracks the type of device a visitor us
es to visit your website.
Devices are broken down into 3 data segments:
• Desktop contains laptops, netbooks
• Mobile phones covers smartphones
• Tablets includes standard iPads, Google Nexus,
Galaxy Tabs
How to Access Your Devices:
Audience >> Mobile >> Overview
Most important data points to analyze.
- What device is your traffic coming from?
- How much traffic is that device generating?
- Are visitors viewing one page and leaving?
- How long are visitors staying on your website?
- How well is that device converting?
Few Notes About Devices
• If you’re noticing a high bounce rate for mobile, you’ll want to analyze your
mobile website.
o Visitors want content quickly via mobile. Review your mobile user interf
ace and page load speeds to help lower the bounce rate.
• If you’re noticing a low average session duration, this means a particular de
vice is not keeping the visitor engage.
o View how your content is laid out on mobile and tablet and put the most
important elements (ex. a video, which increases session time) first bef
ore content.
Most popular pages on your website
Top Pages
Google Analytics tracks how each page performs individually on your website.
You’re able to use this data to determine:
• Pages that are popular (most visits, long session duration)
• Pages that need a revamp (high bounce rate, short session duration)
• Where visitors are abandoning your website (high bounce rate, high exit rate)
• Pages that are producing the most conversions
Which Page Matter?
Pageviews
How many times a page has been viewed
Unique Pageviews
How many unique visitors have visited a page
Avg. Time on Page
The average time spent on a specific page
Entrances
How many times a visitor landed on a page
from an outside traffic source
Bounce Rate
Percentage of visitors that come to your
website, visit one page, and then leave
% Exit
Percentage of visitors that come to your website, visit
multiple pages and then leave from a specific page
Conversion & important event tracking
Goals
Set Strategic Goals
Macro Goals
Top Line Revenue
New Leads, Product Sales, Phone Calls, etc
Micro Goals
Engaged Visitors
Brochure Downloads, Live Chats, Video Views, etc
You can set up to 20 goals!
Set Up Goals
Choose How to Track Goals
Enter Goals Details
http://www.pramanahotels.com/book
Friday, January 11th 2019 at 4 pm
Next Sharing Session
Anindya Santika Devi
Corporate Marketing Communications Manager
At Pramana Hotels & Resorts

Google Analytics - Getting Started and How to Measure Success

  • 1.
    http://www.free-powerpoint-templates-design.com FREE PPT TEMPLATES INSERT THETITLE OF YOUR PRESENTATION HERE Google Analytics Getting Started and How to Measure Success https://www.linkedin.com/in/anindyasd/
  • 2.
    01 02 03 04 To justify andencourage investment To calculate our value To understand what is working To improve our results Why We Should Measure the Web?
  • 3.
    Setting Up GoogleAnalytic Account Sign up at http://www.google.com/analytics
  • 4.
    Get the codefor your site
  • 5.
    Copy and pastethe code on your site template
  • 6.
    Getting Clean Dataon Your Website Don’t be fooled by your traffic!
  • 7.
    Search “whatsmyip” onGoogle Copy your IP
  • 8.
    Filter Your IPin Google Analytics
  • 9.
    01 02 03 04 05 Audience Overview –Quick overview of your statistics Traffic Sources – Where a visitor came from Devices – What device a visitor uses to visit your website Top Pages – Most popular pages on your website Goals – Conversion & important event tracking 5 Important Aspects to Analyze
  • 10.
    Quick overview ofyour statistics Audience Overview
  • 11.
    Sessions = Visits Howmany visitors (new and returning) have been to your website
  • 12.
    Users = UniqueVisitors How many unique visitors (visitors that have not been to your website before)
  • 13.
    Pageviews How many pageswere visited/viewed within a specific timeframe
  • 14.
    Pageviews Per Visit Averagenumber of pages visited /viewed per visitor
  • 15.
    Avg. Session Duration Averageamount of time a visitor stays on your website Note: In order to track, a visitor has to visit another page on your website
  • 16.
    Bounce Rate Percentage ofvisitors that come to your website, visit one page, and then leave
  • 17.
    % New Sessions Percentageof visitors that come to your website for the first time
  • 18.
    Few Notes withAudience Overview 1. Overall bounce rate benchmarks • 26%-40% - Excellent • 41%-55% - Average • 56%-70% - Needs work or further analysis 2. Take spam traffic into account • Look at Audience >> Geo >> Language for better assessment 3. Avg. Session time could be misleading • Better overview: Behavior >> Site Content >> All Pages
  • 19.
    Where a visitorcame from Traffic Sources
  • 20.
    Users arrive atyour website through a variety of sources, including search engines, social networks, and advertising campaigns. By using Analytics to measure these campaigns and traffic sources, yo u can improve your marketing efforts and user experiences. How to Access Your Traffic Sources: Acquisition >> All Traffic >> Channels
  • 21.
    Other Any traffic thatdoesn’t fit the other channel groupings. Could also be a custom grouping such as media buys.
  • 22.
    Paid Search Traffic frompaid media such as AdWords and Bing ads
  • 23.
    Organic Search Traffic fromsearch engines such as Google, Bing, and Yahoo. There is no cost associated with this traffic.
  • 24.
    Direct Traffic from avisitor either by; (1) typing your URL into the browser’s address bar (2) clicking on a bookmark or (3) clicking on a link in an email, SMS, or chat message
  • 25.
    Referral Traffic from anotherwebsite that links to your website
  • 26.
    Social Traffic from socialmedia networks such as Facebook, Twitter, Pinterest, and Instagram
  • 27.
    What device avisitor uses to visit your website Devices
  • 28.
    Google Analytics tracksthe type of device a visitor us es to visit your website. Devices are broken down into 3 data segments: • Desktop contains laptops, netbooks • Mobile phones covers smartphones • Tablets includes standard iPads, Google Nexus, Galaxy Tabs How to Access Your Devices: Audience >> Mobile >> Overview
  • 29.
    Most important datapoints to analyze. - What device is your traffic coming from? - How much traffic is that device generating? - Are visitors viewing one page and leaving? - How long are visitors staying on your website? - How well is that device converting?
  • 30.
    Few Notes AboutDevices • If you’re noticing a high bounce rate for mobile, you’ll want to analyze your mobile website. o Visitors want content quickly via mobile. Review your mobile user interf ace and page load speeds to help lower the bounce rate. • If you’re noticing a low average session duration, this means a particular de vice is not keeping the visitor engage. o View how your content is laid out on mobile and tablet and put the most important elements (ex. a video, which increases session time) first bef ore content.
  • 31.
    Most popular pageson your website Top Pages
  • 32.
    Google Analytics trackshow each page performs individually on your website. You’re able to use this data to determine: • Pages that are popular (most visits, long session duration) • Pages that need a revamp (high bounce rate, short session duration) • Where visitors are abandoning your website (high bounce rate, high exit rate) • Pages that are producing the most conversions Which Page Matter?
  • 33.
    Pageviews How many timesa page has been viewed
  • 34.
    Unique Pageviews How manyunique visitors have visited a page
  • 35.
    Avg. Time onPage The average time spent on a specific page
  • 36.
    Entrances How many timesa visitor landed on a page from an outside traffic source
  • 37.
    Bounce Rate Percentage ofvisitors that come to your website, visit one page, and then leave
  • 38.
    % Exit Percentage ofvisitors that come to your website, visit multiple pages and then leave from a specific page
  • 39.
    Conversion & importantevent tracking Goals
  • 40.
    Set Strategic Goals MacroGoals Top Line Revenue New Leads, Product Sales, Phone Calls, etc Micro Goals Engaged Visitors Brochure Downloads, Live Chats, Video Views, etc You can set up to 20 goals!
  • 41.
  • 42.
    Choose How toTrack Goals
  • 43.
  • 44.
    Friday, January 11th2019 at 4 pm Next Sharing Session
  • 45.
    Anindya Santika Devi CorporateMarketing Communications Manager At Pramana Hotels & Resorts