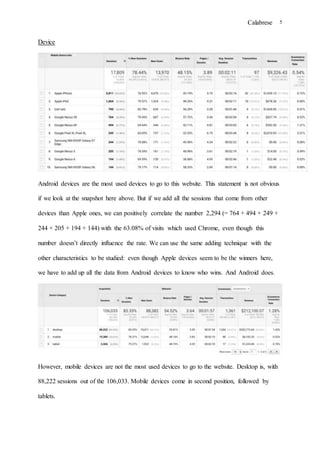
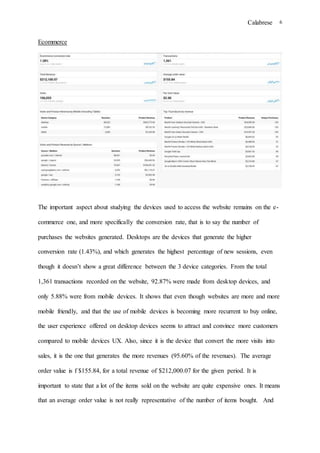
Analysis of data collected on the Google Merchandise Store through the use of Google Analytics tools in order to understand the current situation of the website and to develop solutions
3. Calabrese 3
Dashboard
This Google Analytics report will be performed over the period of October 7 to November 6,
2016. The data will be stated in each parts, but the overview parts will be the one with the
analyses of the data and the improvement solutions that could apply.
Audience snapshot
During the selected period, numbers of visitors came to the Google Merchandise Store
Website. The Audience snapshot provided by Google Analytics will help us analyze this
audience.
106,033 visitors, or audiences, came to the website. Out of these visitors, 88,382 are new
visitors, only 17,651 returned to the website. 92,241 visitors had at least one session, or came
at least once, during the given period. On average, these visitors spent 1.57 min on the
website, which can be linked to the bounce rate of 54.52%. Here, bounce rate indicates that
only 54.52% of the visits were single-page visits, which means that a visitor came to a page,
and left the website, without going further in his/her researches. If visitors would spend
1.57min on the same page, it would be weird. That is why these two numbers are positively
correlated: the more longer an average session duration is, the least probable the bounce rate
4. Calabrese 4
is to be high.
The website accumulates at total number of 385,916 pageviews, and it seems that visitors see
3.64 pages per time they come to the website, or per session. Finally, out of the 106,033,
83.29% came for the first time on the website.
Now, if we look at this snapshot, we can see that visitors are different in term of
demographics and psychographics. 54.14% of the visitors used the us-en website. Since this
setting is automatic, it means that most of them where/lived in countries that use the us-en
language as a default language. It can be verified by clicking on the country link on the left of
the page: 31.5% of the sessions where from the United States. We can add Canada with
2.37% of the session since it uses the same default language. Visitors are also different in
term of browser they use: 63.08% of them used Chrome as a browser, 28.84% used Safari.
These data can be used to determine the type of devices used (Apple or Android), as an
overview of the device section that follows.
5. Calabrese 5
Device
Android devices are the most used devices to go to this website. This statement is not obvious
if we look at the snapshot here above. But if we add all the sessions that come from other
devices than Apple ones, we can positively correlate the number 2,294 (= 764 + 494 + 249 +
244 + 205 + 194 + 144) with the 63.08% of visits which used Chrome, even though this
number doesn’t directly influence the rate. We can use the same adding technique with the
other characteristics to be studied: even though Apple devices seem to be the winners here,
we have to add up all the data from Android devices to know who wins. And Android does.
However, mobile devices are not the most used devices to go to the website. Desktop is, with
88,222 sessions out of the 106,033. Mobile devices come in second position, followed by
tablets.
6. Calabrese 6
Ecommerce
The important aspect about studying the devices used to access the website remains on the e-
commerce one, and more specifically the conversion rate, that is to say the number of
purchases the websites generated. Desktops are the devices that generate the higher
conversion rate (1.43%), and which generates the highest percentage of new sessions, even
though it doesn’t show a great difference between the 3 device categories. From the total
1,361 transactions recorded on the website, 92.87% were made from desktop devices, and
only 5.88% were from mobile devices. It shows that even though websites are more and more
mobile friendly, and that the use of mobile devices is becoming more recurrent to buy online,
the user experience offered on desktop devices seems to attract and convince more customers
compared to mobile devices UX. Also, since it is the device that convert the more visits into
sales, it is the one that generates the more revenues (95.60% of the revenues). The average
order value is f $155.84, for a total revenue of $212,000.07 for the given period. It is
important to state that a lot of the items sold on the website are quite expensive ones. It means
that an average order value is not really representative of the number of items bought. And
7. Calabrese 7
we can have an overview of what the items sold are. According to the snapshot, the most
successful product in term of revenues and number of purchases is the Nest® Cam Outdoor
Security Camera – USA. It means that even though the conversion rate is not high, Google
Merchandise Store knows on what aspects they should target customers based on their needs
and desires.
However, if we look at the overall conversion rate, which is of 1.28%, we can say that the
products sold are not very successful. The conversion rate is low, which means that visitors
come on the website but do not buy a lot. This is annoying for an online store. We will see in
the review part how this aspect could be improved.
Real-Time
The Real-time overview provided by Google Analytics allow us to see in real time how many
customers are on the website and how they arrive on the website. Here, 38% of them arrive by
clicking on the link found on Social Media, 29% of them come from organic search, 25% of
them come from direct search and finally, 8% of them come from referral links. Google
8. Calabrese 8
Analytics also give us the nature of the traffic source for each types of searches. Concerning
the social media, people came from YouTube, while those who arrived with an organic search
used Google Search Engine.
At this time, 79.17% of them are visiting the website while using a desktop, and 20.83% of
them uses their mobile device.
If we now look at their geographical location, most of them are from the California area,
which is where the headquarters of Google are. We can guess, looking at this map, that people
who would need Google accessories and apparel are most living or working in the area, where
Google is really famous. Finally, we can see on which page each of the customers are. For
example, 5 of them are on the home page, while one of them is on Women’s t-shirt.
SEO Performance
9. Calabrese 9
Google Analytics recorded 27,363 sessions coming from SEO, that is to say sessions that
originated from searches in Search Engine Browsers, such as Google, Bing or Yahoo. These
searches can be organic or paid.
Then, Google Analytics differentiate the nature of the sessions. First, it records Non-Branded
Visits from SEO. These visits are visits that were made after the customers wrote words not
related to the brand names in the Search Engine used. They rather used keywords that
expressed their needs, we can thus consider that these customers were not aware of the brand,
or low-involved customers. Second, it records Branded visits from SEO, that us to say
searches that we made using the name of the brand: customers were high-involved customers,
they knew about the brand and wanted to go on its website. After having separated these two
elements, Google Analytics provides an overview of the different Search Engine Browsers
that were used to create the sessions. The most used one is obviously Google, with 97.2% of
the results, followed by Baidu, the Chinese leader of Search Engines. Finally, it analyses the
nature of the traffic source. 56.2% of the traffic is referral, that is to say websites that
referenced this website, through external links toward the website. It could have been done in
blog articles, newspapers articles, videos…Organic searches are second, with 31.1% of the
traffic source. As a reminder, organic searches are clicks and sessions coming from organic
results, that is to say non-paid ads or results. Direct traffic sources are third, with a percentage
of 9.9. All of these data will be interpreted later in the audience summary.
10. Calabrese 10
Site Performance
The Average Page Load time in second is 6.18, the average Mobile Page Load Time in
second is 6.27. The page load time depends a lot on the browser used to research a term or the
website. According to the results, it seems that Opera mini and Safari in app are the most
rapid browser with a load time of 0 second. However, they are not the most used browser in
term of number of sessions, which can be a disadvantage. The most used browser is Chrome,
but it is not the faster one: it makes 66,82 sessions but the load time of the page is 5.71
seconds. The second faster bowser is Opera, with 4.47 seconds of loading. The slower
browser is YaBrowser, but it does not attract a lot of sessions so it is less of a big deal.
However, if we look at the well-known browser Firefox, it is also part of the slowest
browsers, with a load time of 11.03, and it is ranked #3 in term of number of sessions (3,361).
This can be a disadvantage too, that is going to be analyzed in the overview.
The load time per pages also is important. The page that is the slower to load is the Home
page, with a time of 8.78 seconds. This has a negative impact on consumer behavior because
it is the first page of the website, this is what welcomes them on the website. Conversion and
consumers’ feedbacks for a website are highly influenced by their user experience.
11. Calabrese 11
Audience-Overview
Before analyzing the data provided by Google Analytics, it is important to note that the
Google Merchandise Store is a new online store. Even though it obviously benefits from the
reputation of the brand name, the analysis will be like analyzing a new ecommerce website.
As we previously saw, most of the visitors are new visitors. It means that the website
targets a range of visitors that are interested enough to come once, but not to come back. Also,
the bounce rate is really high for a multinational company like Google. Not a lot of pages are
seen during a session. These elements help us highlight a first issue: visitors might come to
the website because they are curious of what it could sell, but once on the page, for most of
them, they either don’t do anything or spend a few minutes on the website, only visiting an
average of 3.64 pages. It means that the good job is done on acquiring potential customers,
but not on retaining them. The audience most uses the us-en version of the website, since
31.05% of the visitors are from the United States. Most of them come from Mountain View,
where is the Computer History Museum. But it is also where the Global Headquarters of
Google are! The Google Merchandise Store sells very specific products, targeted to a specific
population: according to the Interests overview, 3.85% of them are technophiles, and 6.39%
of them like Arts & Entertainment, TV and Video and Online Video. We can positively link
the location data to the user interests’ data.
The issue with the audience is that it is not broad enough. Not a lot of people on the
planet are aware of this website because not impacted or reached through advertising and/or
medias. You should really focus on targeting a broader range of their target market. Here, the
goal would not be to target different demographics, because we saw that the people that are
interested by the products sold have a reason for it: the supply matches the demand. However,
not all the technophiles on the planet live near Mountain View. And this is on this aspect that
you should work on.
12. Calabrese 12
Acquisition-Overview
Acquiring customers is done through the use of different tools.
Most of the customers arrived on the website thanks to social media. It means that
Google merchandise Website is advertised enough on those networks to attract customers. If
they are advertised enough, it also means that its SEO strategy is quite efficient. Indeed, it can
be referenced by Google’s social media but also but other accounts or people on social
medias. At the moment, the most successful social media for the website is YouTube. The
other major part of the customers came on the website through referral links.
Organic searches are also an important part of the traffic sources, but most of them are
non-branded, which means that people arrived there not because they knew the brand, but
rather because the keywords they used match those used by Google Search Engine
Optimization. Once again here, it proves that Google’s SEO is effective at attracting
customers. The most used device to visit the website is desktop, followed by mobile and then
tablets. It is also the one that generates the most revenues. Most of the visitors are male
technophiles interested in electronics and mobile phones. It means that the website does not
target a broad range of customers: that is the first element that might explain the customer
retention issue. These data are positively correlated to the top 10 products by revenue: visitors
buy electronics and they are the items that generate the most revenues. Now, if we analyze the
conversion rate, which is pretty low, we can draw conclusions about it: visitors and potential
buyers are young, they are technophiles but aren’t necessarily fans of Google. What is
important to understand is that they might be interested by the types of products, but not
necessarily by these specific products. Also, since they are young, their purchasing power
must be lower than the one of baby boomers for example.
Unfortunately, I don’t see how your website could change its target segment. You
target this segment because you sell Google products. You do not sell Google products to
13. Calabrese 13
target a specific market. The only way to acquire more of them would be to always do better
on the SEO techniques, and to better advertise the website so that organic and direct searches
traffic sources would be the most used ones.
Behavior-Overview
As we previously saw, the website is good at acquiring customers, but not at retaining them.
Their behavior of visitors is quite constant. During the period chosen, and based on the
Behavior Flow, a lot of customer came but not a lot exceeded 3 interactions.
They first mostly came on the home page. They were 88,000 arriving through the home page,
and 1,630.4 to come through other pages that had been made accessible through referral links
and social media contents. After this step, 95.2% of them left the website. This is a huge
number. This make us wonder what is wrong with this first page. Isn’t it attractive? Do people
realize they won’t find what they are looking for once on this page and decide to leave? This
second argument is totally possible if we look at the nature of the traffic we analyzed above:
people come to the website because they found links to it, and because they are curious, or
because they use the god keywords, but not because they look for a specific Google product
sold on the merchandise store. The other possible reason could be the load time that we talked
about previously in the Site Performance part: we noticed that the landing page was really
long to load, and even longer depending on the browser and devices used. Indeed, the most
used browser and also one of the longer to load the page, while the faster browser is not really
used or known by users. We also noticed that pages are longer to load when people are using
mobile devices. According to the website Hobo, every seconds count. If the loading time is
low, Google can crawl down the website. Also, it reported that each seconds added to the load
14. Calabrese 14
time impacts the revenue streams. For example, one more second is a decrease of 4.9% of
stream revenue over a 7-days period, and three more seconds represent a decrease of 7.2% of
revenues over a 7-days period. The website also explains us that the abandonment rate for a
fast website is 67%, which is already a big number, but it can increase up to 87% when the
landing page is slow. All of these characteristics added importantly decrease the quality of the
user experience on the website: they are not looking for something specific, they are here
because they found a link on their social media networks and they are curious, it takes time to
load the page, and they realize that what is sold is not what they look for. Under those
conditions, we would all do the same: we would leave. And this I what they do. Only 5,000
sessions went to the first interaction, and only 3.7K to the second interaction. After this step,
only 2.72% of the total traffic is still on the website.
This behavior obviously does not lead to a high conversion rate. But there are solutions to
make customers stay on your website. According to the website Advisor Internet Marketing,
interactive contents and videos are the first element to take into consideration. Nowadays,
people like more to watch rather than to read. The other point to consider is the behavior of
people once on the page: overall, they do not like to scroll down too much to look for
information, they need it right away. When we arrive on the website, we do not necessarily
know what it is about, we need to scroll down to discover about it: you need to prioritize the
content that is more likely to generate sells. For example, we saw that the most viewed
product was the Nest® Cam Outdoor Security Camera. This product should be the first item
that people see when they arrive on the website. The other point to focus on is the design of
the website: it is congruent but we do not feel on an online store, we more feel on a Google
page for productivity tools as we would find with Google Drive: this is not appealing, it does
not convey the desire to buy, it is way too much business oriented, and not fun oriented.
15. Calabrese 15
Works Cited
@hobo_web. "How Fast Should Your Web Page Load & How To Speed Up Your
Website." Hobo. N.p., 2016. Web. 14 Nov. 2016.