Downloaded 45 times


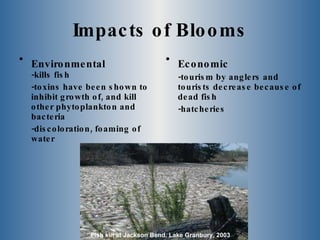
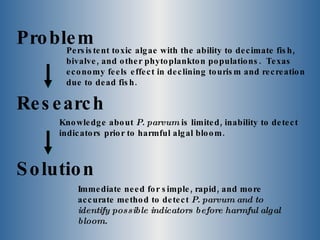
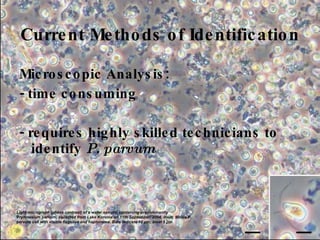
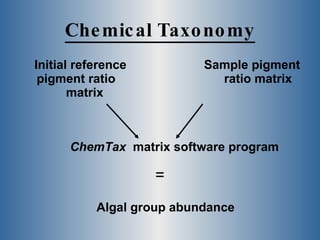
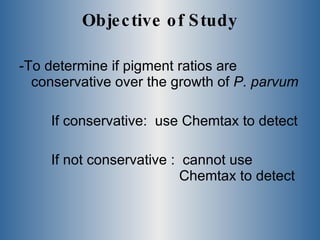
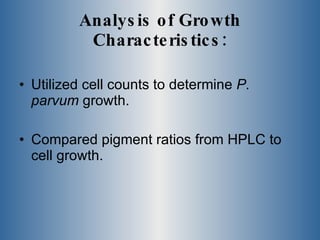
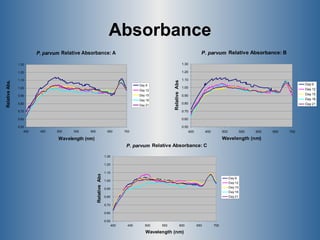
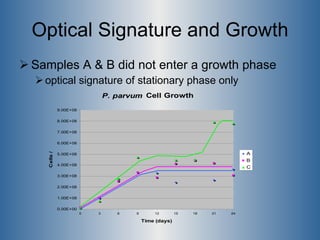
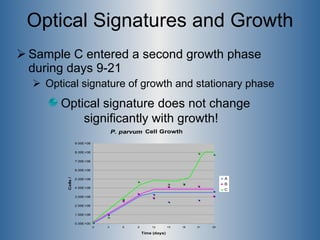


This document summarizes research on the golden algae Prymnesium parvum. It describes the organism's characteristics, environmental impacts from toxic algal blooms, and methods to identify and detect P. parvum. Experiments analyzed changes in pigmentation and optical absorption signatures over the algae's growth cycle. Results showed pigmentation ratios varied too much to use for detection, but optical signatures remained consistent, allowing rapid detection through remote sensing of blooms.


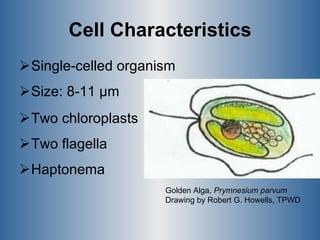
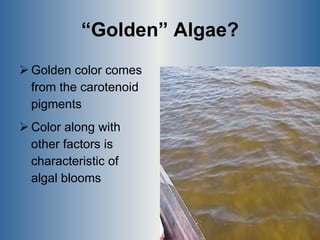
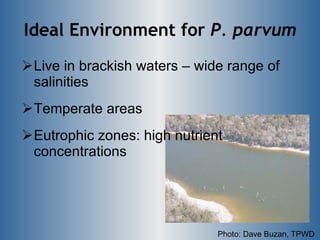
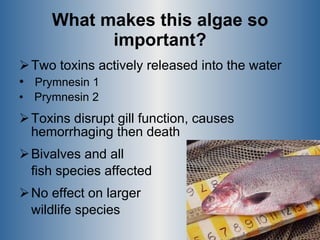
![Algae[1]](https://cdn.slidesharecdn.com/ss_thumbnails/algae1-120721122319-phpapp01-thumbnail.jpg?width=640&height=640&fit=bounds)


