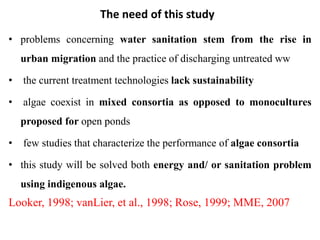
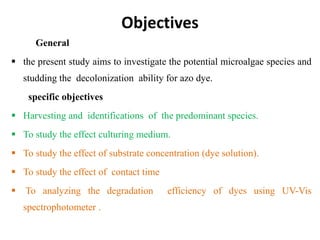
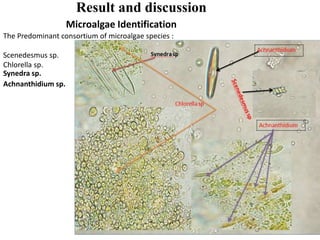
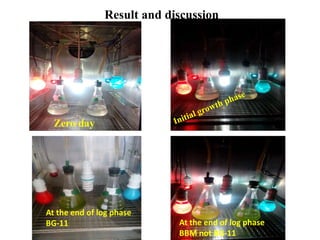
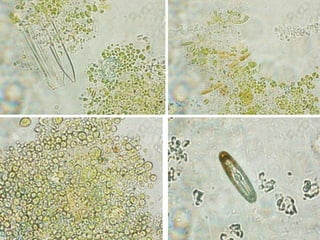
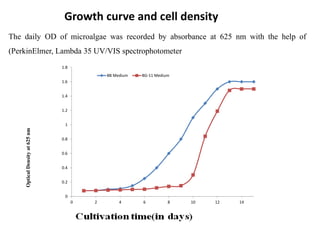
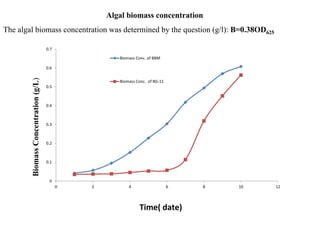
Bahir Dar Institute of Technology
Faculty of Chemical and Food Engineering
.Biodegradations of reactive blue dye using
freshwater microalgae
Thesis progress for the Degree of Master of
Science in, Environmental Engineering
By: Tadele Assefa Aragaw
June , 2016
Outline
• Introduction
• Statement of problem
• Objectives
• Methodology
• Result and Discussion
Introduction
• With the growing use of a variety of dyes pollution by dye wastewater is becoming
increasingly serious problem. There are about 3000 types of dyes on the world
market.
• More than 60 000 tone of dyes are released in wastewater every year all over the
world (ETAI), 1984).
• Purification of dye wastewater is a matter of great concern, and some treatment
methods have been developed (Gu, 1985).
• Biological methods, basically bacteria, are the most widely used as they are simple
to use and low in cost.
• But there have been few reports regarding degradation of azo dyes in wastewater by
algae. The present study will undertake to investigate the degradative potential of
azo dyes by micralgae and the Dominant microalgae species around bahir dar
marine area.
Why microalgae?
Cont.
• Microalgae can be classified into different classes and genera as shown in Table.
• According to the table, the size of microalgae ranges from a few micrometers to
more than 100µm. This list contains species of diatoms, flagellated,
chlorococcalean green algae, and filamentous blue-green algae.
Algae typically inhabit aquatic environments, soil and other exposed locations.
Statement of the problem
• chemical and physical processes, and electrochemical processes, such as (electro
coagulation), adsorption, activated carbon, membrane filtration and flocculation are
used mostly for color removal of Synthetic dyestuffs effluents. Also the reductive
cleavage of azo linkages is responsible for the formation of amines, which are classified
as toxic and carcinogenic specifically electrochemical methods treatment. Such methods
are often very costly and the dyes are removed as accumulates of concentrated sludge
which creates a disposal problem even produced more toxic substances. The potential
microalgae species which can be used for wastewater treatment, for biofuel production as
well as carbon sequestration have not yet been investigated from Amhara region
ponds, freshwater lake (Abay), rivers. So, investigating the predominant microalgal
species and used for biodegradations of azo dye is the aims of the research. The
application of microalgae for the biodegradation of azo dyes is an attractive alternative to
the development of bioremediation processes for the treatment of dye effluents.
The need of this study
• problems concerning water sanitation stem from the rise in
urban migration and the practice of discharging untreated ww
• the current treatment technologies lack sustainability
• algae coexist in mixed consortia as opposed to monocultures
proposed for open ponds
• few studies that characterize the performance of algae consortia
• this study will be solved both energy and/ or sanitation problem
using indigenous algae.
Looker, 1998; vanLier, et al., 1998; Rose, 1999; MME, 2007
Objectives
General
 the present study aims to investigate the potential microalgae species and
studding the decolonization ability for azo dye.
specific objectives
 Harvesting and identifications of the predominant species.
 To study the effect culturing medium.
 To study the effect of substrate concentration (dye solution).
 To study the effect of contact time
 To analyzing the degradation efficiency of dyes using UV-Vis
spectrophotometer .
Significance of the study
• The biological process removes dissolved matter in a way similar to
the self depuration but in a further and more efficient way than
Physical, chemical and electrochemical methods of treatment.
• It is Cost effective, Diverse metabolic pathways, Versatility of
microalgae.
• Identifying dominant species around bahir dar marine system is
essential to propose a project for harvesting those species which can
be uesed for waste treatment, biofuel, carbon sequestration.
• algae can play an important role in the removal of azo dyes and
aromatic amines.
Materials and equipment
• culturing vessels of different sizes
• light source( fluorescent lamp)
• fresh seawater
• aeration equipment
• CO2
• temperature control chamber(incubator)
• macro and micro nutrients
• balance
• autoclave
• pH meter
• microscope with digital camera
• Centrifuge
• UV/Vis spectrophotometer
Methodology
Growth media
• Water sample was collected from lake tana with different sampling location.
• The media stock solutions were prepared as shown from table3.1 and 3.2.
• There are numerous recipes available for the preparation of algal nutrients. The
one used depends on nutrient levels and the algal species cultured.
• Many fresh water algae can grow well with Bold Basal Medium (BBM)
(Bischoff and Bold, 1963) and BG-11(Allen1968,Allen and
Stanier1968,Rippkaetal.1979) and the PH was adjusted (6.7 +_0.3) with 0.1N
sodium hydroxide and hydrochloric acid.
• BBM and BG-11 macronutrients and micronutrients are used at the rate of 10
ml and 1mLfor each liter of algae cultured respectively.
Component
Stock Solution (g·L-1
dH2O) Quantity Used
Macronutrients
NaNO3 25.00 10mL
CaCl2 ·2H2O 2.50 10mL
MgSO4 ·7H2O 7.50 10mL
K2HPO4 7.50 10mL
KH2PO4 17.50 10mL
NaCl 2.50 10mL
AlkalineEDTASolution 1mL
EDTA 50.00
KOH 31.00
AcidifiedIronSolution 1mL
FeSO4 ·7H2O 4.98
H2SO4 1mL
BoronSolution 1mL
H3BO3 11.42
TraceMetalsSolution 1mL
ZnSO4 ·7H2O 8.82
MnCl2 ·4H2O 1.44
MoO3 0.71
CuSO4 ·5H2O 1.57
Co(NO3)2 ·6H2O 0.49
Bold’s Basal Medium (BBM) (Bischoff and Bold, 1963)
Component
Stock Solution (g·L-1
dH2O) Quantity Used
Ferric Citrate solution 1mL
Citrica cid 6 1mL
Ferric ammonium citrate 6 1mL
NaNO3
K2HPO4 ·3H2O
—
40
1.5g
1mL
MgSO4 ·7H2O 75 1mL
CaCl2 ·2H2O 36 1mL
Na2CO3 20 1mL
MgNa2EDTA·H2O 1.0 1mL
Tracemetalssolution
H3BO3
MnCl2 ·4H2O
ZnSO4 ·7H2O
ZnSO4 ·7H2O
Na2MoO4 ·2H2O
Co(NO3)2 ·6H2O
(See following recipe)
----
-----
----
79
49.4
1mL
2.86g
1.810 g
0.220 g
1 ml
0.39 g
1 ml
BG-11 medium (Allen1968,Allenand Stanier1968,Rippkaetal.1979)
Methodology
 Once obtained the small volume growth algae, by scale up several
new cultures were used progressively for larger vessels and some
of are kept as stocks (All the media compositions were sterilized
using autoclave at121ºC for 15 minutes at 15 psi).
 Harvesting with large vessel were taken to a batch PBR (500ml
and then 1000ml) conical flask used for higher biomass production
with 50ml and 100ml inoculums from the previously cultured
microalgae respectively.
Experimental setup
250ml, 500ml and 1000ml conical flask photobioreactor were used as batch reactors and
sealed with cap stoppers and glass tubes through which air fed, exhausted and screwed with
plastic covers.
Continuous Air flow from the air pump through polyvinylchloride pipes connected with the
glass tubes on the top of photobioreactor.
The air feed tube was immersed at the bottom of the growth container to allow mixing, to
prevent sedimentations of the algae, to ensure that all cell of the populations are equally
exposed to light and nutrients, and to improve gas exchange between the culture medium and
the air.
Two red, two blue and one cool white fluorescent lamps were employed as the light source
of growth with an average light intensity of 12,450 Lux and with 12D: 12L hour photoperiod
with negligible external light interference.
The volumetric air flow rate was 2.0 L/min. The bioreactor temperature was monitored
25+_2 0c with temperature controlled incubation chamber.
Zero day
Photo bioreactor set up with 12L/12D
on and off
Cell density and biomass concentration
There are different methods for cell density estimation such as direct cell count,
dry/wet weight and optical density (with absorbance).
When spectrophotometrical absorbance is the chosen method for cell density
estimation, a reading wavelength of 750 nm is usually recommended (EPA, 1994;
Eaton et al., 1995), although values of 680 nm (Rojícková-Padrtová and Marsálek,
1999; Geis et al., 2000; Markle et al., 2000) and 687 nm (Valer and Glock, 1998)
have also been used.
These values are correlated to the light absorbance of chlorophyll, which could
be best determined at a wavelength around 625 nm (Hersh and Crumpton, 1987;
Fargasová, 1996; Rojícková Padrtová et al., 1998).
Algal species identification
An Olympus DP73 automated microscope equipped with a digital camera used for
species identification .
Algal growth analysis:
Optical density
OD of microalgae recorded by absorbance at 625 nm with the
help of (PerkinElmer, Lambda 35 UV/VIS spectrophotometer
Algal biomass concentration
Concentration (g/l): B=0.38OD625
Methodology
Studding the Decolorizing ability of algae
Substrate concentration
• Removal of dye will be examined at different concentration of dye
solution. Five levels (50, 100,200, 400 and 600 mg/L) of azo dye will
be used to determine the best concentration for maximum
decolorization.
• The absorbance of the supernatant will be measured at the λmax
depending on the type of dye used by using Spectrophotometer.
Methodology
Effect of Contact time
 With the optimum PH, temperature, the
decolonization potential of the algae will be
investigated until the complete decolonization
days with in one day interval analysis.
Degradation analysis
The supernatant will be evaluated spectroscopic ally and
percentage reduction rates will be calculated.
The absorbance will be measured with a spectrophotometer at the
maximum absorption wavelengths of the azo dye. Decolorization
will be determined by absorbance reduction. The percentage of
decolorization will be performed by using the calculation as
follow:
Result and discussion
Microalgae Identification
The Predominant consortium of microalgae species :
Scenedesmus sp.
Chlorella sp.
Synedra sp.
Achnanthidium sp.
Result and discussion
Zero day
At the end of log phase
BBM not BG-11
At the end of log phase
BG-11
Growth curve and cell density
0
0.2
0.4
0.6
0.8
1
1.2
1.4
1.6
1.8
0 2 4 6 8 10 12 14
BB Medium BG-11 Medium
OpticalDensityat625nm
The daily OD of microalgae was recorded by absorbance at 625 nm with the help of
(PerkinElmer, Lambda 35 UV/VIS spectrophotometer
Algal biomass concentration
The algal biomass concentration was determined by the question (g/l): B=0.38OD625
0
0.1
0.2
0.3
0.4
0.5
0.6
0.7
0 2 4 6 8 10 12
Biomass Conc. of BBM
Biomass Conc. of BG-11
Time( date)
BiomassConcentration(g/L)
THANK YOU
Comment !!!!!!?

Masters Thesis progress

  • 1.
    Bahir Dar Instituteof Technology Faculty of Chemical and Food Engineering .Biodegradations of reactive blue dye using freshwater microalgae Thesis progress for the Degree of Master of Science in, Environmental Engineering By: Tadele Assefa Aragaw June , 2016
  • 2.
    Outline • Introduction • Statementof problem • Objectives • Methodology • Result and Discussion
  • 3.
    Introduction • With thegrowing use of a variety of dyes pollution by dye wastewater is becoming increasingly serious problem. There are about 3000 types of dyes on the world market. • More than 60 000 tone of dyes are released in wastewater every year all over the world (ETAI), 1984). • Purification of dye wastewater is a matter of great concern, and some treatment methods have been developed (Gu, 1985). • Biological methods, basically bacteria, are the most widely used as they are simple to use and low in cost. • But there have been few reports regarding degradation of azo dyes in wastewater by algae. The present study will undertake to investigate the degradative potential of azo dyes by micralgae and the Dominant microalgae species around bahir dar marine area.
  • 4.
  • 5.
    Cont. • Microalgae canbe classified into different classes and genera as shown in Table. • According to the table, the size of microalgae ranges from a few micrometers to more than 100µm. This list contains species of diatoms, flagellated, chlorococcalean green algae, and filamentous blue-green algae. Algae typically inhabit aquatic environments, soil and other exposed locations.
  • 6.
    Statement of theproblem • chemical and physical processes, and electrochemical processes, such as (electro coagulation), adsorption, activated carbon, membrane filtration and flocculation are used mostly for color removal of Synthetic dyestuffs effluents. Also the reductive cleavage of azo linkages is responsible for the formation of amines, which are classified as toxic and carcinogenic specifically electrochemical methods treatment. Such methods are often very costly and the dyes are removed as accumulates of concentrated sludge which creates a disposal problem even produced more toxic substances. The potential microalgae species which can be used for wastewater treatment, for biofuel production as well as carbon sequestration have not yet been investigated from Amhara region ponds, freshwater lake (Abay), rivers. So, investigating the predominant microalgal species and used for biodegradations of azo dye is the aims of the research. The application of microalgae for the biodegradation of azo dyes is an attractive alternative to the development of bioremediation processes for the treatment of dye effluents.
  • 7.
    The need ofthis study • problems concerning water sanitation stem from the rise in urban migration and the practice of discharging untreated ww • the current treatment technologies lack sustainability • algae coexist in mixed consortia as opposed to monocultures proposed for open ponds • few studies that characterize the performance of algae consortia • this study will be solved both energy and/ or sanitation problem using indigenous algae. Looker, 1998; vanLier, et al., 1998; Rose, 1999; MME, 2007
  • 8.
    Objectives General  the presentstudy aims to investigate the potential microalgae species and studding the decolonization ability for azo dye. specific objectives  Harvesting and identifications of the predominant species.  To study the effect culturing medium.  To study the effect of substrate concentration (dye solution).  To study the effect of contact time  To analyzing the degradation efficiency of dyes using UV-Vis spectrophotometer .
  • 9.
    Significance of thestudy • The biological process removes dissolved matter in a way similar to the self depuration but in a further and more efficient way than Physical, chemical and electrochemical methods of treatment. • It is Cost effective, Diverse metabolic pathways, Versatility of microalgae. • Identifying dominant species around bahir dar marine system is essential to propose a project for harvesting those species which can be uesed for waste treatment, biofuel, carbon sequestration. • algae can play an important role in the removal of azo dyes and aromatic amines.
  • 10.
    Materials and equipment •culturing vessels of different sizes • light source( fluorescent lamp) • fresh seawater • aeration equipment • CO2 • temperature control chamber(incubator) • macro and micro nutrients • balance • autoclave • pH meter • microscope with digital camera • Centrifuge • UV/Vis spectrophotometer
  • 11.
    Methodology Growth media • Watersample was collected from lake tana with different sampling location. • The media stock solutions were prepared as shown from table3.1 and 3.2. • There are numerous recipes available for the preparation of algal nutrients. The one used depends on nutrient levels and the algal species cultured. • Many fresh water algae can grow well with Bold Basal Medium (BBM) (Bischoff and Bold, 1963) and BG-11(Allen1968,Allen and Stanier1968,Rippkaetal.1979) and the PH was adjusted (6.7 +_0.3) with 0.1N sodium hydroxide and hydrochloric acid. • BBM and BG-11 macronutrients and micronutrients are used at the rate of 10 ml and 1mLfor each liter of algae cultured respectively.
  • 12.
    Component Stock Solution (g·L-1 dH2O)Quantity Used Macronutrients NaNO3 25.00 10mL CaCl2 ·2H2O 2.50 10mL MgSO4 ·7H2O 7.50 10mL K2HPO4 7.50 10mL KH2PO4 17.50 10mL NaCl 2.50 10mL AlkalineEDTASolution 1mL EDTA 50.00 KOH 31.00 AcidifiedIronSolution 1mL FeSO4 ·7H2O 4.98 H2SO4 1mL BoronSolution 1mL H3BO3 11.42 TraceMetalsSolution 1mL ZnSO4 ·7H2O 8.82 MnCl2 ·4H2O 1.44 MoO3 0.71 CuSO4 ·5H2O 1.57 Co(NO3)2 ·6H2O 0.49 Bold’s Basal Medium (BBM) (Bischoff and Bold, 1963)
  • 13.
    Component Stock Solution (g·L-1 dH2O)Quantity Used Ferric Citrate solution 1mL Citrica cid 6 1mL Ferric ammonium citrate 6 1mL NaNO3 K2HPO4 ·3H2O — 40 1.5g 1mL MgSO4 ·7H2O 75 1mL CaCl2 ·2H2O 36 1mL Na2CO3 20 1mL MgNa2EDTA·H2O 1.0 1mL Tracemetalssolution H3BO3 MnCl2 ·4H2O ZnSO4 ·7H2O ZnSO4 ·7H2O Na2MoO4 ·2H2O Co(NO3)2 ·6H2O (See following recipe) ---- ----- ---- 79 49.4 1mL 2.86g 1.810 g 0.220 g 1 ml 0.39 g 1 ml BG-11 medium (Allen1968,Allenand Stanier1968,Rippkaetal.1979)
  • 14.
    Methodology  Once obtainedthe small volume growth algae, by scale up several new cultures were used progressively for larger vessels and some of are kept as stocks (All the media compositions were sterilized using autoclave at121ºC for 15 minutes at 15 psi).  Harvesting with large vessel were taken to a batch PBR (500ml and then 1000ml) conical flask used for higher biomass production with 50ml and 100ml inoculums from the previously cultured microalgae respectively.
  • 15.
    Experimental setup 250ml, 500mland 1000ml conical flask photobioreactor were used as batch reactors and sealed with cap stoppers and glass tubes through which air fed, exhausted and screwed with plastic covers. Continuous Air flow from the air pump through polyvinylchloride pipes connected with the glass tubes on the top of photobioreactor. The air feed tube was immersed at the bottom of the growth container to allow mixing, to prevent sedimentations of the algae, to ensure that all cell of the populations are equally exposed to light and nutrients, and to improve gas exchange between the culture medium and the air. Two red, two blue and one cool white fluorescent lamps were employed as the light source of growth with an average light intensity of 12,450 Lux and with 12D: 12L hour photoperiod with negligible external light interference. The volumetric air flow rate was 2.0 L/min. The bioreactor temperature was monitored 25+_2 0c with temperature controlled incubation chamber.
  • 16.
    Zero day Photo bioreactorset up with 12L/12D on and off
  • 17.
    Cell density andbiomass concentration There are different methods for cell density estimation such as direct cell count, dry/wet weight and optical density (with absorbance). When spectrophotometrical absorbance is the chosen method for cell density estimation, a reading wavelength of 750 nm is usually recommended (EPA, 1994; Eaton et al., 1995), although values of 680 nm (Rojícková-Padrtová and Marsálek, 1999; Geis et al., 2000; Markle et al., 2000) and 687 nm (Valer and Glock, 1998) have also been used. These values are correlated to the light absorbance of chlorophyll, which could be best determined at a wavelength around 625 nm (Hersh and Crumpton, 1987; Fargasová, 1996; Rojícková Padrtová et al., 1998).
  • 18.
    Algal species identification AnOlympus DP73 automated microscope equipped with a digital camera used for species identification . Algal growth analysis: Optical density OD of microalgae recorded by absorbance at 625 nm with the help of (PerkinElmer, Lambda 35 UV/VIS spectrophotometer Algal biomass concentration Concentration (g/l): B=0.38OD625
  • 19.
    Methodology Studding the Decolorizingability of algae Substrate concentration • Removal of dye will be examined at different concentration of dye solution. Five levels (50, 100,200, 400 and 600 mg/L) of azo dye will be used to determine the best concentration for maximum decolorization. • The absorbance of the supernatant will be measured at the λmax depending on the type of dye used by using Spectrophotometer.
  • 20.
    Methodology Effect of Contacttime  With the optimum PH, temperature, the decolonization potential of the algae will be investigated until the complete decolonization days with in one day interval analysis.
  • 21.
    Degradation analysis The supernatantwill be evaluated spectroscopic ally and percentage reduction rates will be calculated. The absorbance will be measured with a spectrophotometer at the maximum absorption wavelengths of the azo dye. Decolorization will be determined by absorbance reduction. The percentage of decolorization will be performed by using the calculation as follow:
  • 22.
    Result and discussion MicroalgaeIdentification The Predominant consortium of microalgae species : Scenedesmus sp. Chlorella sp. Synedra sp. Achnanthidium sp.
  • 23.
    Result and discussion Zeroday At the end of log phase BBM not BG-11 At the end of log phase BG-11
  • 25.
    Growth curve andcell density 0 0.2 0.4 0.6 0.8 1 1.2 1.4 1.6 1.8 0 2 4 6 8 10 12 14 BB Medium BG-11 Medium OpticalDensityat625nm The daily OD of microalgae was recorded by absorbance at 625 nm with the help of (PerkinElmer, Lambda 35 UV/VIS spectrophotometer
  • 26.
    Algal biomass concentration Thealgal biomass concentration was determined by the question (g/l): B=0.38OD625 0 0.1 0.2 0.3 0.4 0.5 0.6 0.7 0 2 4 6 8 10 12 Biomass Conc. of BBM Biomass Conc. of BG-11 Time( date) BiomassConcentration(g/L)
  • 27.