Carbon Emissions
Whatare carbon emissions?
Carbon emissions mainly refer to
carbon dioxide (CO₂) released into the
air due to human activities.
Along with CO₂, other greenhouse
gases such as methane (CH₄) and
nitrous oxide (N₂O) are also included.
3.
Main sources:
Energyproduction:
burning coal, oil, and gas for Electricity
Transport: cars, buses, airplanes
Industries: cement, steel, chemicals
Deforestation: fewer trees to absorb
CO₂
Agriculture: livestock and fertilizers
4.
Why emissions matter:
Greenhouse gases trap heat
Increase Earth’s average temperature
Cause climate change
Example : More cars more fuel
→
burning more CO₂ higher
→ →
temperature
5.
Carbon Emission Scenarios
Simple explanation:
A carbon emission scenario is a
scientific plan that describes how
greenhouse gas emissions might
change in the future, depending on
human choices.
Important point:
❌ Not a prediction
✅ A possibility
6.
Scientists ask:
Whatif population grows fast?
What if renewable energy replaces
fossil fuels?
What if countries do nothing?
Each answer creates a different
scenario.
7.
Why Carbon EmissionScenarios Are Needed
1. Understanding future climate
Scenarios help scientists see how Earth’s climate
may look in 2050 or 2100.
2. Policy making
Governments use scenarios to:
Make climate laws
Decide emission targets
3. Risk assessment
Flood risk
Heat waves
Sea level rise
8.
Why Carbon EmissionScenarios Are Needed
4. Planning adaptation
Flood defenses
Heat-resistant crops
Example : If emissions remain high →
coastal cities need stronger sea walls.
9.
Factors That ShapeEmission Scenarios
(a) Population Growth
More people more food, energy,
→
housing
Leads to higher emissions
(b) Economic Development
Industrial growth increases emissions
Rich countries usually emit more
10.
Factors That ShapeEmission
Scenarios
(c) Technology
Clean technology lower emissions
→
Old technology higher emissions
→
(d) Energy
Use Fossil fuels high CO₂
→
Solar/wind low CO₂
→
(e) Government Policies
Carbon tax reduces emissions
No rules emissions rise
→
11.
What Are RCPs?
Definition:
RCPs are pathways that show how much
heat (radiative forcing) greenhouse gases
will trap in the atmosphere by 2100.
Radiative forcing:
Extra energy trapped in atmosphere
Measured in watts per square meter
(W/m²)
Higher RCP number = more warming.
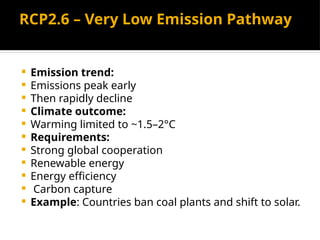
RCP2.6 – VeryLow Emission Pathway
Emission trend:
Emissions peak early
Then rapidly decline
Climate outcome:
Warming limited to ~1.5–2°C
Requirements:
Strong global cooperation
Renewable energy
Energy efficiency
Carbon capture
Example: Countries ban coal plants and shift to solar.
14.
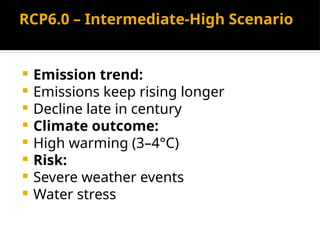
RCP6.0 – Intermediate-HighScenario
Emission trend:
Emissions keep rising longer
Decline late in century
Climate outcome:
High warming (3–4°C)
Risk:
Severe weather events
Water stress
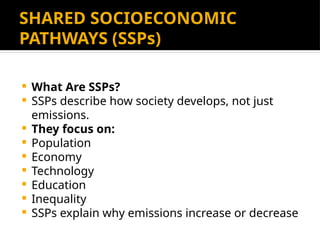
SHARED SOCIOECONOMIC
PATHWAYS (SSPs)
What Are SSPs?
SSPs describe how society develops, not just
emissions.
They focus on:
Population
Economy
Technology
Education
Inequality
SSPs explain why emissions increase or decrease
17.
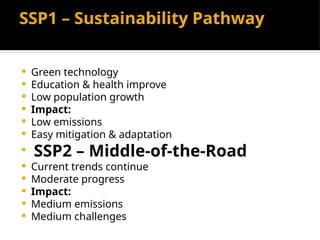
SSP1 – SustainabilityPathway
Green technology
Education & health improve
Low population growth
Impact:
Low emissions
Easy mitigation & adaptation
SSP2 – Middle-of-the-Road
Current trends continue
Moderate progress
Impact:
Medium emissions
Medium challenges
18.
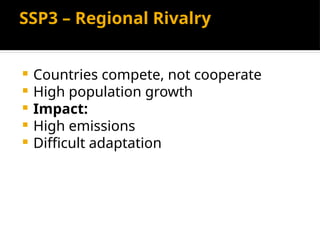
SSP3 – RegionalRivalry
Countries compete, not cooperate
High population growth
Impact:
High emissions
Difficult adaptation
19.
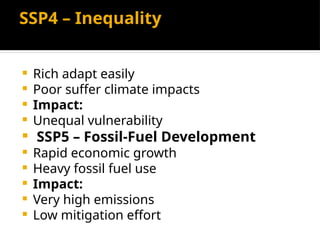
SSP4 – Inequality
Rich adapt easily
Poor suffer climate impacts
Impact:
Unequal vulnerability
SSP5 – Fossil-Fuel Development
Rapid economic growth
Heavy fossil fuel use
Impact:
Very high emissions
Low mitigation effort
20.
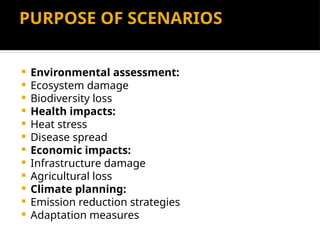
PURPOSE OF SCENARIOS
Environmental assessment:
Ecosystem damage
Biodiversity loss
Health impacts:
Heat stress
Disease spread
Economic impacts:
Infrastructure damage
Agricultural loss
Climate planning:
Emission reduction strategies
Adaptation measures
21.
MODELING AND ANALYSIS
Role of Climate Models (GCMs)
What are GCMs?
Large computer programs Simulate atmosphere, oceans, land
How scenarios are used:
Choose an emission scenario
Input data into GCM
Model simulates future climate
Scientists analyze results
Outputs from Models
Temperature maps
Rainfall patterns
Sea level rise
Extreme events
22.
EASY ANALOGY
Differentscenarios different outcomes.
→
Earth = patient
Carbon emissions = calories
Too many calories obesity
→
Balanced calories healthy body
→
EXAM-READY KEY NOTES
✔Emission scenarios are scientific tools
✔ RCPs focus on greenhouse gas concentration
✔ SSPs focus on socioeconomic development
✔ Used with climate models
✔ Help policy-making and adaptation🔚
FINAL SUMMARY
Carbon emission scenarios help us understand possible climate
futures.
Human choices today decide which scenario becomes reality.