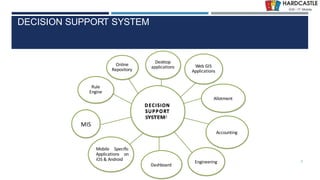
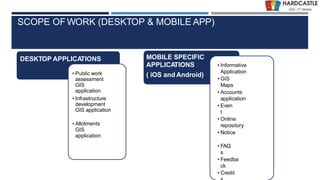
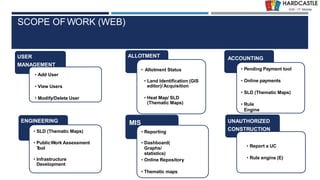
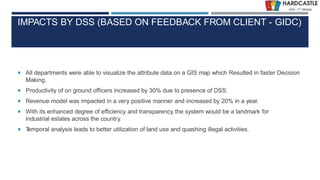
DEFINITION :
GIS is a powerful set of tools for collecting, storing , retrieving at will, transforming and displaying spatial data from the real world for a particular set of purposes
APPLICATION AREAS OF GIS
Agriculture
Business
Electric/Gas utilities
Environment
Forestry
Geology
Hydrology
Land-use planning
Local government
Mapping
11. Military
12. Risk management
13. Site planning
14. Transportation
15. Water / Waste water industry
COMPONENTS OF GIS
DATA INPUT
SPATIAL DATA MODEL
Data Model:
It describes in an abstract way how the data is represented in an information system or in DBMS
Spatial Data Model :
The models or abstractions of reality that are intended to have some similarity with selected aspects of the real world
Creation of analogue and digital spatial data sets involves seven levels of model development and abstraction
SPATIAL DATA MODEL
Conceptual model : A view of reality
Analog model : Human conceptualization leads to analogue abstraction
Spatial data models : Formalization of analogue abstractions without any conventions
Database model : How the data are recorded in the computer
Physical computational model : Particular representation of the data structures in computer memory
Data manipulation model : Accepted axioms and rules for handling the data
SPATIAL DATA MODEL
SPATIAL DATA MODEL
Objects on the earth surface are shown as continuous and discrete objects in spatial data models
Types of data models
Raster data model
vector data models
RASTER DATA MODEL
Basic Elements :
Extent
Rows
Columns
Origin
Orientation
Resolution: pixel = grain = grid cell
Ex: Bit Map Image (BMP),Joint Photographic Expert Group (JPEG), Portable Network Graphics(PNG) etc
RASTER DATA MODEL
VECTOR DATA MODEL
Basic Elements:
Location (x,y) or (x,y,z)
Explicit, i.e. pegged to a coordinate system
Different coordinate system (and precision) require different values
o e.g. UTM as integer (but large)
o Lat, long as two floating point numbers +/-
Points are used to build more complex features
Ex: Auto CAD Drawing File(DWG), Data Interchange(exchange) File(DXF), Vector Product Format (VPF) etc
VECTOR DATA MODEL
RASTER vs VECTORRaster is faster but Vector is corrector
TESSELLATIONS OF CONTINUOUS FIELDS
Triangular Irregular Network: (TIN)
TIN is a vector data structure for representing geographical information that is continuous
Digital elevation model
TIN is generally used to create Digital Elevation Model (DEM)
DIGITAL ELEVATION MODEL
DATA STRUCTURES
Data structure tells about how the data is stored
Data organization in raster data structures
Each cell is referenced directly
Each overlay Is referenced directly
Each mapping unit is referenced directly
Each overlay is separate file with general header
This document help you to prepare Triangulation Network (TIN), Hillshade Map, Slope map, interpolation and Digital Elevation Model (DEM) in a area and how to interpret them.
drought monitoring and management using remote sensingveerendra manduri
Monitoring drought and its management became easier with the help of remote sensing..several drought monitoring indices can be used to monitor drought condition. this ppt consists of information regarding droughts in relation to agriculture and their monitoring with the help of remotely sense based indices.
About Remote Sensing
Introduction To Precipitation
Forms of Precipitation
Measurement & Measuring Methods of Precipitation
Outcomes of Extreme Precipitation
Gis Geographical Information System FundamentalsUroosa Samman
Gis, Geographical Information System Fundamentals. This presentation includes a complete detail of GIS and GIS Softwares. It will help students of GIS and Environmental Science.
This presentation is about the raster and vector data in GIS which is important and costly as well, through the presentation we will learn about both type of data.
With EOfactory.ai, domain experts can
focus on their domain-related workflows and use automation for some of the other repeatable tasks
such as downloading imagery and
preprocessing.
The advent of technology and the vision to keep track with the latest technology, we the RKM group now indulging us in the field of GIS to integrate the mission friendly environment.
Moreover, the branch of GIS is a peculiar stream to convey the message of nature in visualizing, analyzing, interpreting the wide geographically concern scenario. A decision making tool that helps provide a better assessment and utilization of the resources.
LIDAR Magizine 2015: The Birth of 3D Mapping Artificial IntelligenceJason Creadore 🌐
Artificial intelligence (AI) has the potential to take the LiDAR
mapping market into hypergrowth. Following Moore’s law, with computation capacity doubling every 2 years, it is now possible for point cloud feature extraction to outpace the speed of data generation from laser scanning systems using artificial intelligence.
AABSyS Information Technology Private Limited - A GIS, CAD and Software Companywebaabsys
AABSyS Information Technology Private Limited, based in Bhubaneswar, Orissa, India has its core competencies in the areas of geographic information system (GIS), computer aided drafting (CAD), computer aided facility management (CAFM), remote sensing, hotogrammetry and software development, such as in GIS based application development with solutions for natural resource management, urban planning, environment, utility and e - governance.
Preliminary findings _OECD field visits to ten regions in the TSI EU mining r...OECDregions
Preliminary findings from OECD field visits for the project: Enhancing EU Mining Regional Ecosystems to Support the Green Transition and Secure Mineral Raw Materials Supply.
RFP for Reno's Community Assistance CenterThis Is Reno
Property appraisals completed in May for downtown Reno’s Community Assistance and Triage Centers (CAC) reveal that repairing the buildings to bring them back into service would cost an estimated $10.1 million—nearly four times the amount previously reported by city staff.
Monitoring Health for the SDGs - Global Health Statistics 2024 - WHOChristina Parmionova
The 2024 World Health Statistics edition reviews more than 50 health-related indicators from the Sustainable Development Goals and WHO’s Thirteenth General Programme of Work. It also highlights the findings from the Global health estimates 2021, notably the impact of the COVID-19 pandemic on life expectancy and healthy life expectancy.
About Potato, The scientific name of the plant is Solanum tuberosum (L).Christina Parmionova
The potato is a starchy root vegetable native to the Americas that is consumed as a staple food in many parts of the world. Potatoes are tubers of the plant Solanum tuberosum, a perennial in the nightshade family Solanaceae. Wild potato species can be found from the southern United States to southern Chile
Synopsis (short abstract) In December 2023, the UN General Assembly proclaimed 30 May as the International Day of Potato.
Working with data is a challenge for many organizations. Nonprofits in particular may need to collect and analyze sensitive, incomplete, and/or biased historical data about people. In this talk, Dr. Cori Faklaris of UNC Charlotte provides an overview of current AI capabilities and weaknesses to consider when integrating current AI technologies into the data workflow. The talk is organized around three takeaways: (1) For better or sometimes worse, AI provides you with “infinite interns.” (2) Give people permission & guardrails to learn what works with these “interns” and what doesn’t. (3) Create a roadmap for adding in more AI to assist nonprofit work, along with strategies for bias mitigation.
Jennifer Schaus and Associates hosts a complimentary webinar series on The FAR in 2024. Join the webinars on Wednesdays and Fridays at noon, eastern.
Recordings are on YouTube and the company website.
https://www.youtube.com/@jenniferschaus/videos
Jennifer Schaus and Associates hosts a complimentary webinar series on The FAR in 2024. Join the webinars on Wednesdays and Fridays at noon, eastern.
Recordings are on YouTube and the company website.
https://www.youtube.com/@jenniferschaus/videos
Donate to charity during this holiday seasonSERUDS INDIA
For people who have money and are philanthropic, there are infinite opportunities to gift a needy person or child a Merry Christmas. Even if you are living on a shoestring budget, you will be surprised at how much you can do.
Donate Us
https://serudsindia.org/how-to-donate-to-charity-during-this-holiday-season/
#charityforchildren, #donateforchildren, #donateclothesforchildren, #donatebooksforchildren, #donatetoysforchildren, #sponsorforchildren, #sponsorclothesforchildren, #sponsorbooksforchildren, #sponsortoysforchildren, #seruds, #kurnool
3. SOLUTIONS FOR INDUSTRIAL ESTATES
We developed a web and mobile based “Decision Support System” (DSS) which consists all the plots,
industrial estates, roads and various other GIS layers.These layers were surveyed and mapped on GIS
platform to create a database module for the Industrial Estates Digital Support System.
Public Works Management System is created by scanning and digitizing the entire data on paper
shared by the MIDC till date and integrated with GIS platform.This produced all the details of the job
assigned, vendor’s management, maintenance contract, penalty clause and more at the click of a
button.
Data generated from existing as well as new systems would then be passed on to the GIS System,
which would
generate thematic maps to help officials and teams to take faster decisions.
4. SCOPE OFWORK (DESKTOP & MOBILE APP)
DESKTOP APPLICATIONS
• Public work
assessment
GIS
application
• Infrastructure
development
GIS application
• Allotments
GIS
application
MOBILE SPECIFIC
APPLICATIONS
( iOS and Android)
• Informative
Application
• GIS
Maps
• Accounts
application
• Even
t
• Online
repository
• Notice
• FAQ
s
• Feedba
ck
• Credit
5. SCOPE OFWORK (WEB)
MIS
• Reporting
• Dashboard(
Graphs/
statistics)
• Online Repository
• Thematic maps
ACCOUNTING
• Pending Payment tool
• Online payments
• SLD (Thematic Maps)
• Rule
Engine
ENGINEERING
• SLD (Thematic Maps)
• PublicWork Assessment
Tool
• Infrastructure
Development
UNAUTHORIZED
CONSTRUCTION
• Report a UC
• Rule engine (E)
ALLOTMENT
• Allotment Status
• Land Identification (GIS
editor)/Acquisition
• Heat Map/ SLD
(Thematic Maps)
USER
MANAGEMENT
• Add User
• View Users
• Modify/Delete User
6. ADVANTAGES
A holistic view for the decision makers to analyze and generate reports on the current situation and
gaps in the processes.
Align the decision to the strategy and vision for better revenue generation for the corporation.
Bringing in Agility to the complete process which will empower to reduce turn around time and increase
efficiency and productivity.
Visually enhancing user experience for better understanding and data visualization.
14. IDENTIFICATION OF POSSIBLE UNAUTHORIZED CONSTRUCTION
(UC) - USING TEMPORAL ANALYSIS
Identification of Possible UC:
Unauthorized Construction of Building
Add. Floors Unauthorized Construction
Encroachments Checking (using rule
engine)
Illegal Acquisition of land
25. IMPACTS BY DSS (BASED ON FEEDBACK FROM CLIENT - GIDC)
All departments were able to visualize the attribute data on a GIS map which Resulted in faster Decision
Making.
Productivity of on ground officers increased by 30% due to presence of DSS.
Revenue model was impacted in a very positive manner and increased by 20% in a year.
With its enhanced degree of efficiency and transparency, the system would be a landmark for
industrial estates across the country.
Temporal analysis leads to better utilization of land use and quashing illegal activities.