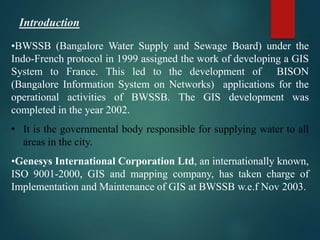
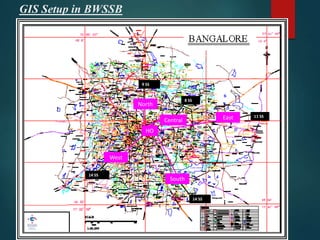
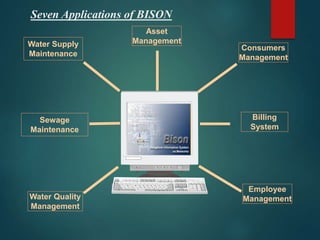
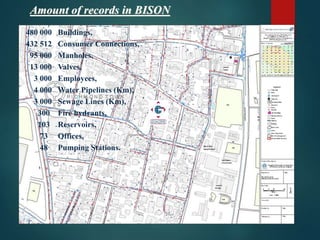
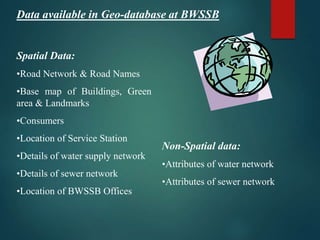
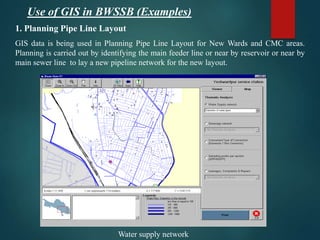
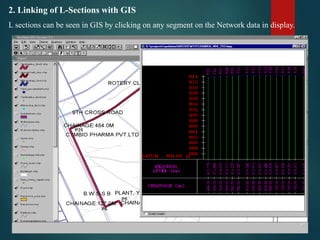
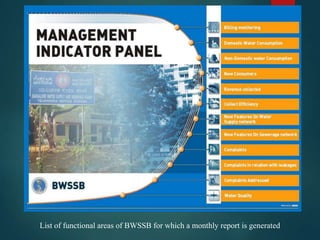
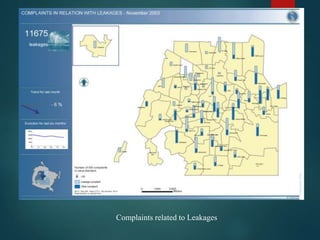
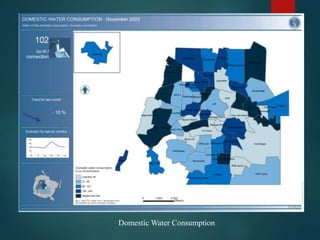
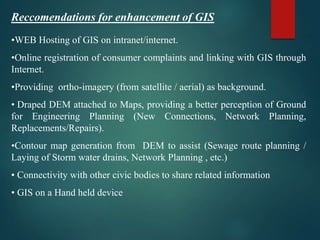
PANDIT DEENDAYAL
ENERGY UNIVERSITY
RS – GIS (ASSIGNMENT- 4)
PRESENTING : A CASE STUDY ON GIS APPLICATION IN
BWSSB (BANGALORE WATER SUPPLY AND SEWERAGE
BOARD)
GROUP: 8
MADE BY :
AXAY SHARMA (20MCL002)
HITESHREE MITHAIWALA (20MEN006)
MANAN VAJA (20MCT008)
GUIDED BY : PROF. DHRUVESH PATEL
•BWSSB (Bangalore Water Supply and Sewage Board) under the
Indo-French protocol in 1999 assigned the work of developing a GIS
System to France. This led to the development of BISON
(Bangalore Information System on Networks) applications for the
operational activities of BWSSB. The GIS development was
completed in the year 2002.
• It is the governmental body responsible for supplying water to all
areas in the city.
•Genesys International Corporation Ltd, an internationally known,
ISO 9001-2000, GIS and mapping company, has taken charge of
Implementation and Maintenance of GIS at BWSSB w.e.f Nov 2003.
Introduction
GIS Setup in BWSSB
HO
Central East
West
North
South
11 SS
14 SS
14 SS
9 SS
8 SS
Water Supply
Maintenance
Consumers
Management
Sewage
Maintenance
Billing
System
Employee
Management
Water Quality
Management
Asset
Management
Seven Applications of BISON
480 000 Buildings,
432 512 Consumer Connections,
95 000 Manholes,
13 000 Valves,
3 000 Employees,
4 000 Water Pipelines (Km),
3 000 Sewage Lines (Km),
300 Fire hydrants,
103 Reservoirs,
73 Offices,
48 Pumping Stations.
Amount of records in BISON
Data available in Geo-database at BWSSB
Spatial Data:
•Road Network & Road Names
•Base map of Buildings, Green
area & Landmarks
•Consumers
•Location of Service Station
•Details of water supply network
•Details of sewer network
•Location of BWSSB Offices
Non-Spatial data:
•Attributes of water network
•Attributes of sewer network
1. Planning Pipe Line Layout
GIS data is being used in Planning Pipe Line Layout for New Wards and CMC areas.
Planning is carried out by identifying the main feeder line or near by reservoir or near by
main sewer line to lay a new pipeline network for the new layout.
Water supply network
Use of GIS in BWSSB (Examples)
2. Linking of L-Sections with GIS
L sections can be seen in GIS by clicking on any segment on the Network data in display.
3. Facilitating Complaint Management and Maintenance Work
System is designed to cater to the need for addressing Complaints related to the
Water and Sewage Network.
The output from the System enables :
a. Quick identification of Location from the digital map
b. Better appreciation of the problem, as a holistic view of the network area is
available.
c. Connectivity with Service Stations provides speedy implementation of
corrective action.
d. A Database of all interactions is maintained and this serves as an input for
periodic analysis and decision making at Apex Level.
4. Thematic Analysis of Water Supply Distribution
Water Connection patterns like domestic, non domestic, partial domestic, industrial etc.
5. Water Quality Check
Data on the results of Water Quality Testing, done at the BWSSB laboratory, is stored
in the GIS for Analysis and Corrective action when required.
SAMPLING POINTS
An example - Statistical report on length of pipe lines for the city of Bangalore.The
statistics show the lengths of pipes for both sewer and water, Service Station wise.
List of functional areas of BWSSB for which a monthly report is generated
Complaints related to Leakages
Domestic Water Consumption
Reccomendations for enhancement of GIS
•WEB Hosting of GIS on intranet/internet.
•Online registration of consumer complaints and linking with GIS through
Internet.
•Providing ortho-imagery (from satellite / aerial) as background.
• Draped DEM attached to Maps, providing a better perception of Ground
for Engineering Planning (New Connections, Network Planning,
Replacements/Repairs).
•Contour map generation from DEM to assist (Sewage route planning /
Laying of Storm water drains, Network Planning , etc.)
• Connectivity with other civic bodies to share related information
• GIS on a Hand held device
References
 GIS Water Management system in Bangalore (BWSSB)
article
 https://www.indiawaterportal.org/articles/using-gis-
water-management-system-case-study-bangalore-water-
supply-and-sewerage-board
 www.globalsinc.com/.../BWSSB-case-study.pdf
 Computerized mapping and GIS development in
BWSSB Bangalore. Link is given below:
www.iwater-tech.com/.../11/Case-Study-BWSSB-GIS-
Project.pdf
A case study on GIS application

A case study on GIS application

  • 1.
    PANDIT DEENDAYAL ENERGY UNIVERSITY RS– GIS (ASSIGNMENT- 4) PRESENTING : A CASE STUDY ON GIS APPLICATION IN BWSSB (BANGALORE WATER SUPPLY AND SEWERAGE BOARD) GROUP: 8 MADE BY : AXAY SHARMA (20MCL002) HITESHREE MITHAIWALA (20MEN006) MANAN VAJA (20MCT008) GUIDED BY : PROF. DHRUVESH PATEL
  • 2.
    •BWSSB (Bangalore WaterSupply and Sewage Board) under the Indo-French protocol in 1999 assigned the work of developing a GIS System to France. This led to the development of BISON (Bangalore Information System on Networks) applications for the operational activities of BWSSB. The GIS development was completed in the year 2002. • It is the governmental body responsible for supplying water to all areas in the city. •Genesys International Corporation Ltd, an internationally known, ISO 9001-2000, GIS and mapping company, has taken charge of Implementation and Maintenance of GIS at BWSSB w.e.f Nov 2003. Introduction
  • 3.
    GIS Setup inBWSSB HO Central East West North South 11 SS 14 SS 14 SS 9 SS 8 SS
  • 4.
  • 5.
    480 000 Buildings, 432512 Consumer Connections, 95 000 Manholes, 13 000 Valves, 3 000 Employees, 4 000 Water Pipelines (Km), 3 000 Sewage Lines (Km), 300 Fire hydrants, 103 Reservoirs, 73 Offices, 48 Pumping Stations. Amount of records in BISON
  • 6.
    Data available inGeo-database at BWSSB Spatial Data: •Road Network & Road Names •Base map of Buildings, Green area & Landmarks •Consumers •Location of Service Station •Details of water supply network •Details of sewer network •Location of BWSSB Offices Non-Spatial data: •Attributes of water network •Attributes of sewer network
  • 7.
    1. Planning PipeLine Layout GIS data is being used in Planning Pipe Line Layout for New Wards and CMC areas. Planning is carried out by identifying the main feeder line or near by reservoir or near by main sewer line to lay a new pipeline network for the new layout. Water supply network Use of GIS in BWSSB (Examples)
  • 8.
    2. Linking ofL-Sections with GIS L sections can be seen in GIS by clicking on any segment on the Network data in display.
  • 9.
    3. Facilitating ComplaintManagement and Maintenance Work System is designed to cater to the need for addressing Complaints related to the Water and Sewage Network. The output from the System enables : a. Quick identification of Location from the digital map b. Better appreciation of the problem, as a holistic view of the network area is available. c. Connectivity with Service Stations provides speedy implementation of corrective action. d. A Database of all interactions is maintained and this serves as an input for periodic analysis and decision making at Apex Level.
  • 10.
    4. Thematic Analysisof Water Supply Distribution Water Connection patterns like domestic, non domestic, partial domestic, industrial etc.
  • 11.
    5. Water QualityCheck Data on the results of Water Quality Testing, done at the BWSSB laboratory, is stored in the GIS for Analysis and Corrective action when required. SAMPLING POINTS
  • 12.
    An example -Statistical report on length of pipe lines for the city of Bangalore.The statistics show the lengths of pipes for both sewer and water, Service Station wise.
  • 13.
    List of functionalareas of BWSSB for which a monthly report is generated
  • 14.
  • 15.
  • 16.
    Reccomendations for enhancementof GIS •WEB Hosting of GIS on intranet/internet. •Online registration of consumer complaints and linking with GIS through Internet. •Providing ortho-imagery (from satellite / aerial) as background. • Draped DEM attached to Maps, providing a better perception of Ground for Engineering Planning (New Connections, Network Planning, Replacements/Repairs). •Contour map generation from DEM to assist (Sewage route planning / Laying of Storm water drains, Network Planning , etc.) • Connectivity with other civic bodies to share related information • GIS on a Hand held device
  • 17.
    References  GIS WaterManagement system in Bangalore (BWSSB) article  https://www.indiawaterportal.org/articles/using-gis- water-management-system-case-study-bangalore-water- supply-and-sewerage-board  www.globalsinc.com/.../BWSSB-case-study.pdf  Computerized mapping and GIS development in BWSSB Bangalore. Link is given below: www.iwater-tech.com/.../11/Case-Study-BWSSB-GIS- Project.pdf