Download to read offline

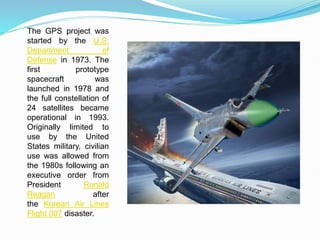
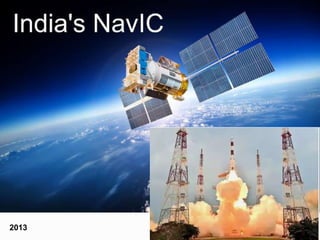
![From the early
1990s, GPS
positional
accuracy was
degraded by the
United States
government by a
program
called Selective
Availability, which
could selectively
degrade or deny
access to the
system at any
time,[8] as
happened to the
Indian military in
1999 during
the Kargil War.](https://image.slidesharecdn.com/20-240625050618-e5493bec/85/GIS_Geographical-Information-System-Global-Positioning-System-in-Geography-9-320.jpg)
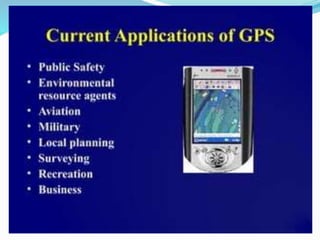
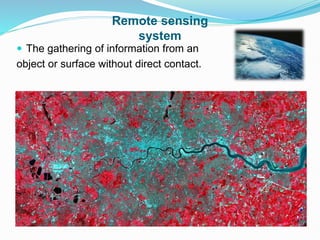
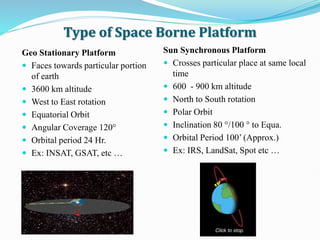

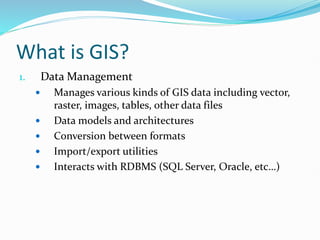
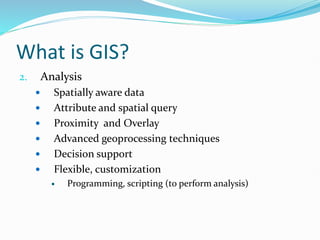
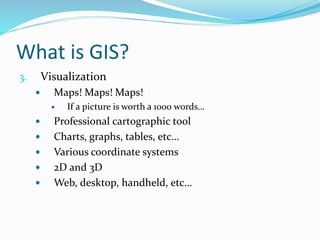
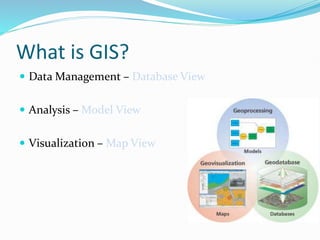
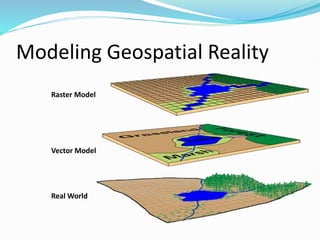
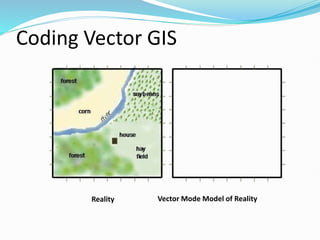
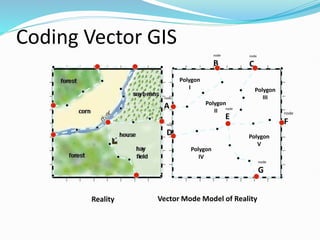
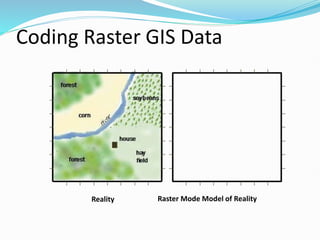
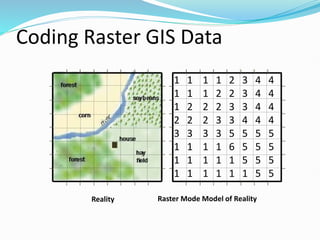
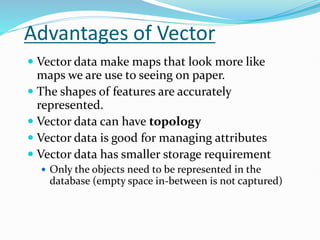
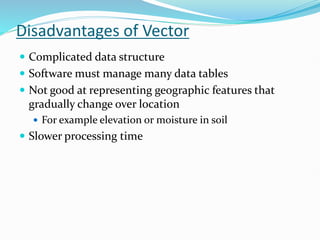
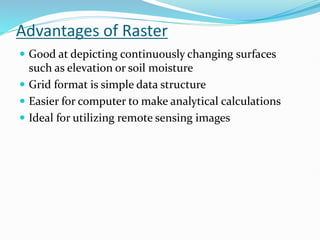


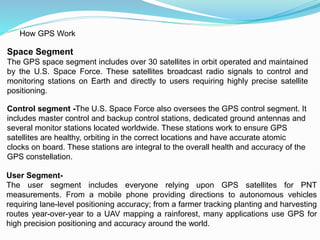
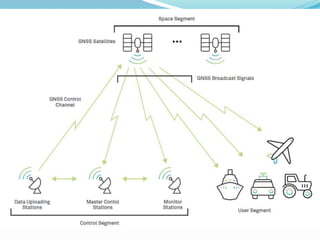
The document provides an overview of GPS and GIS technology, highlighting the components of GPS including the space, control, and user segments, as well as the evolution of GPS from military to civilian use. It explains GIS as a system for managing, analyzing, and visualizing geographic data, and discusses its applications in urban planning, environmental analysis, and other fields. Additionally, the document covers the technical aspects of vector and raster data models, their advantages and disadvantages, and the integration of GIS technology in various sectors.


