Download as PDF, PPTX


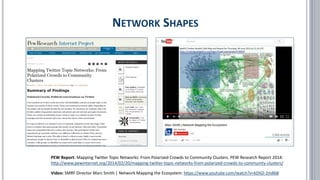
![1
[Divided]
Polarized Crowds
[Unified]
Tight Crowd
[Fragmented]
Brand Clusters
[Clustered]
Community Clusters
[In-Hub & Spoke]
Broadcast Network
[Out-Hub & Spoke]
Support Network
NETWORK SHAPES](https://image.slidesharecdn.com/gijc19-nodexltutorialsession1-191108171703/85/GIJC19-NodeXL-Tutorial-Session-1-7-320.jpg)
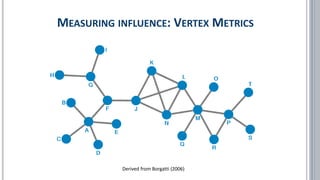
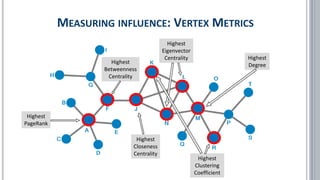


![▪ Borgatti, Stephen P. (2006): Identifying sets of key players in a social network. In: Comput Math Organiz Theor (2006) 12:
21–34 [DOI 10.1007/s10588-006-7084-x]
▪ Castells, Manuel (1996): The Rise of the Network Society, Malden: Blackwell Publishers.
▪ Aaron Clauset, M. E. J. Newman, and Cristopher Moore (2004): Finding community structure in very large networks. In:
Phys. Rev. E 70.
▪ Dicken, Peter (2011): Global Shift – Mapping the Changing Contours of the World Economy (6th edition). Sage Publications.
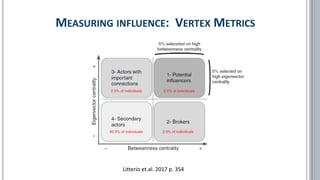
▪ Litterio, Arnaldo M., et. al. (2017): "Marketing and social networks: a criterion for detecting opinion leaders", European
Journal of Management and Business Economics, Vol. 26 Issue: 3, pp.347-366, https://doi.org/10.1108/EJMBE-10-2017-
020
▪ Frank W. Takes, Eelke M. Heemskerk (2016): Centrality in the global network of corporate control. Social Network Analysis
and Mining, December 2016, 6:97). Online unter: https://link.springer.com/article/10.1007/s13278-016-0402-5
▪ Tingting Yan, Thomas Y. Choi, Yusoon Kim, Yang Yang (2015): A Theory of the Nexus Supplier: A Critical Supplier From A
Network Perspective. Journal of Supply Chain Management, 51-1 pp: 3-92. Online unter:
https://onlinelibrary.wiley.com/doi/abs/10.1111/jscm.12070
LITERATURE / LINKS](https://image.slidesharecdn.com/gijc19-nodexltutorialsession1-191108171703/85/GIJC19-NodeXL-Tutorial-Session-1-35-320.jpg)
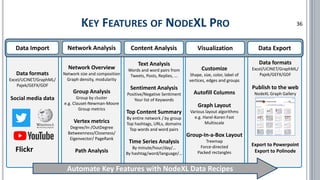

The document provides a comprehensive overview of social network analysis (SNA) using NodeXL Pro, covering its key features, metrics, and techniques for analyzing social media networks. It discusses methods for measuring and visualizing connections among users or content, such as edge creation and vertex metrics, alongside examples of network types from Twitter, YouTube, and Wikipedia. Additionally, it includes references to resources, tutorials, and literature for further exploration of SNA methodologies and applications.


