Download to read offline
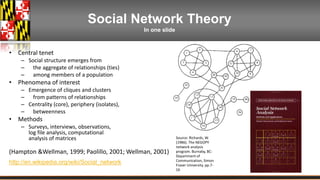
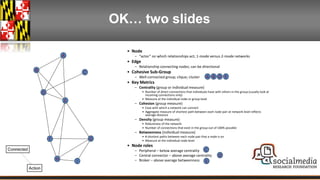
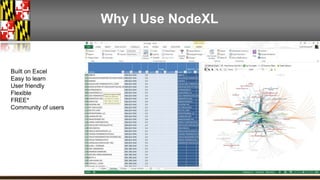
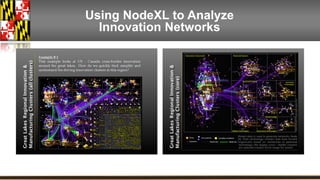
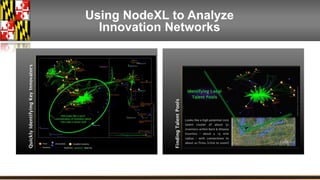
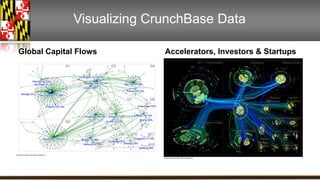

This document summarizes a presentation about using NodeXL to visualize social network data from Twitter, MapBox, and other sources. It introduces NodeXL as a free and easy-to-use tool for social network analysis built on Excel. The presentation discusses key concepts in social network theory like nodes, edges, centrality, and clustering. It then shows examples of using NodeXL to analyze innovation networks and visualize data from CrunchBase on capital flows between startups, accelerators, and investors. The purpose is to demonstrate how network analysis and visualization with NodeXL can provide insights into clusters and connections in social and innovation ecosystems.


![Realff wires-ict2013-final [modalità compatibilità]](https://cdn.slidesharecdn.com/ss_thumbnails/realff-wires-ict2013-finalmodalitcompatibilit-131118053507-phpapp01-thumbnail.jpg?width=640&height=640&fit=bounds)


