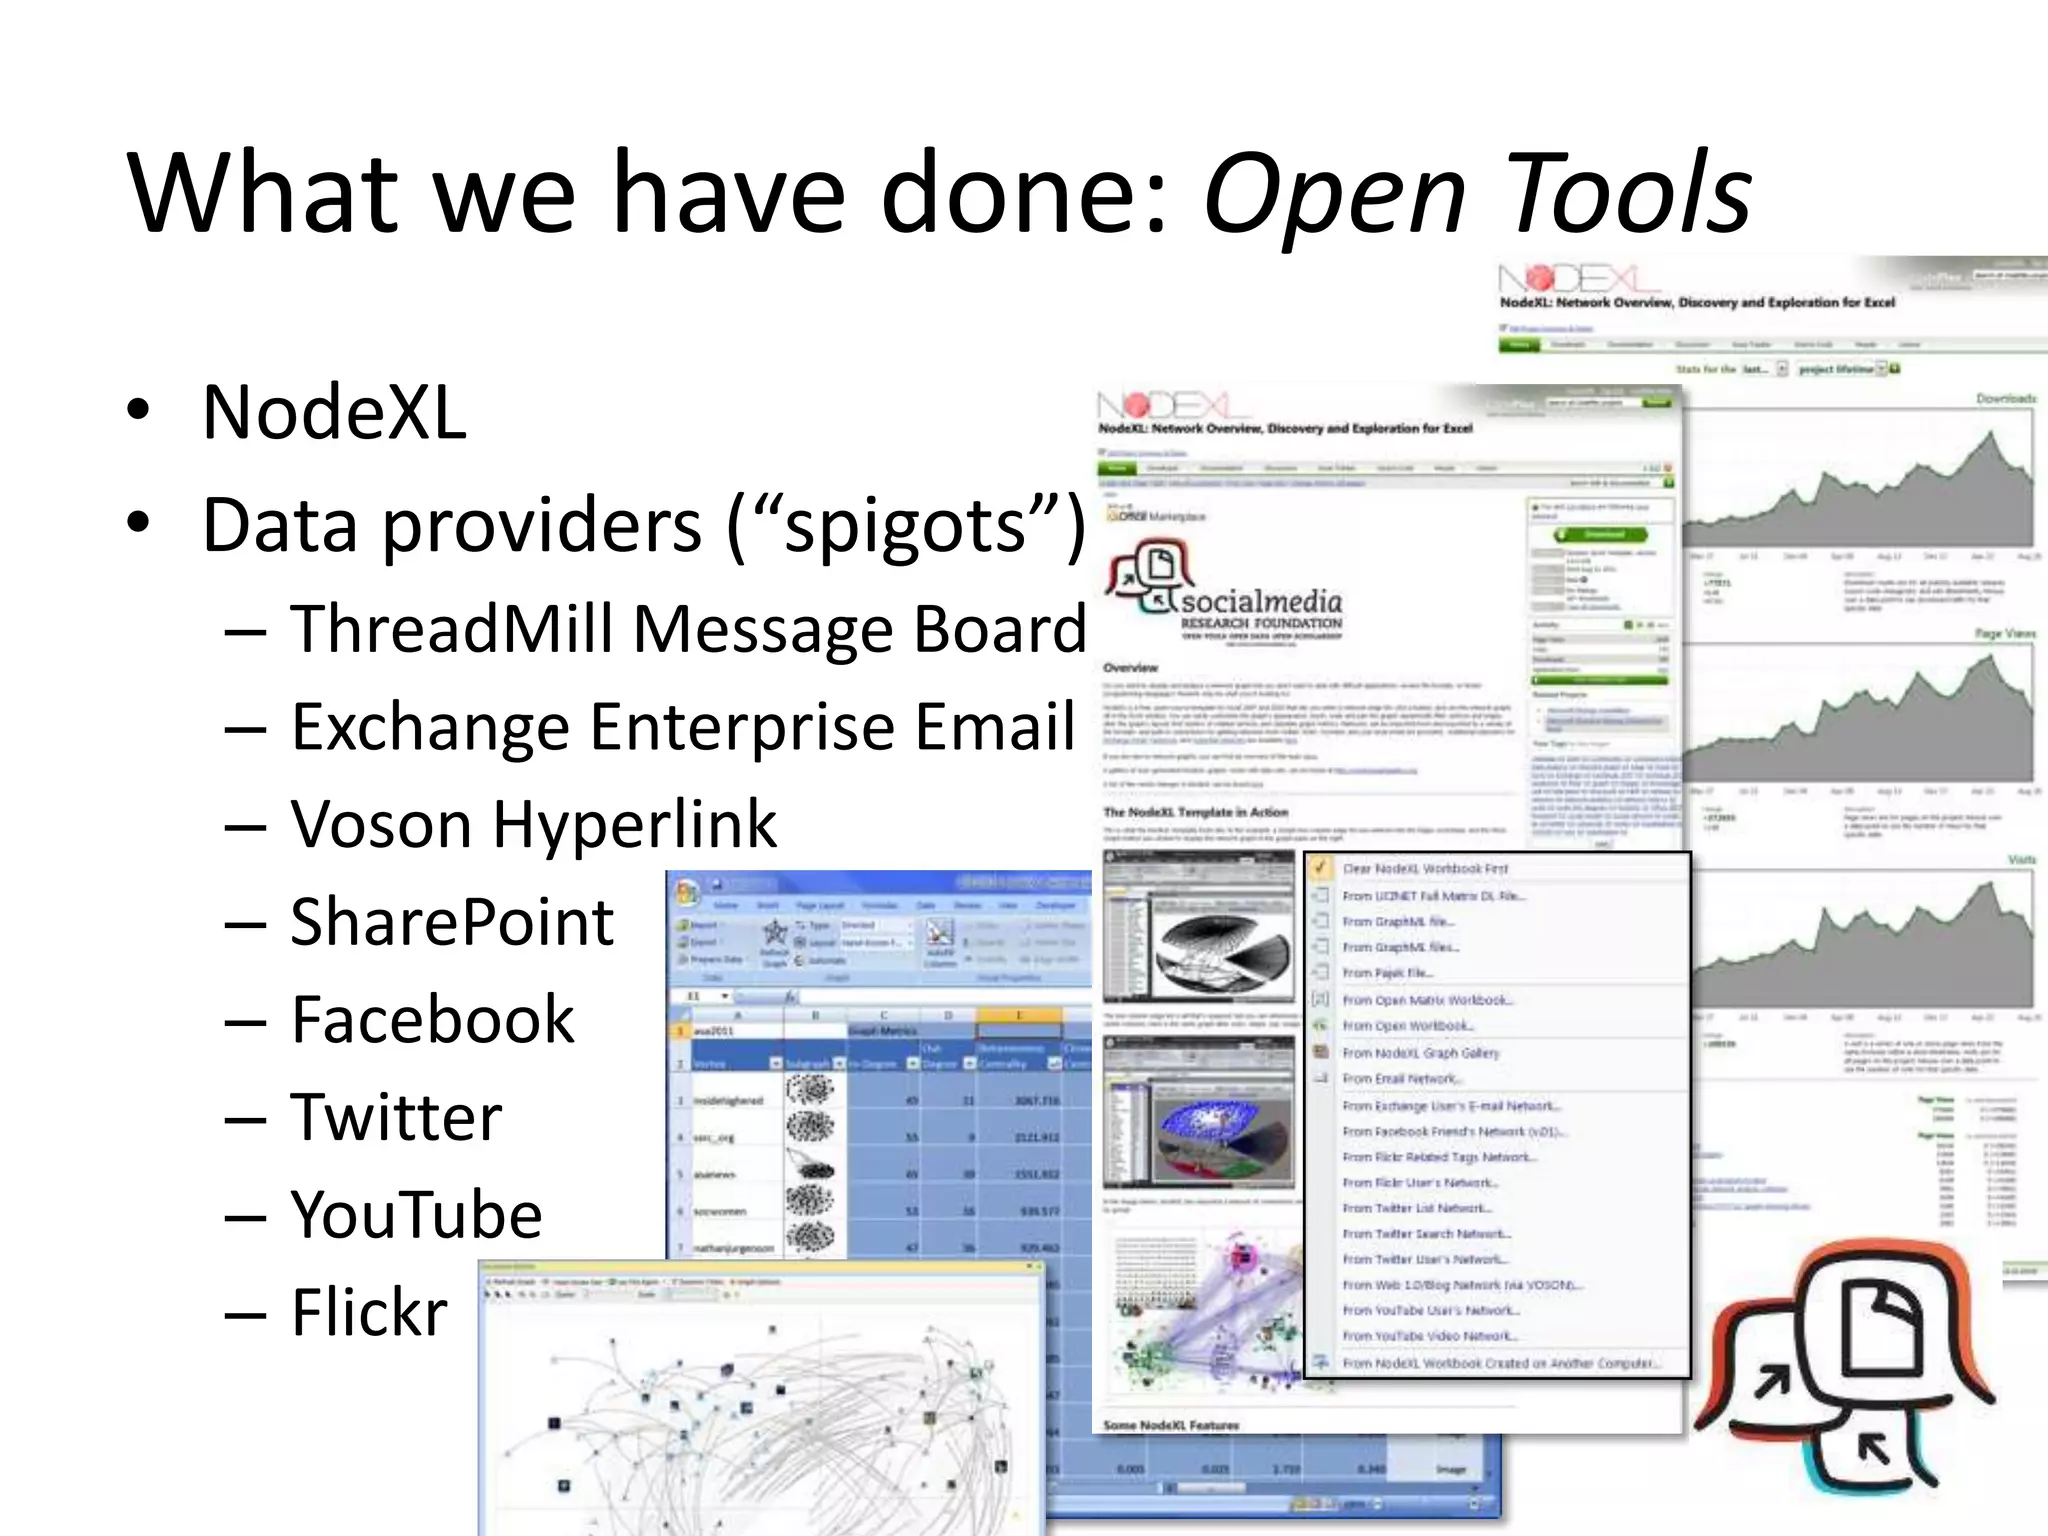
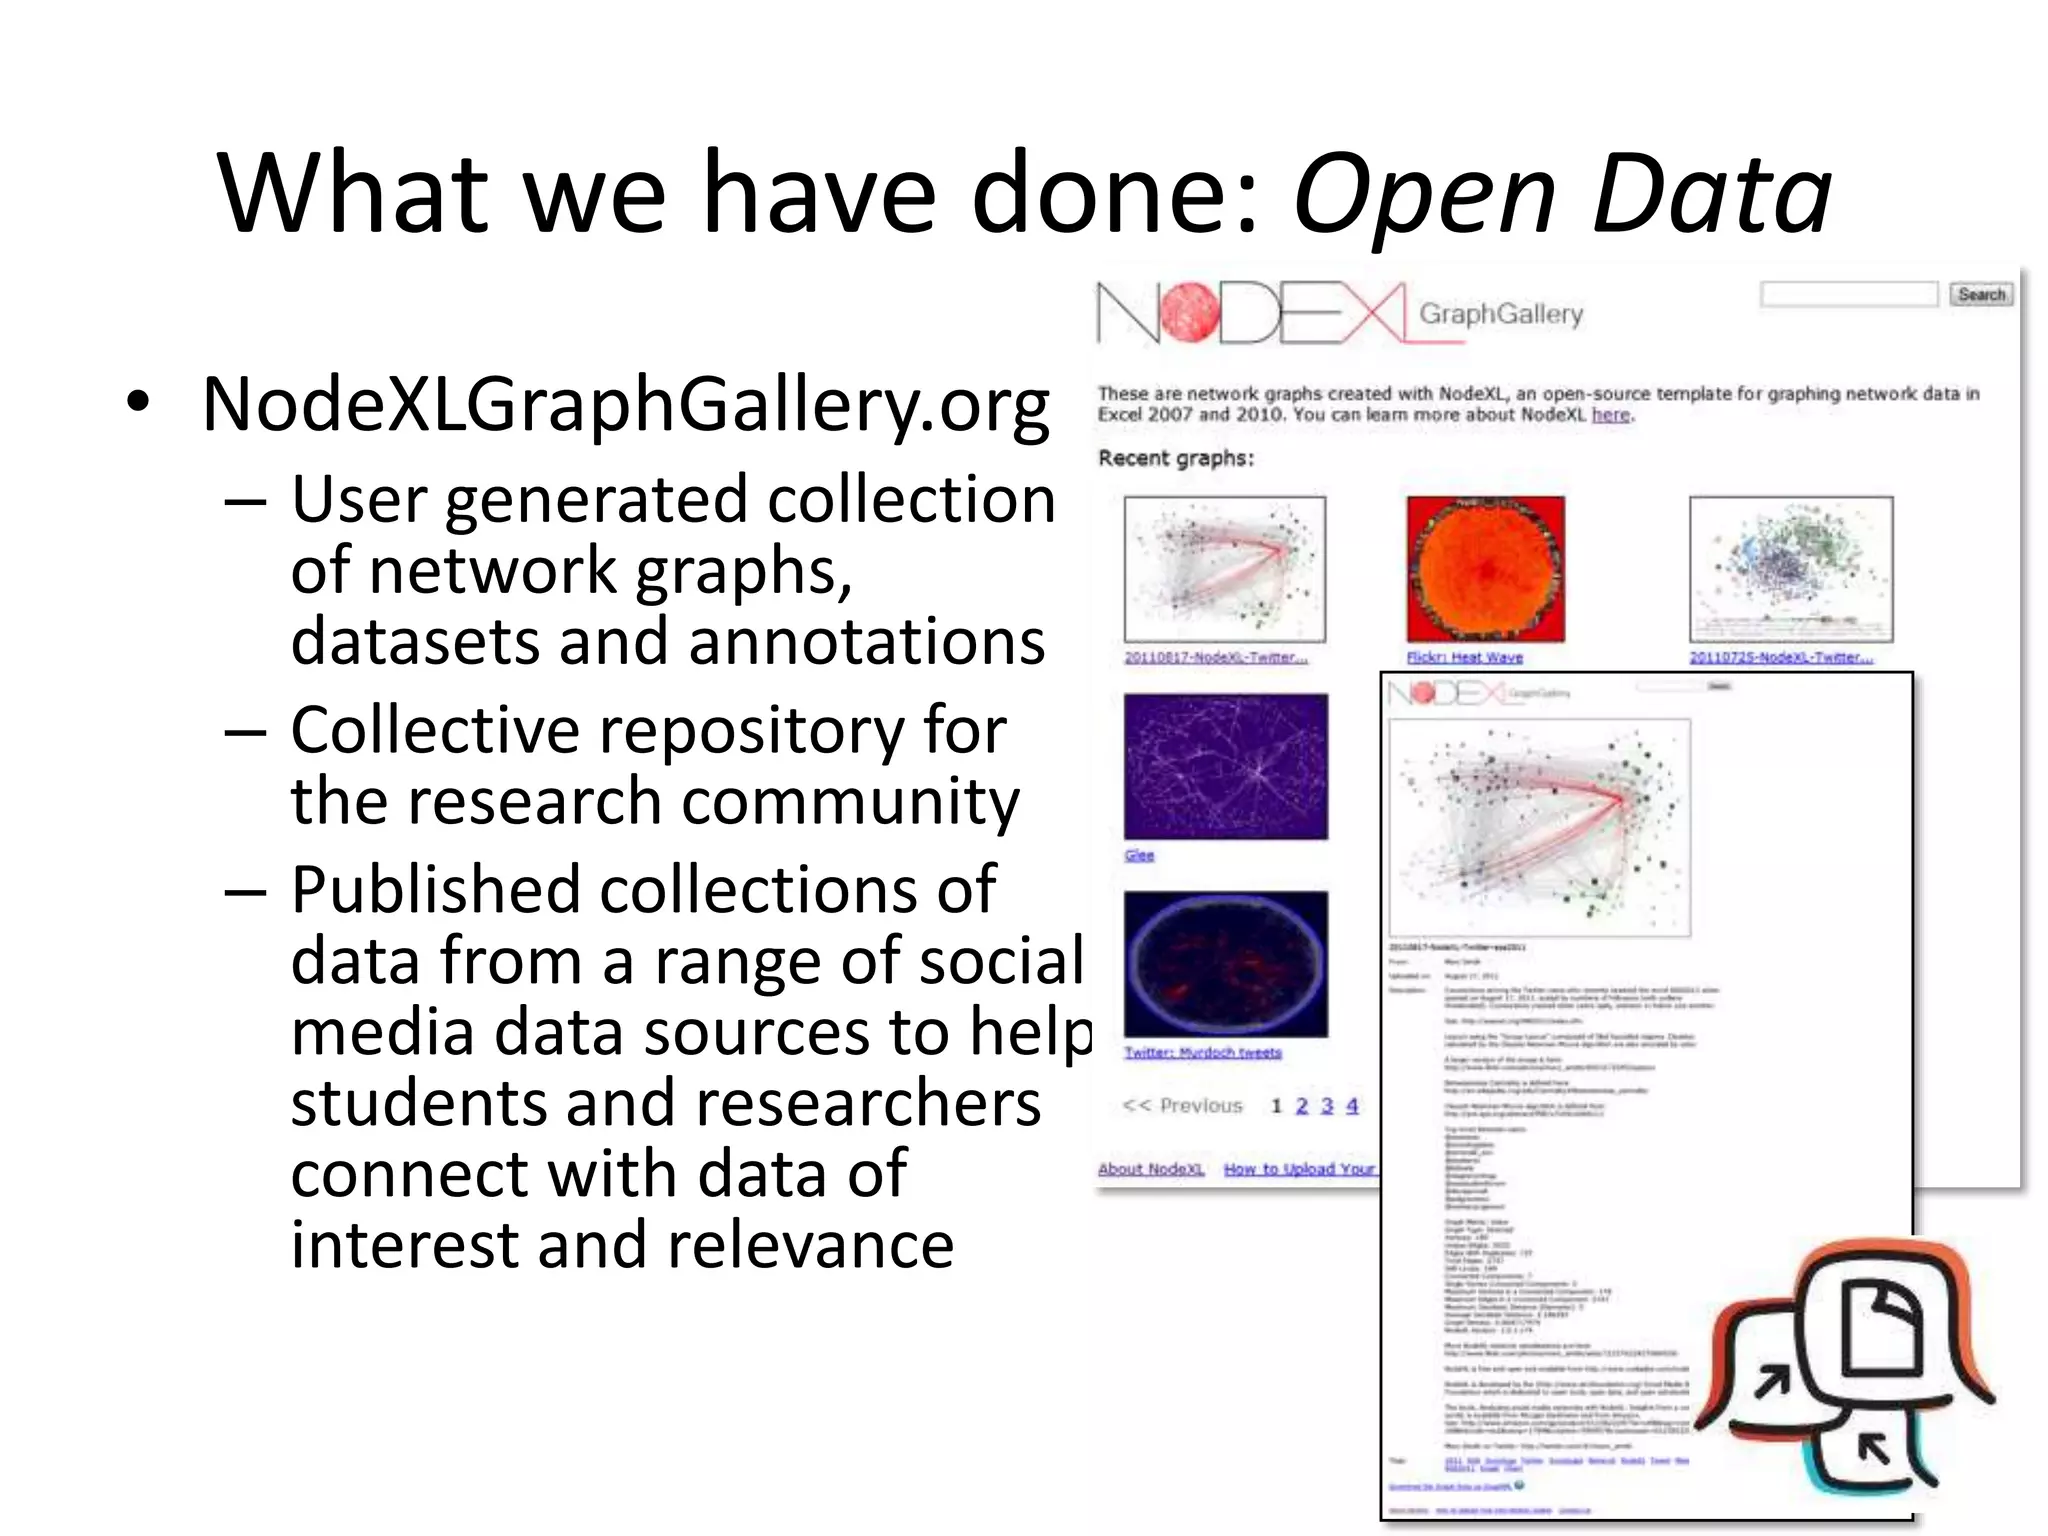
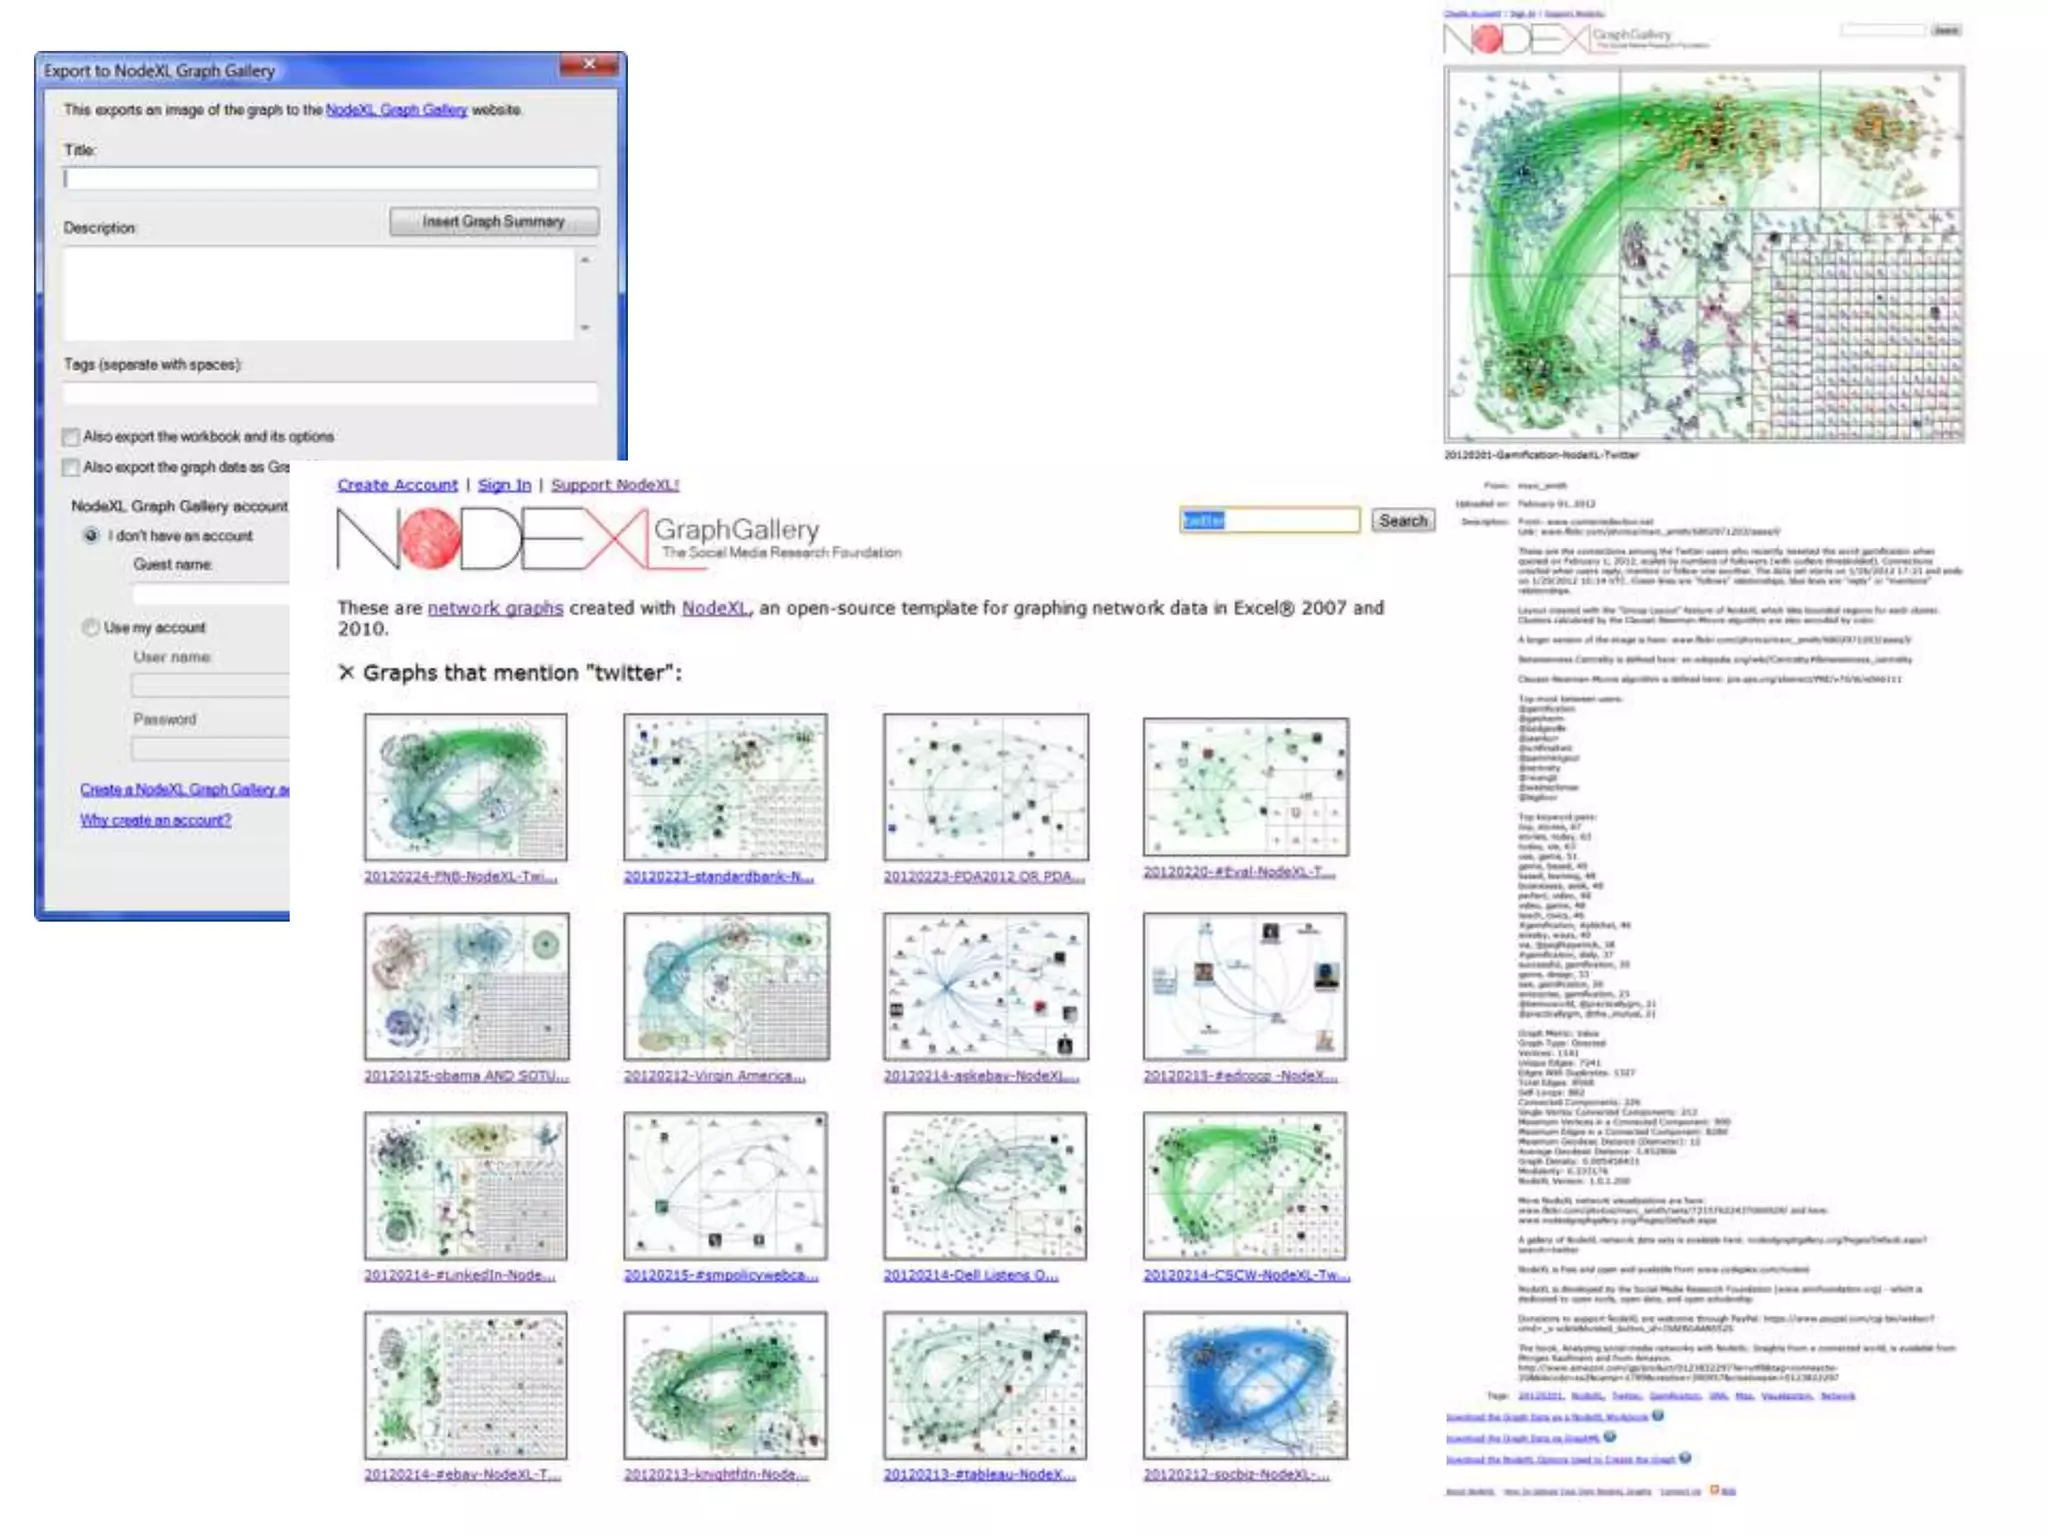
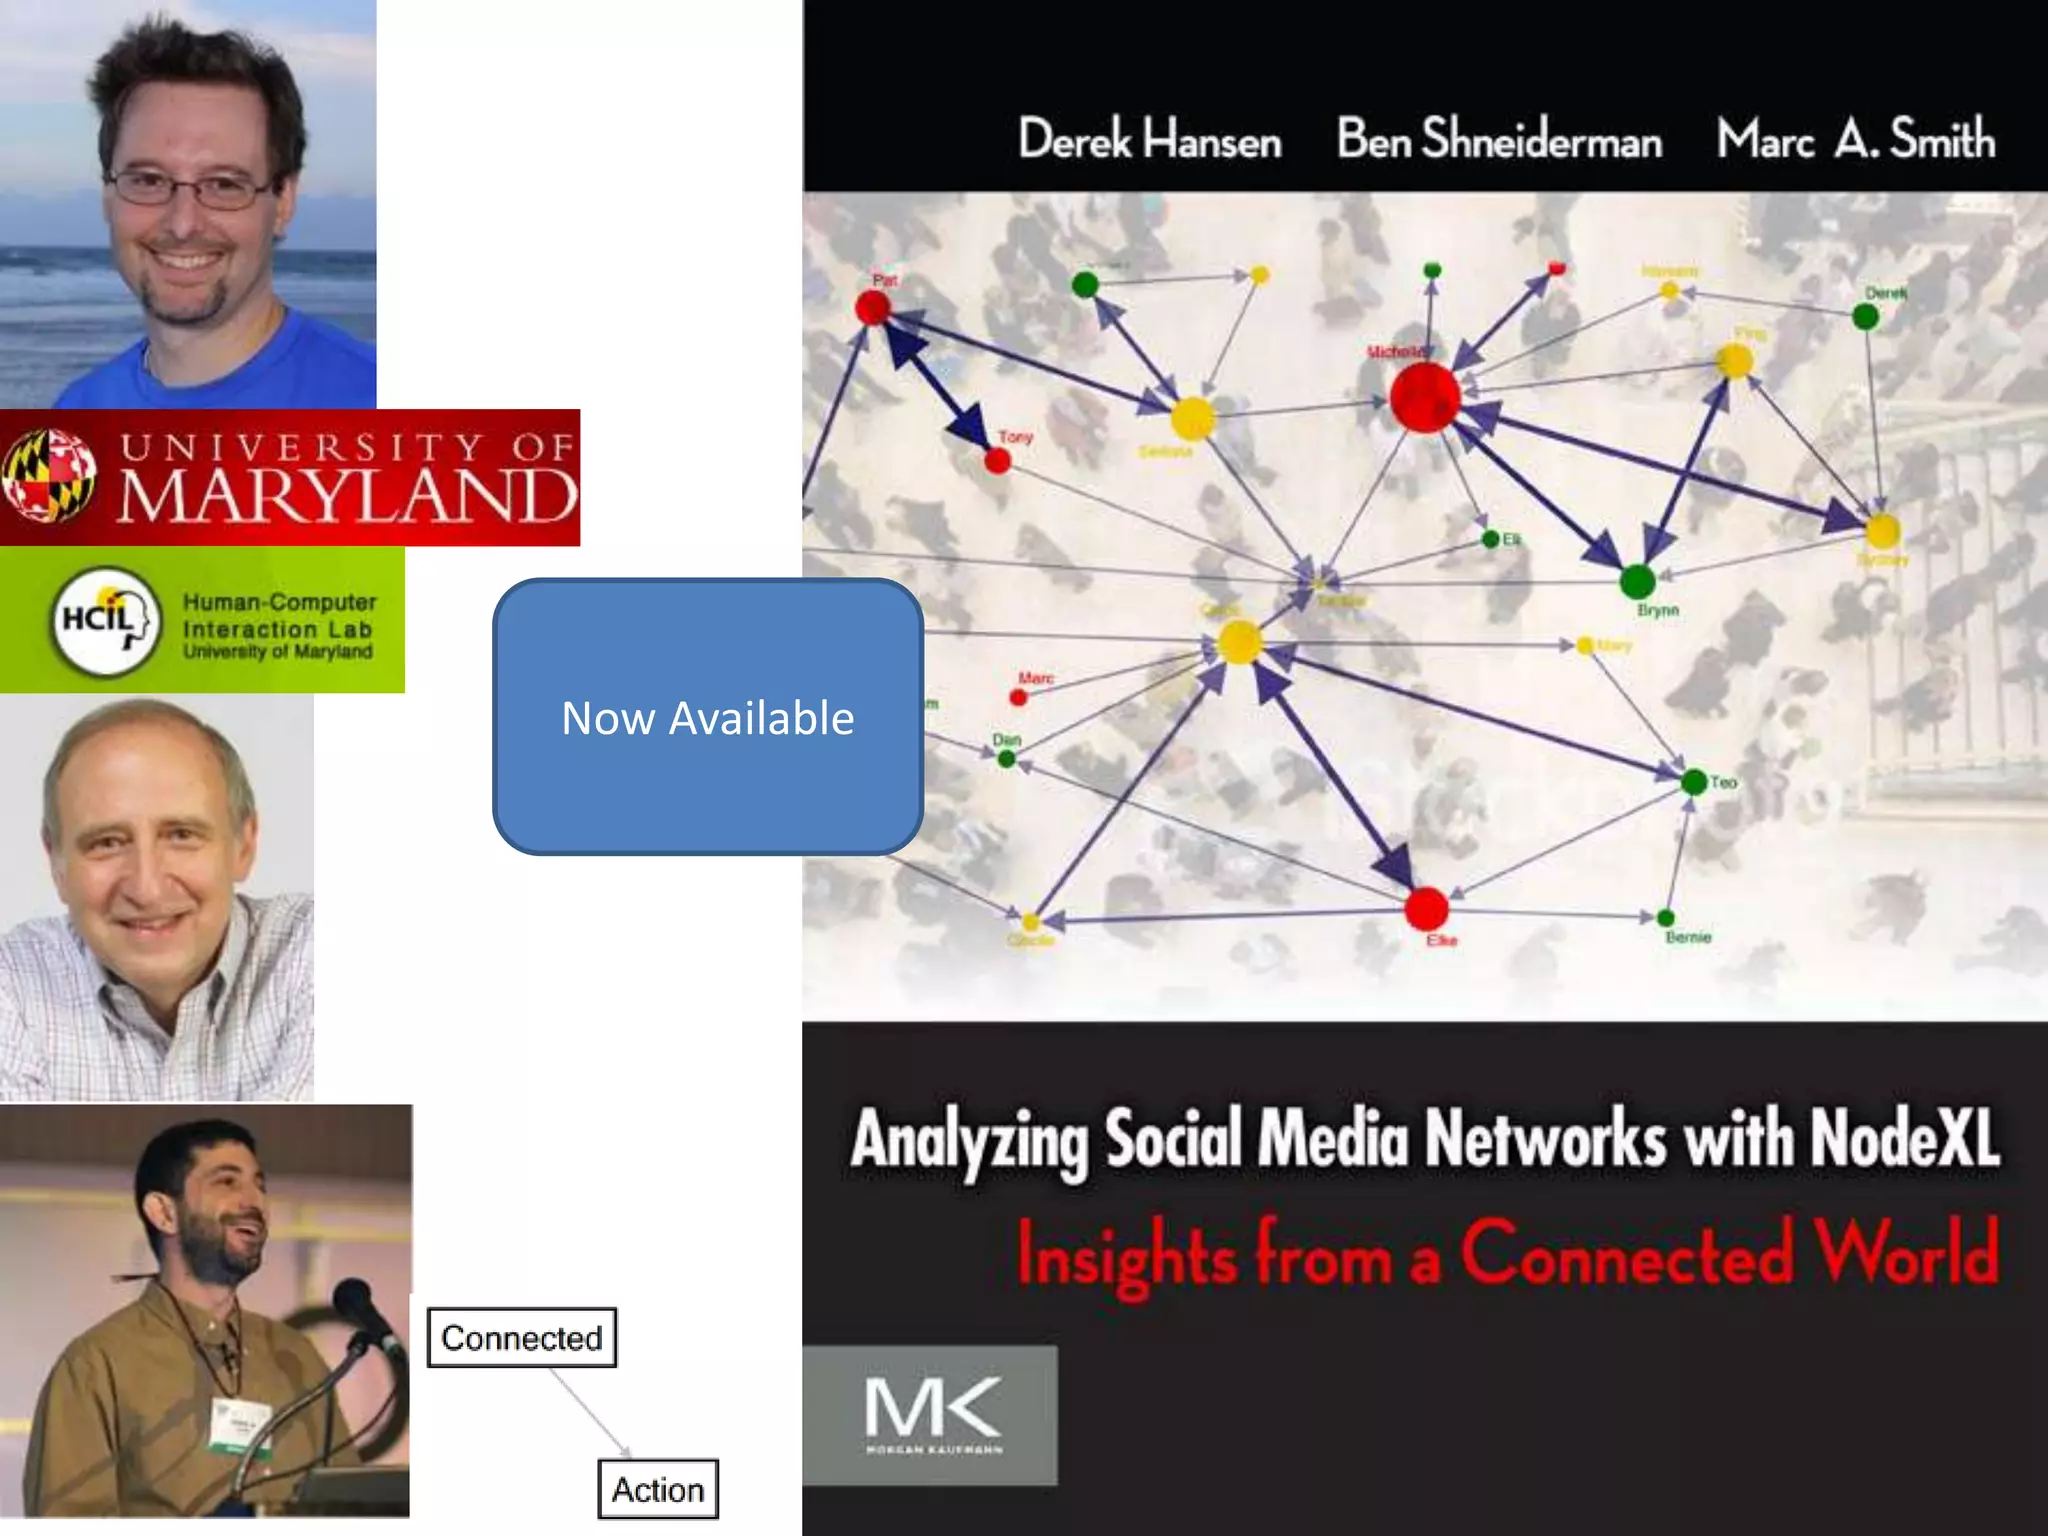
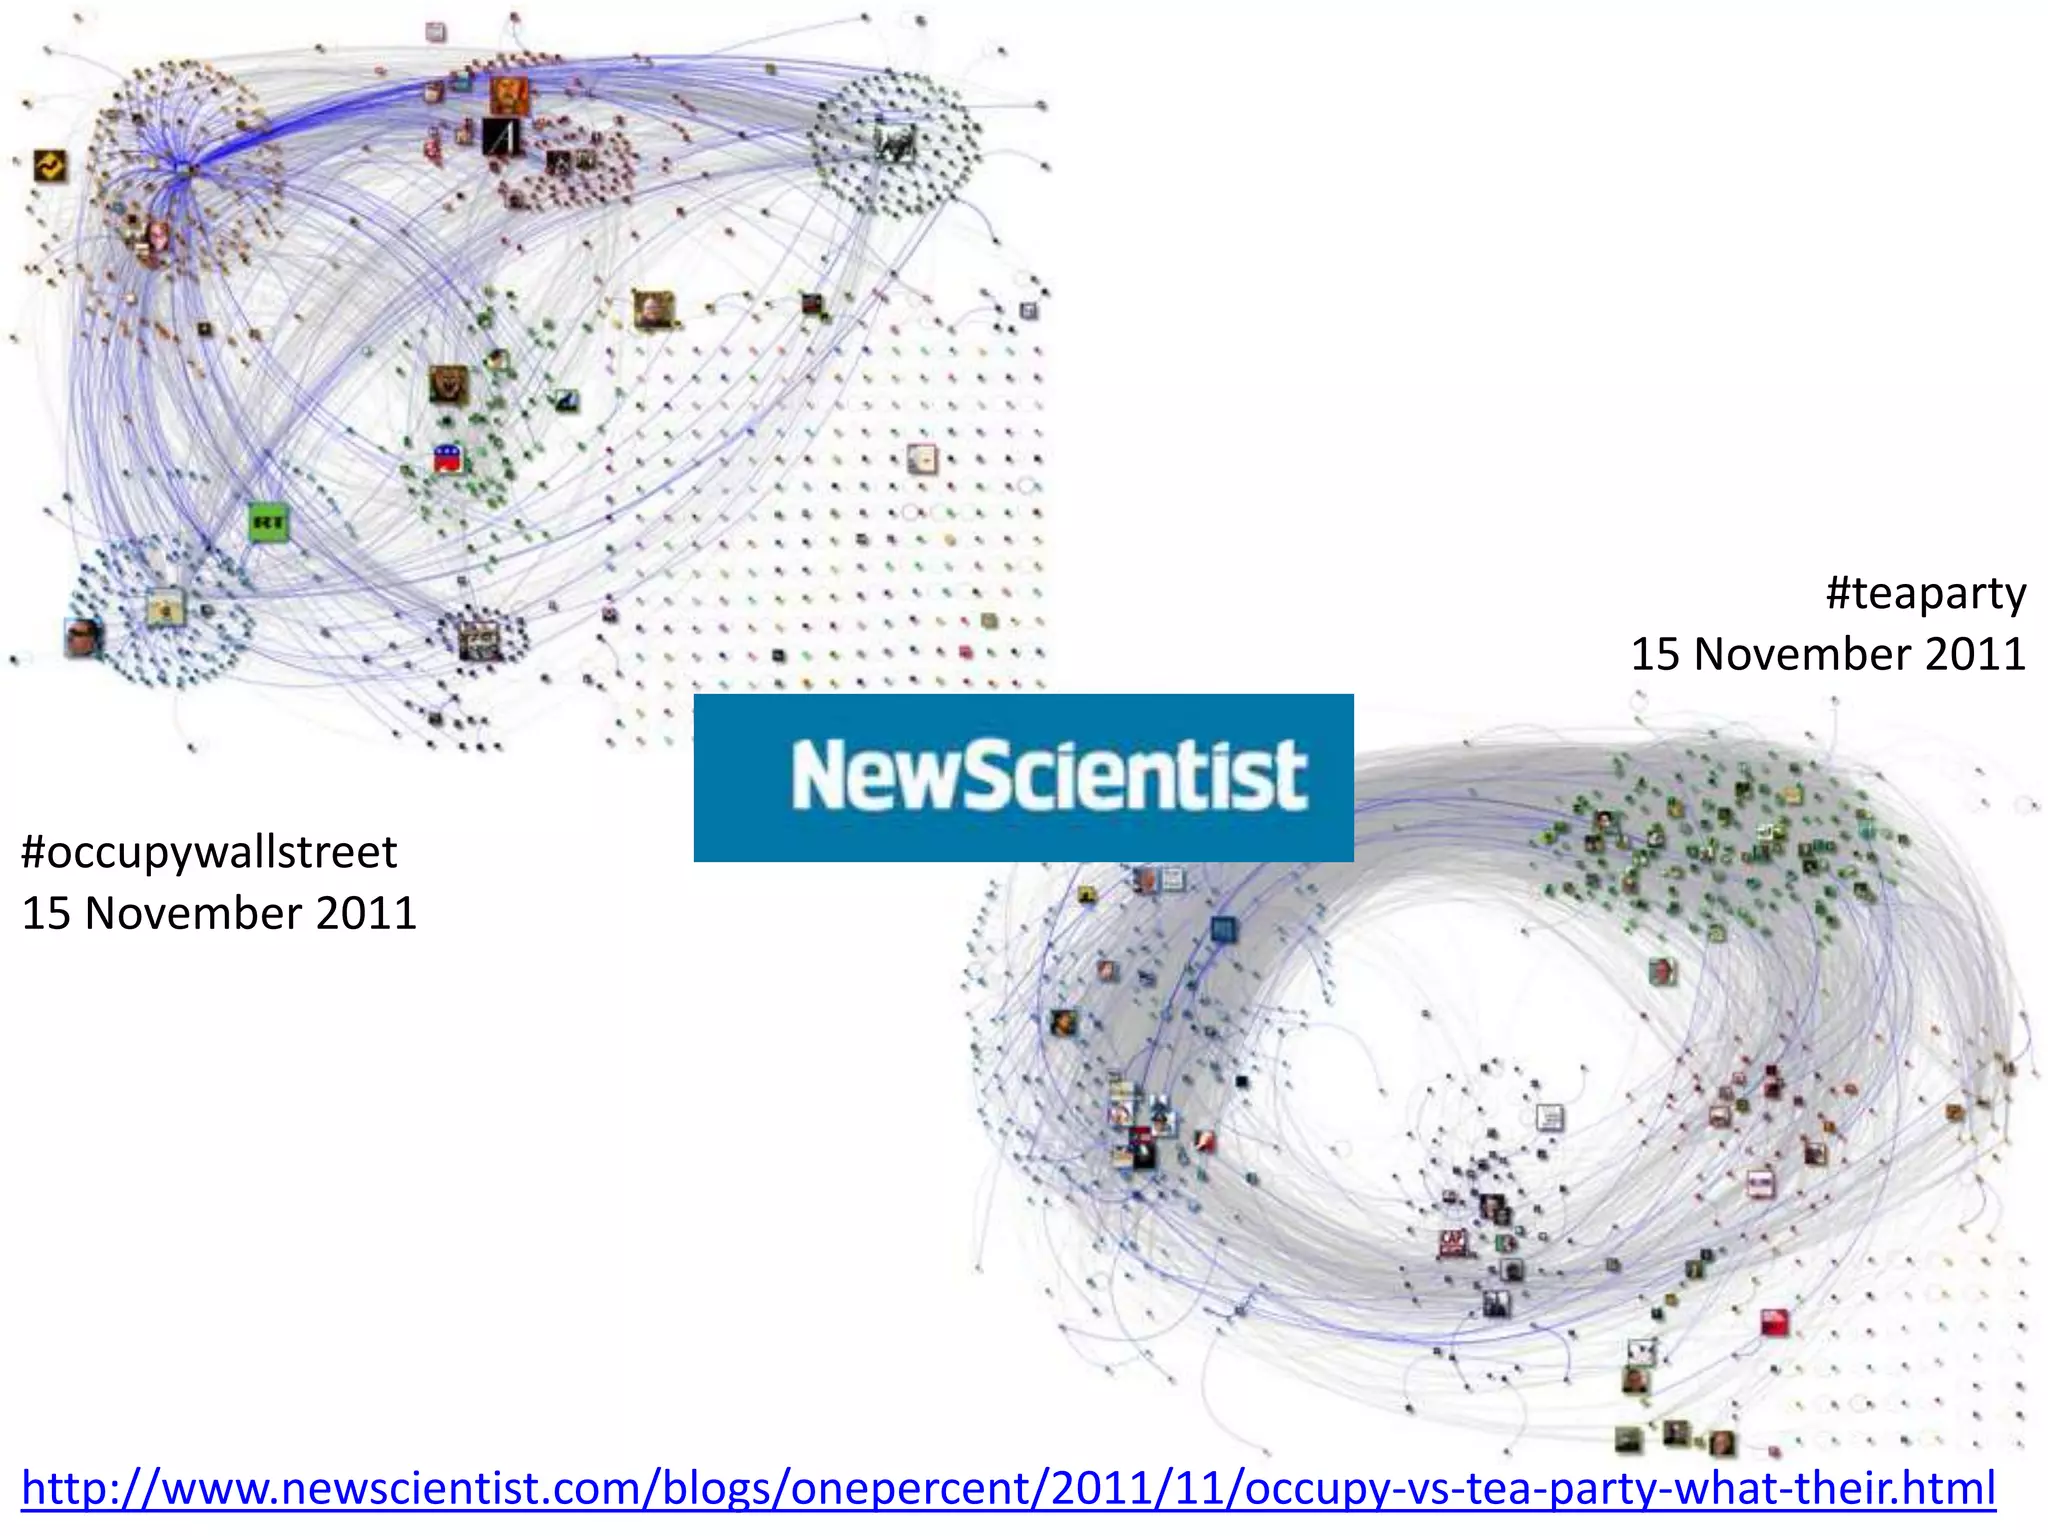
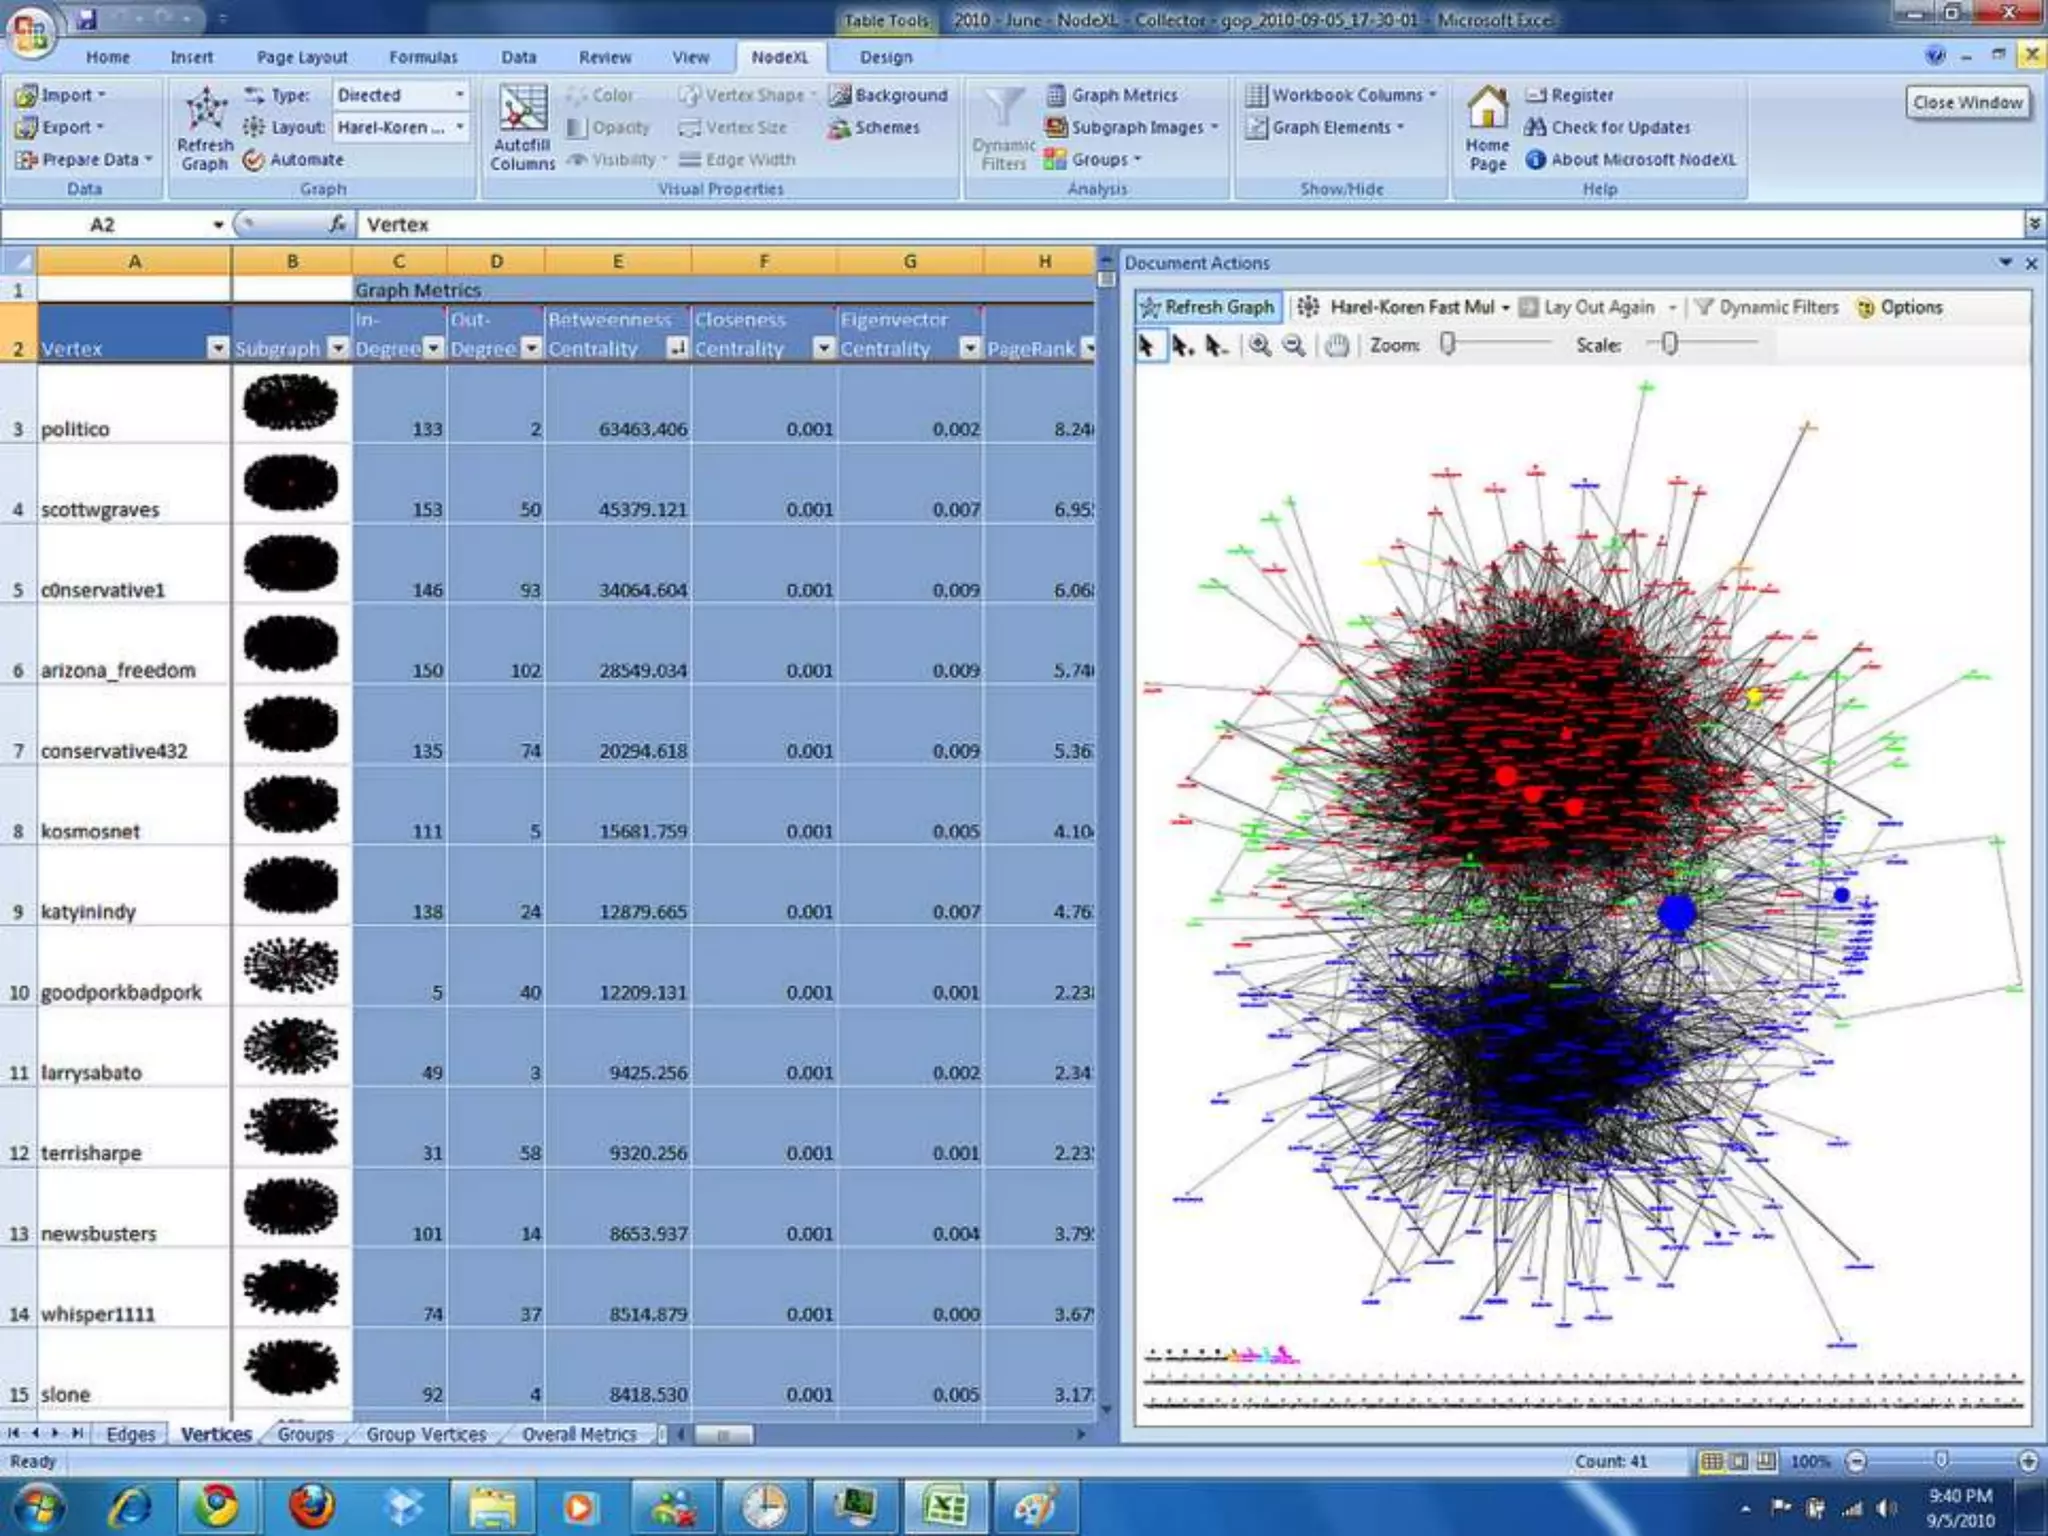
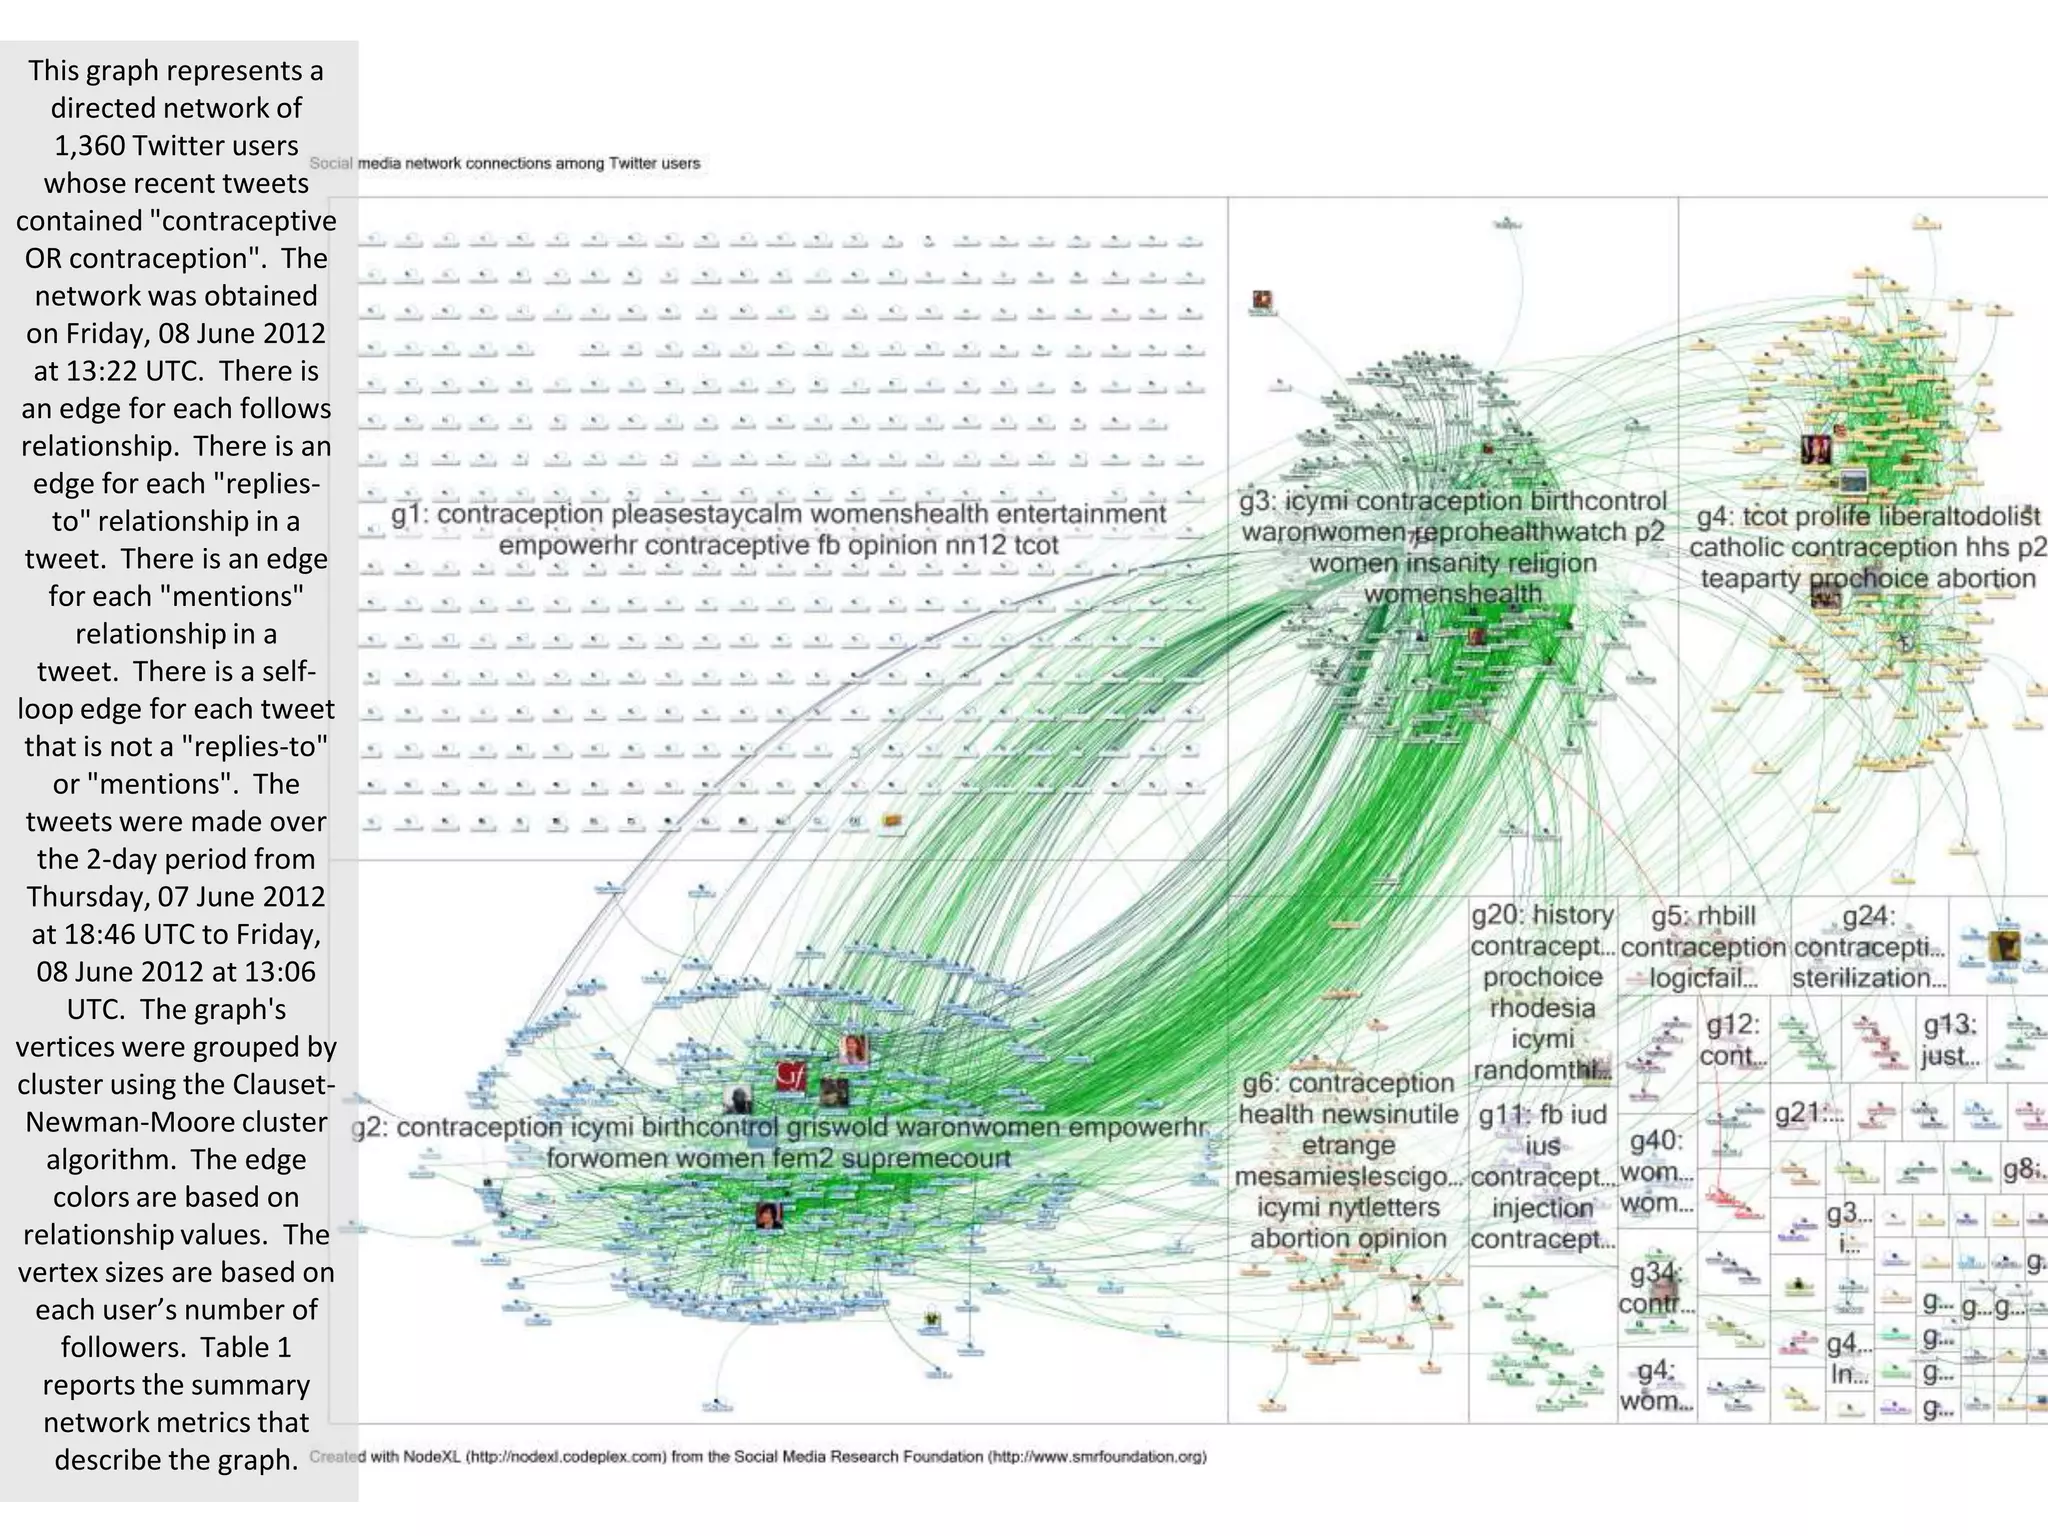
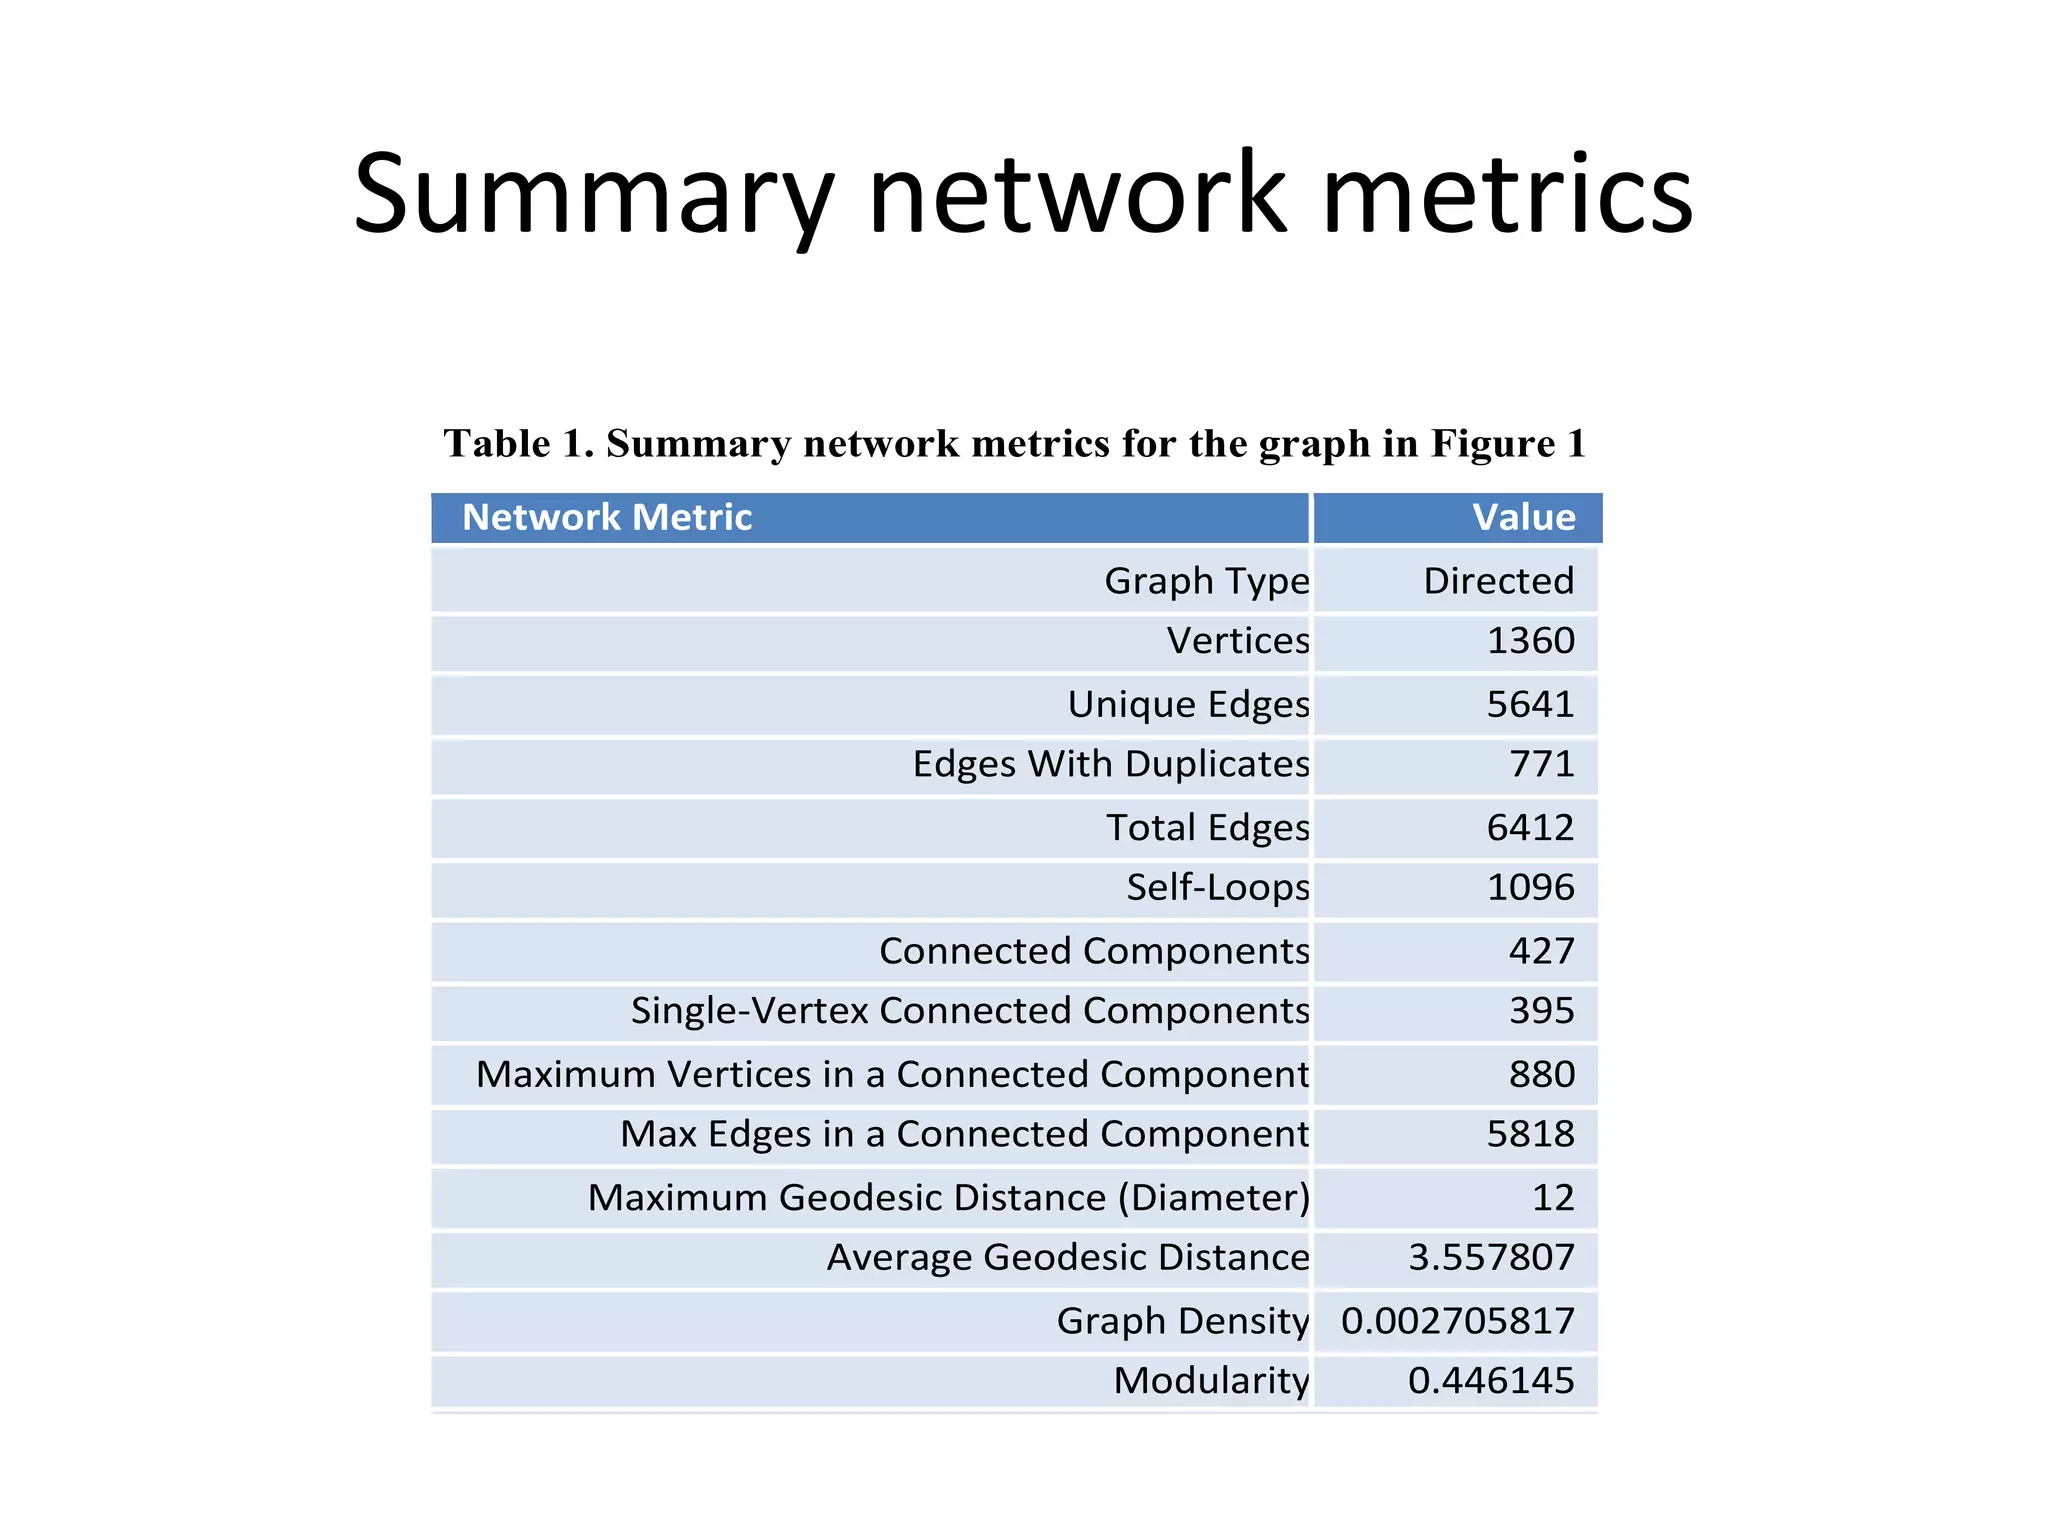
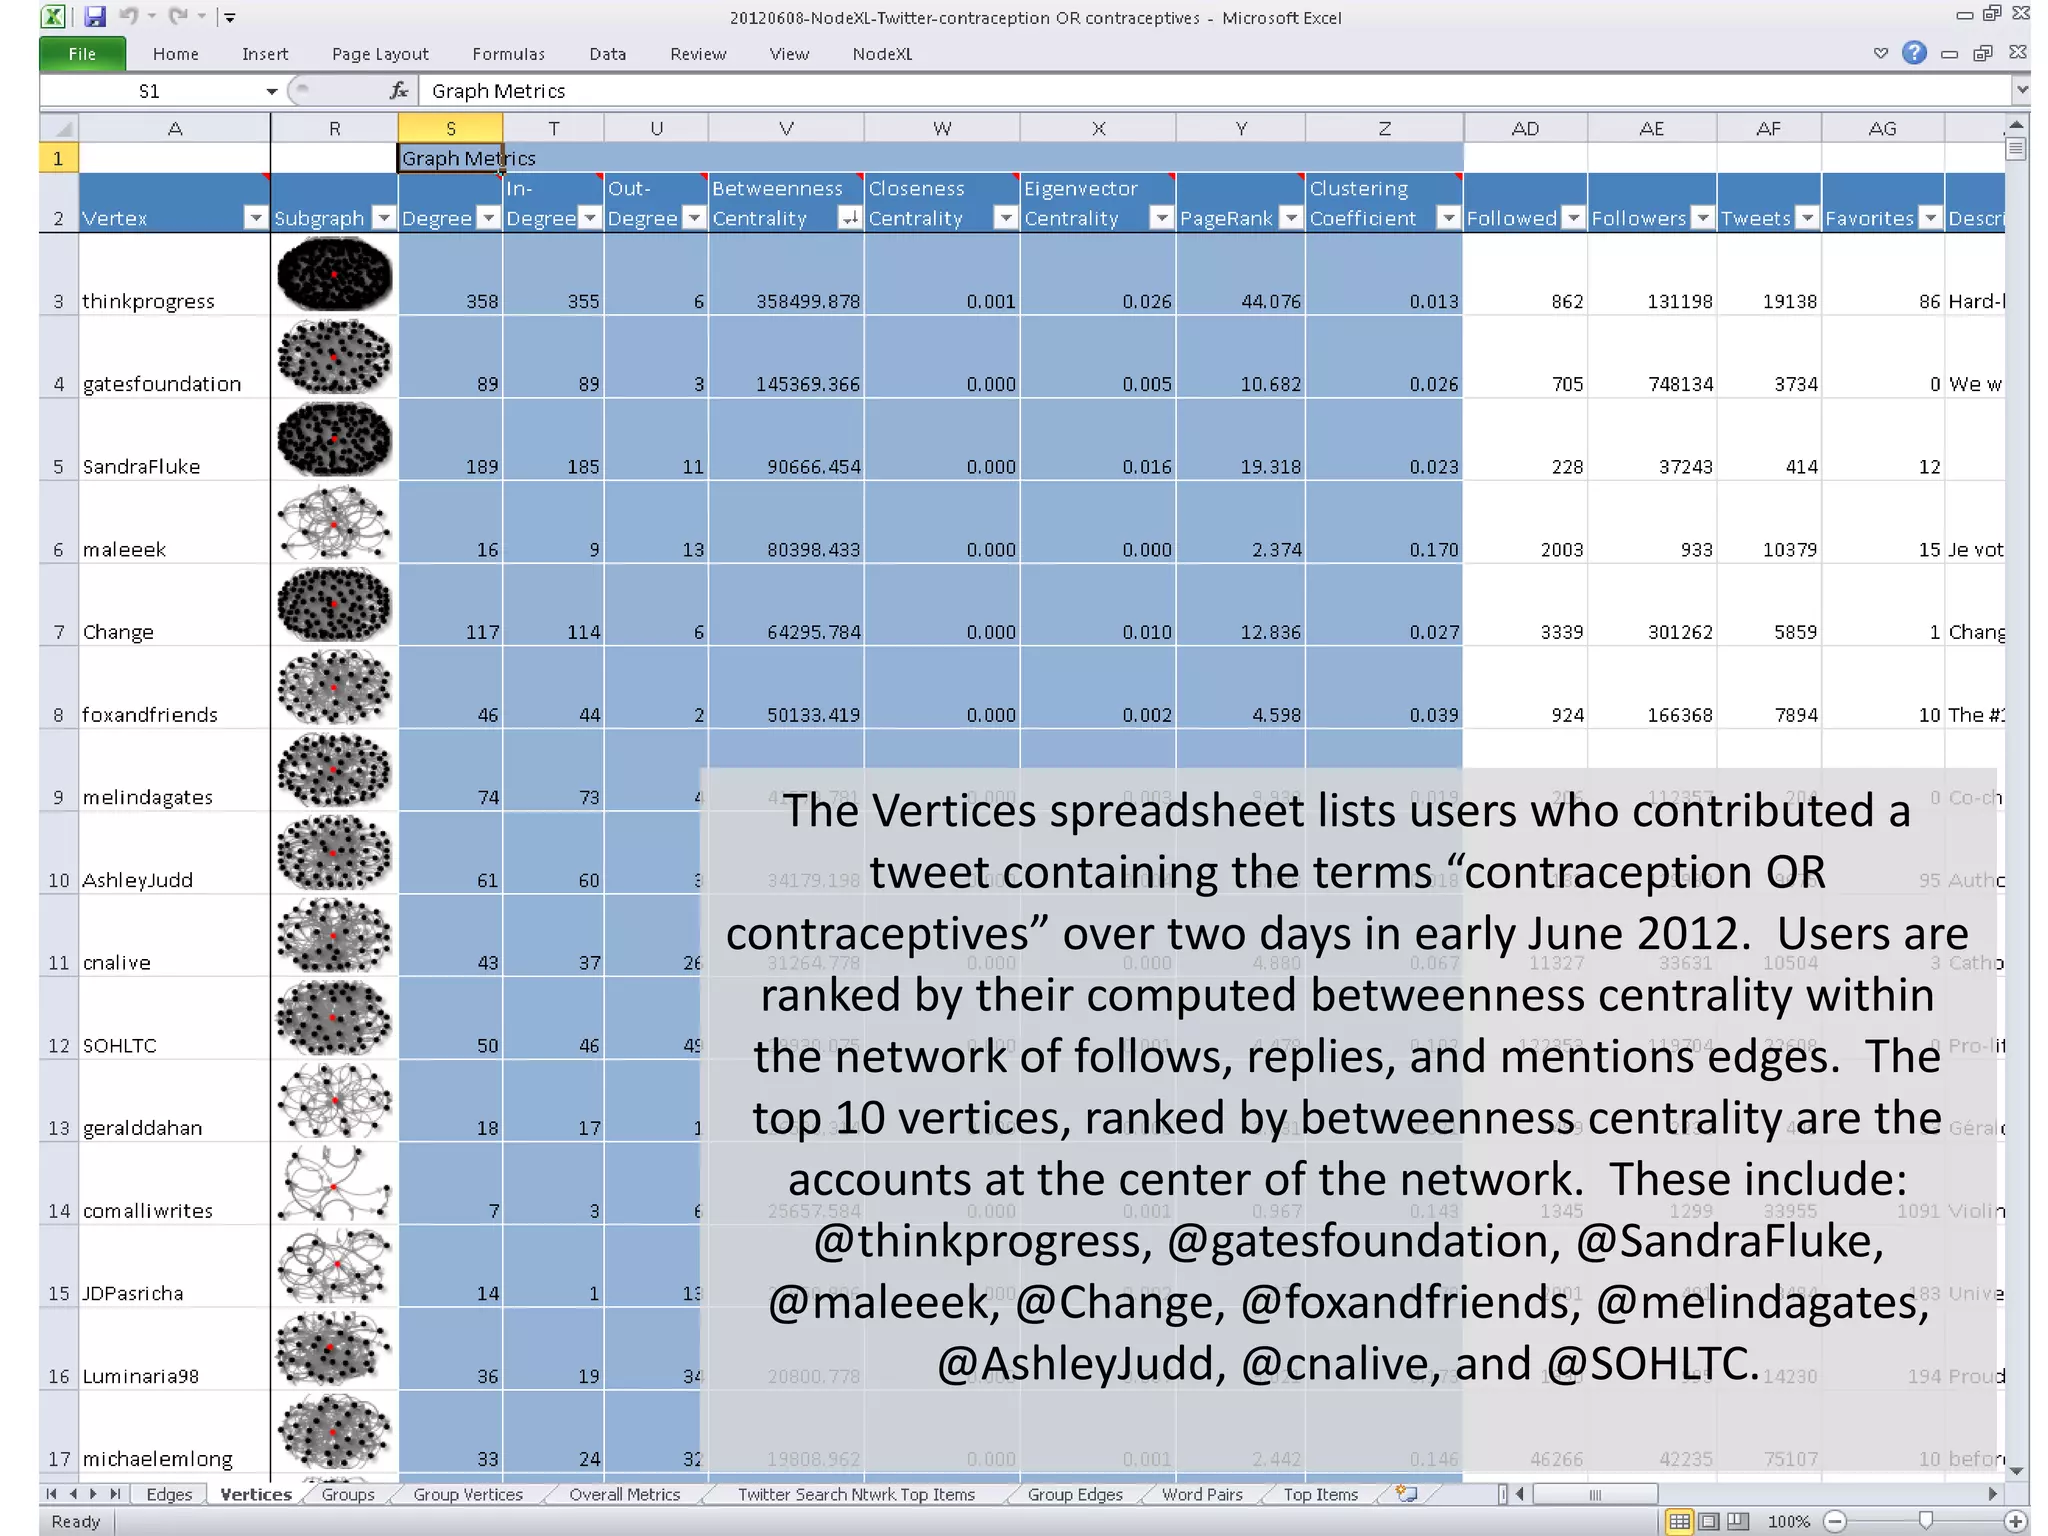
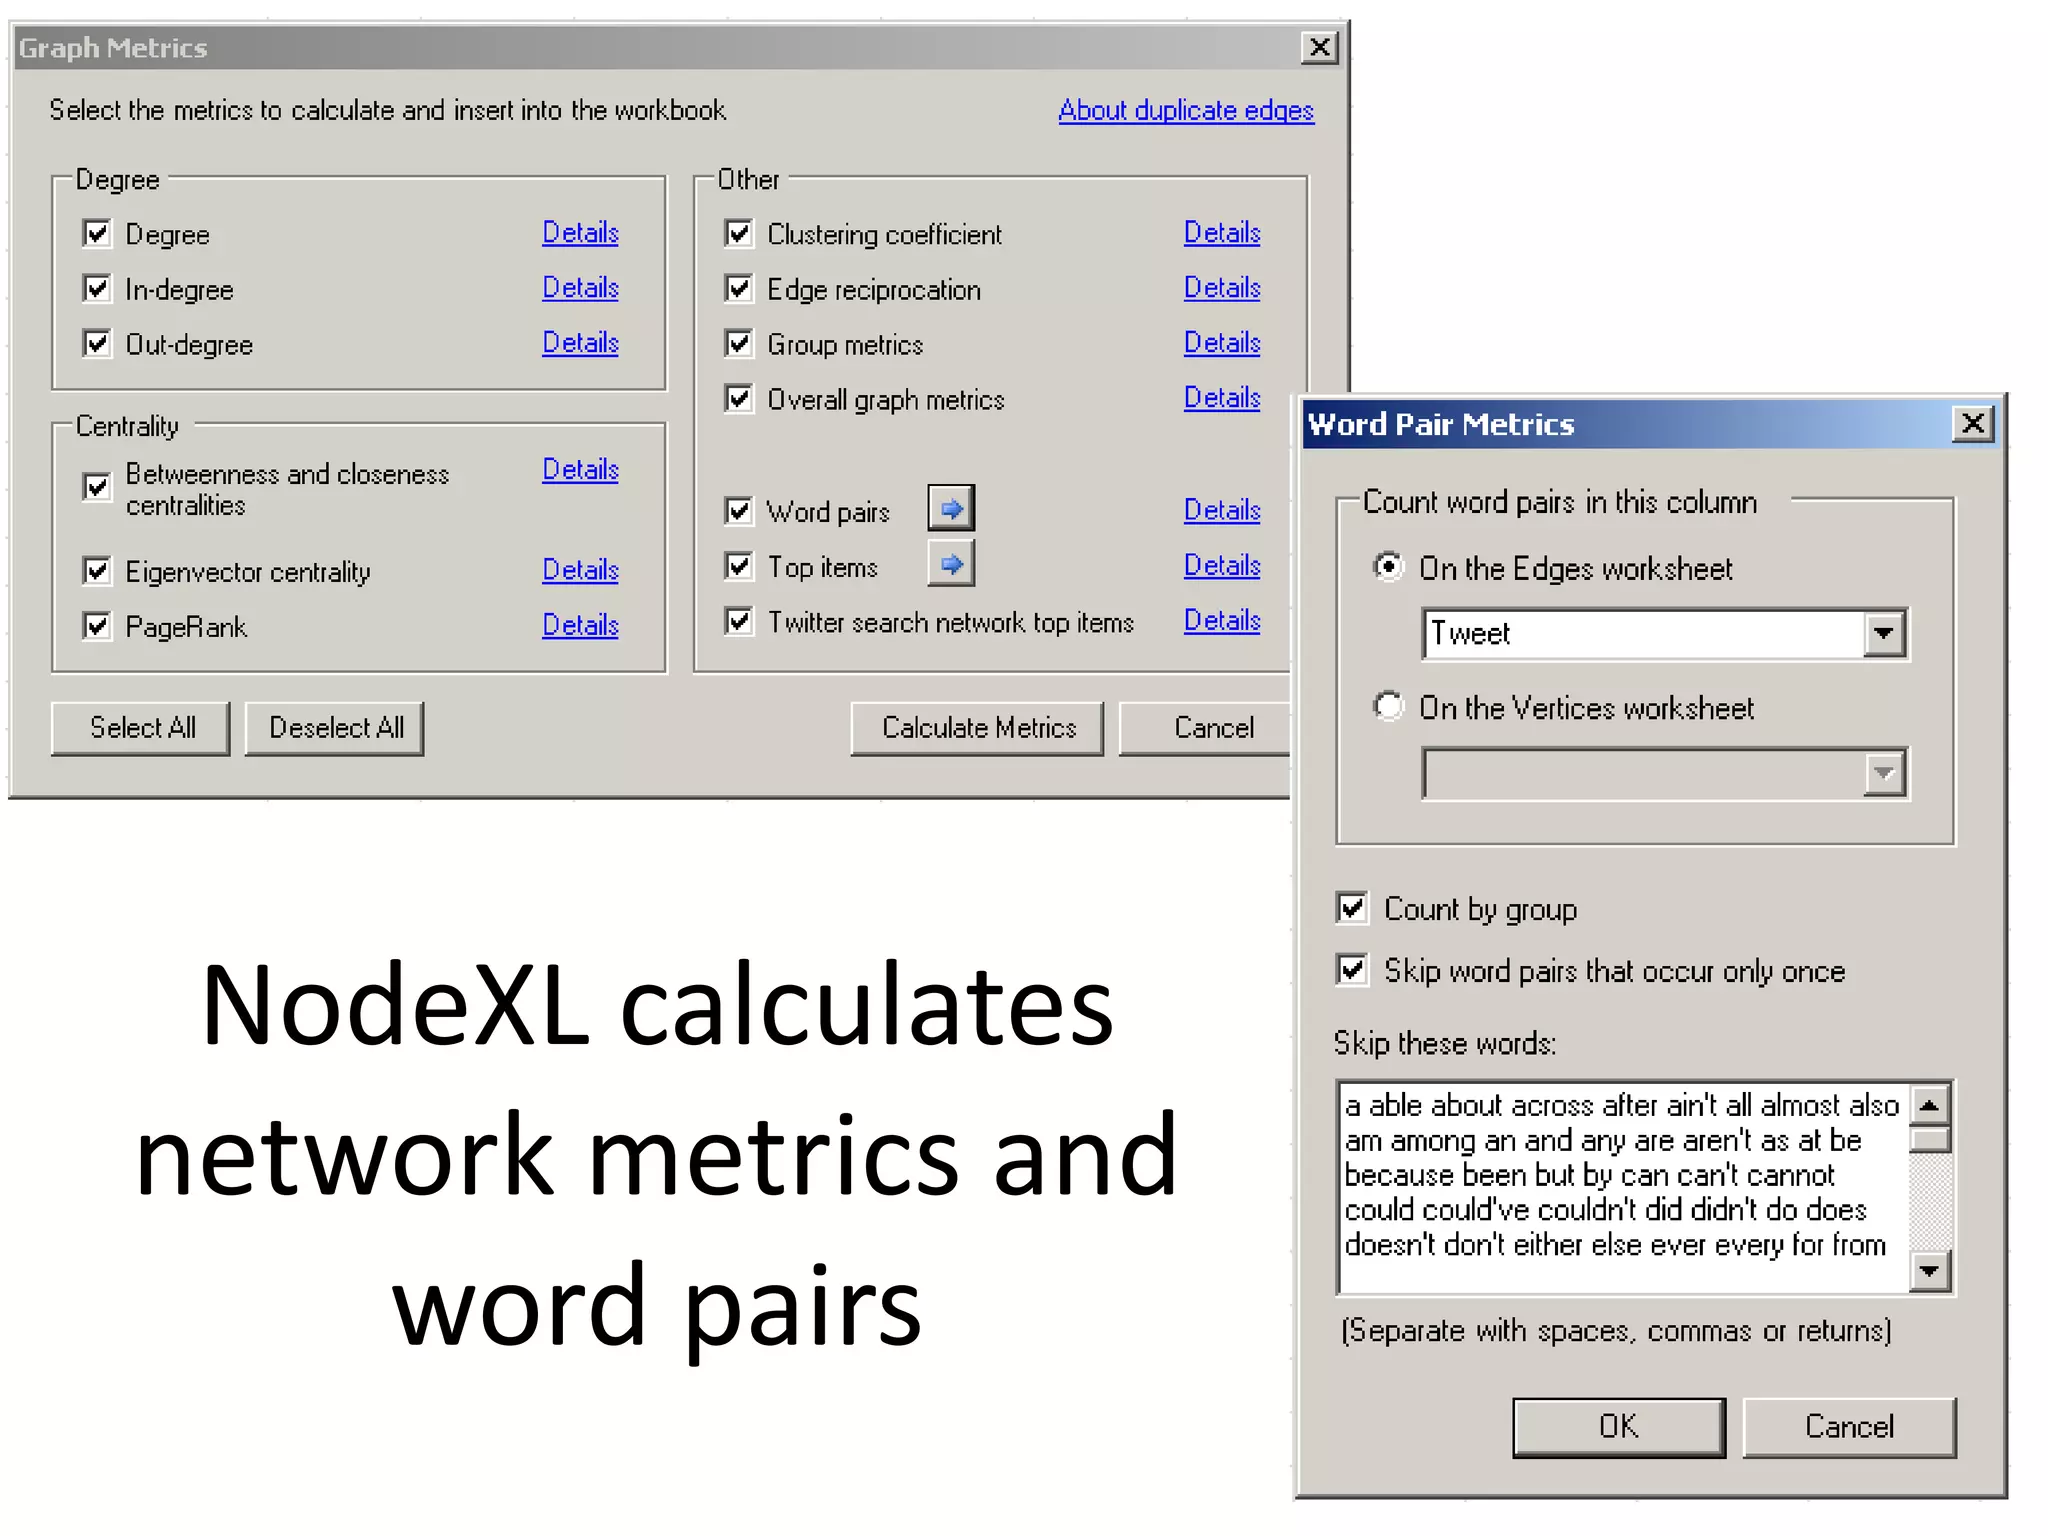
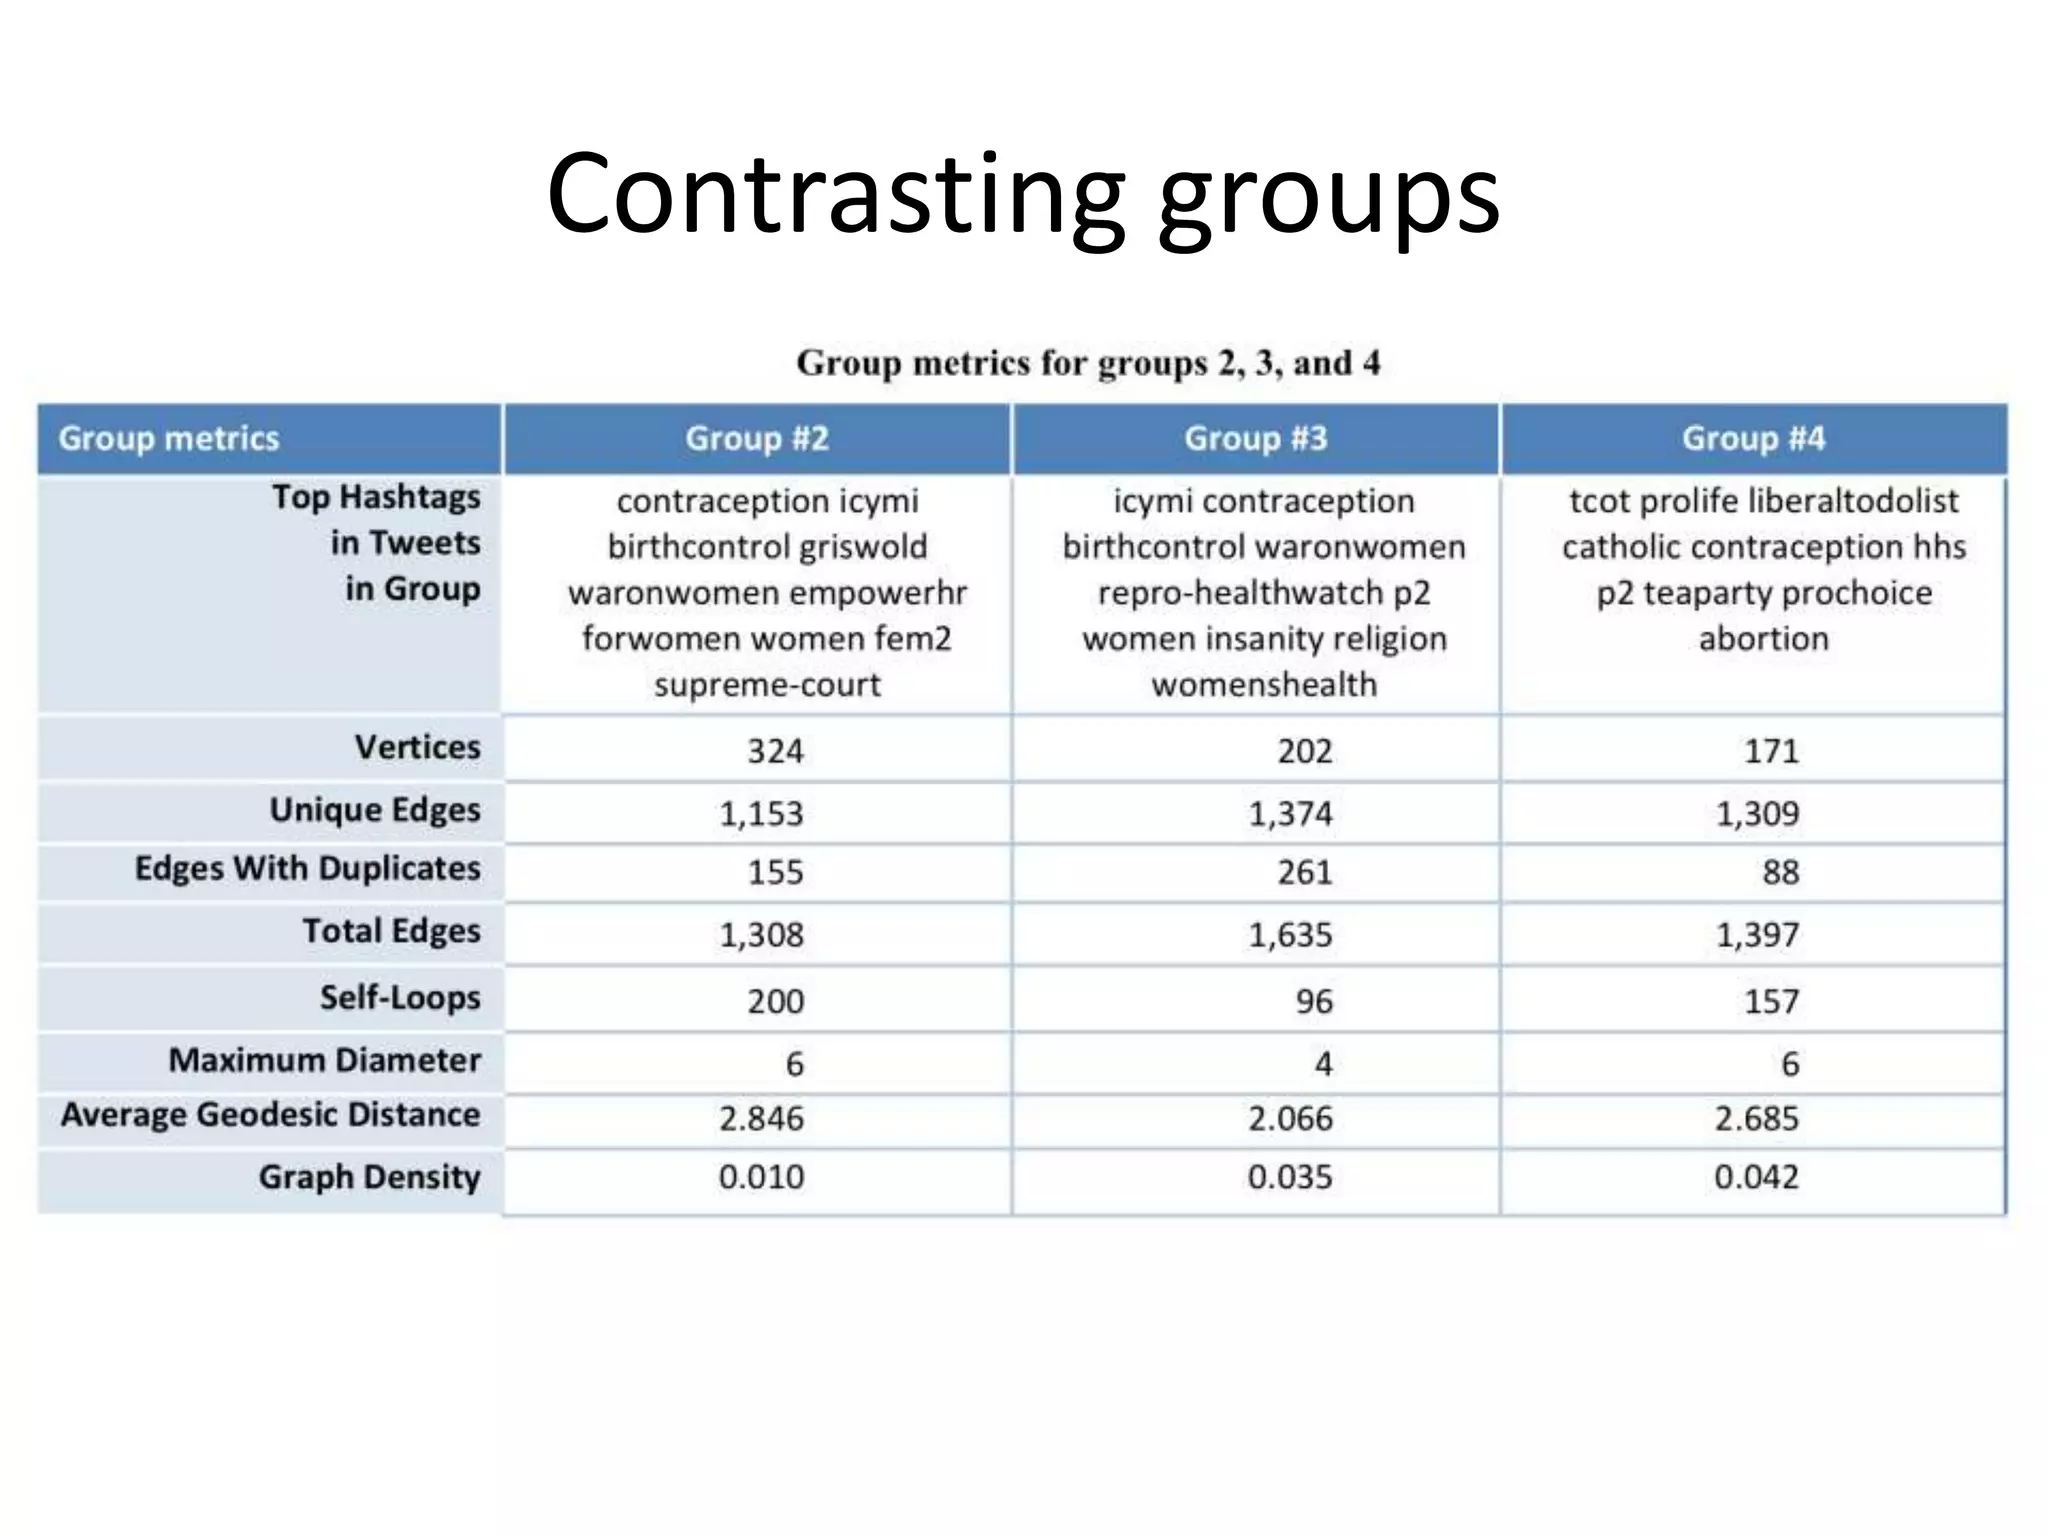
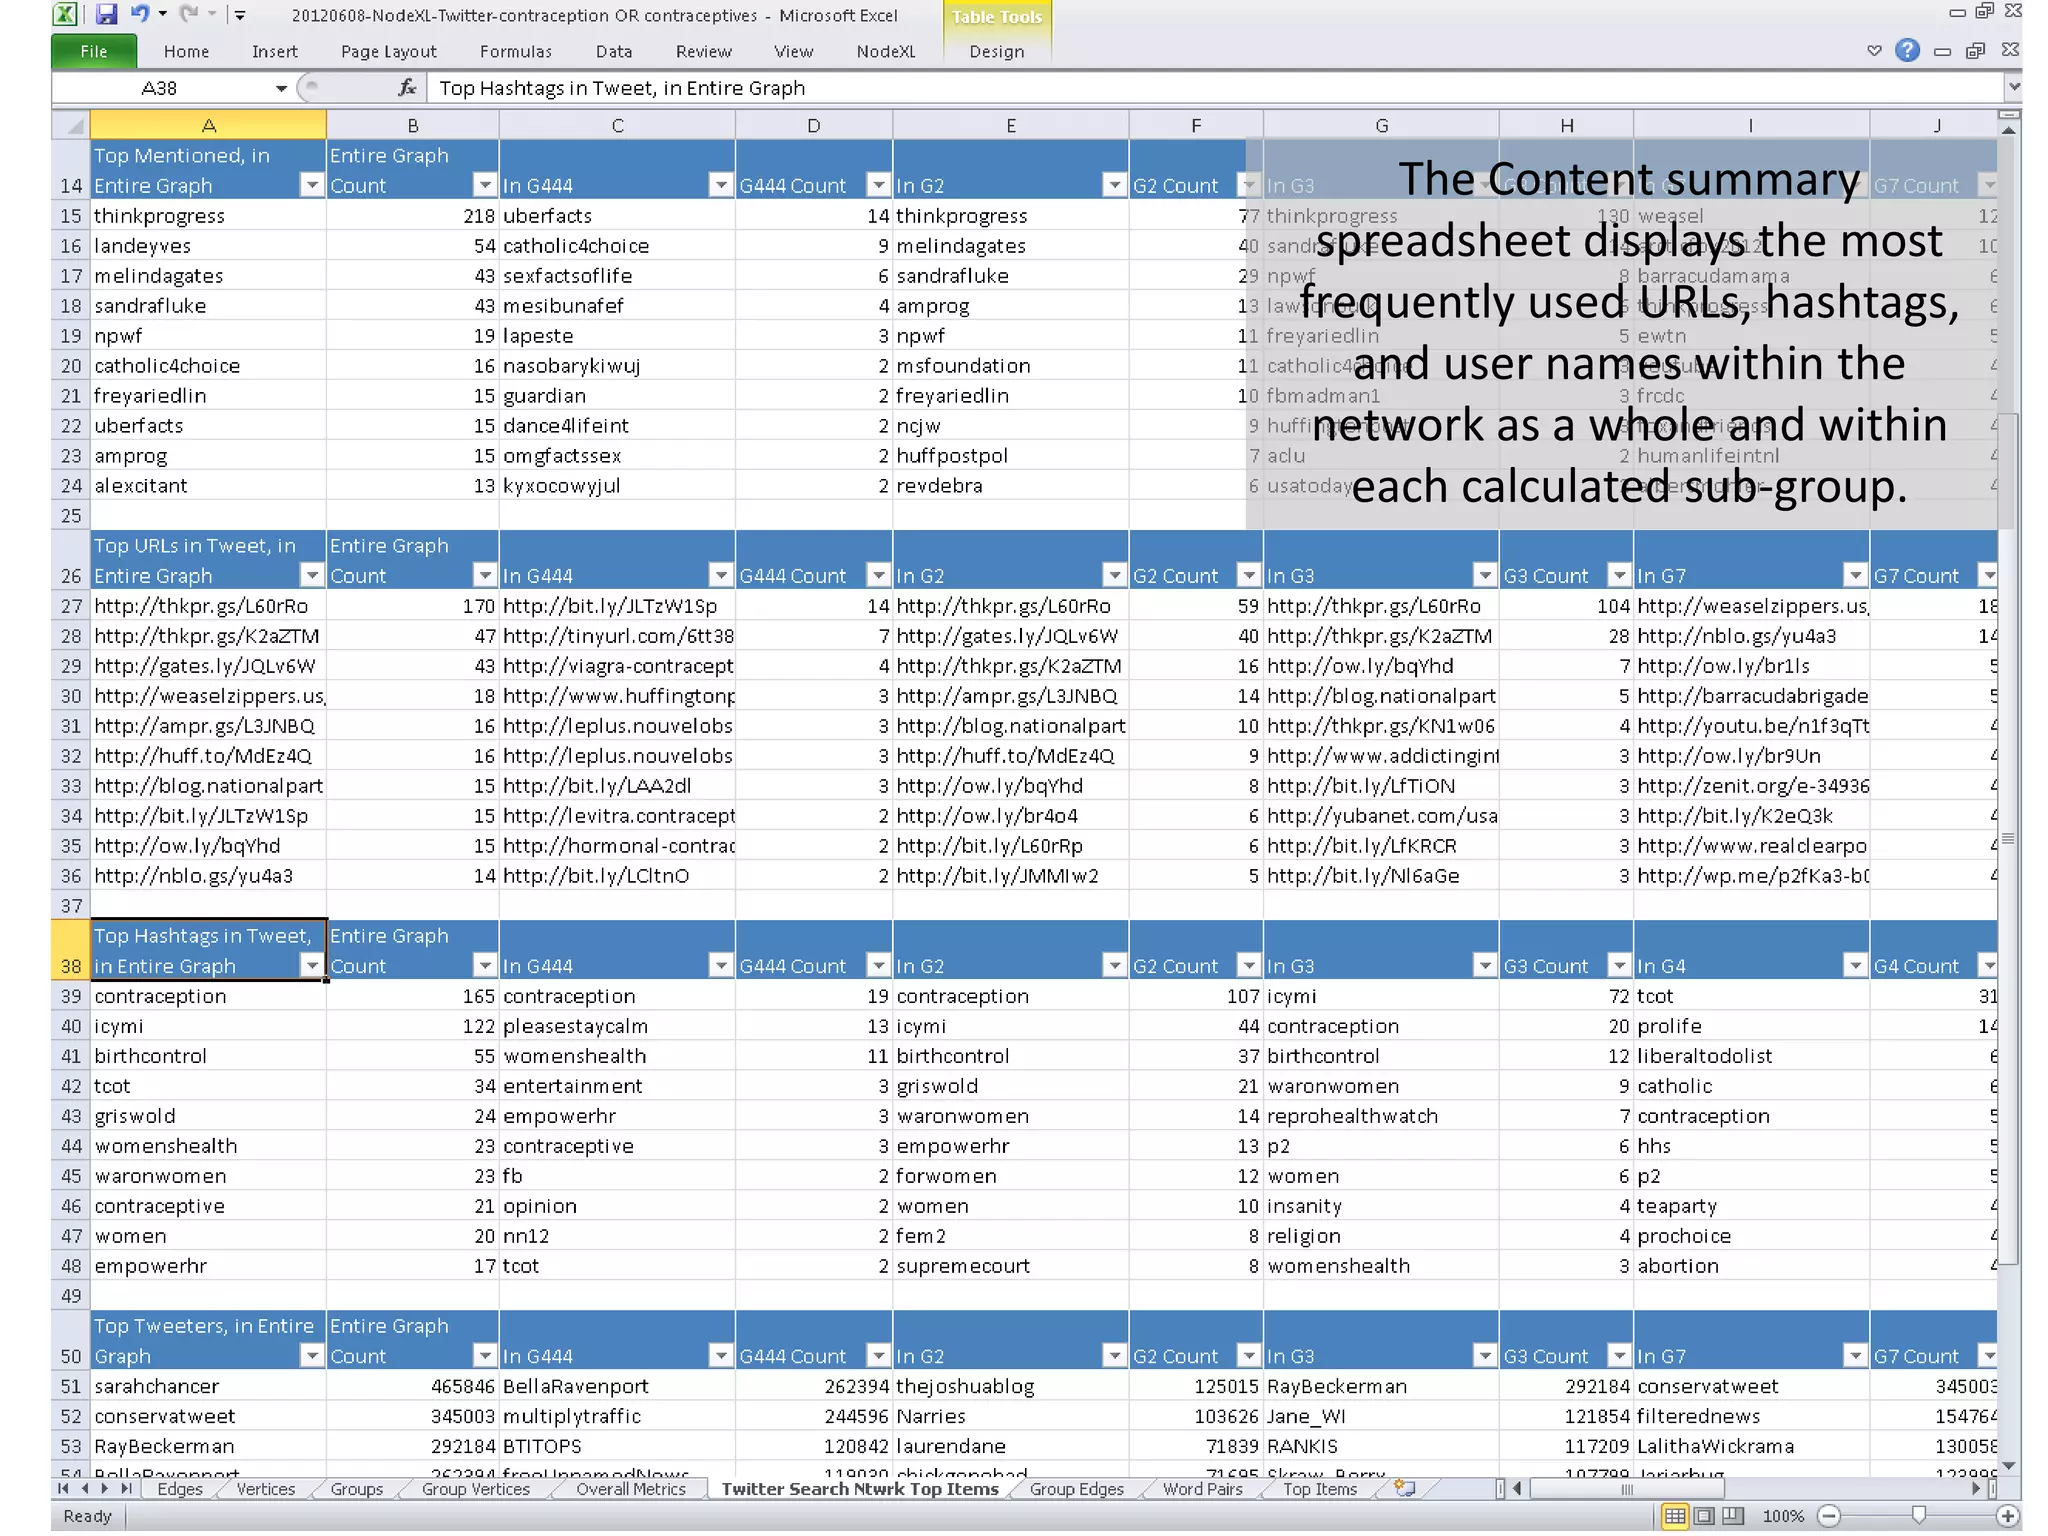
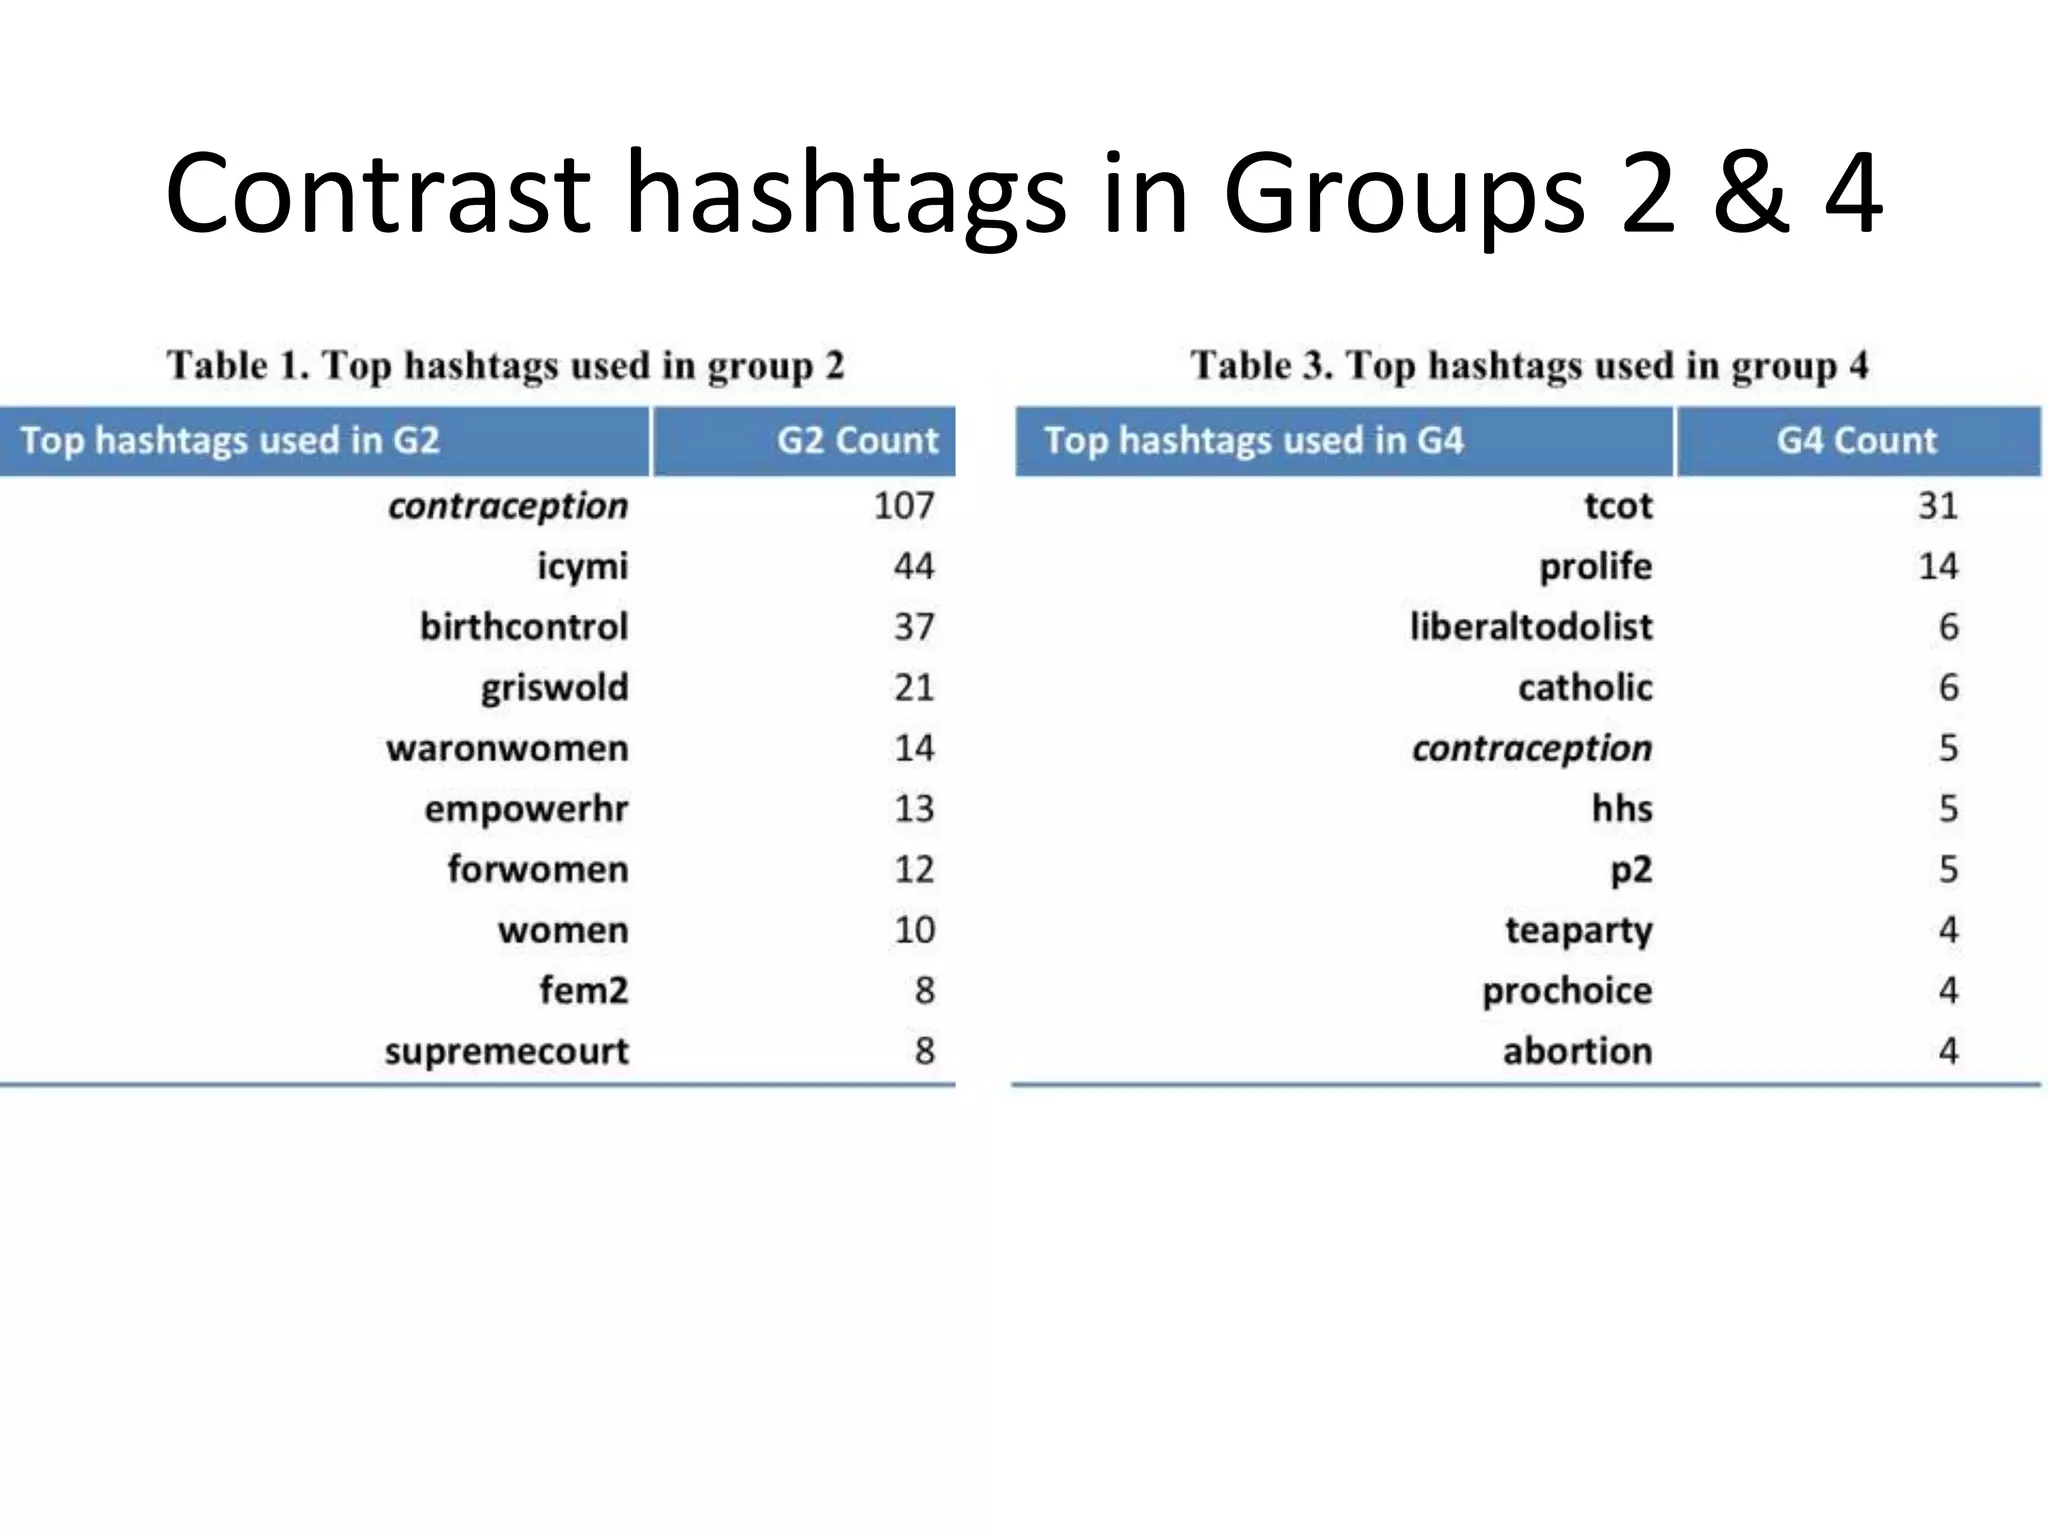
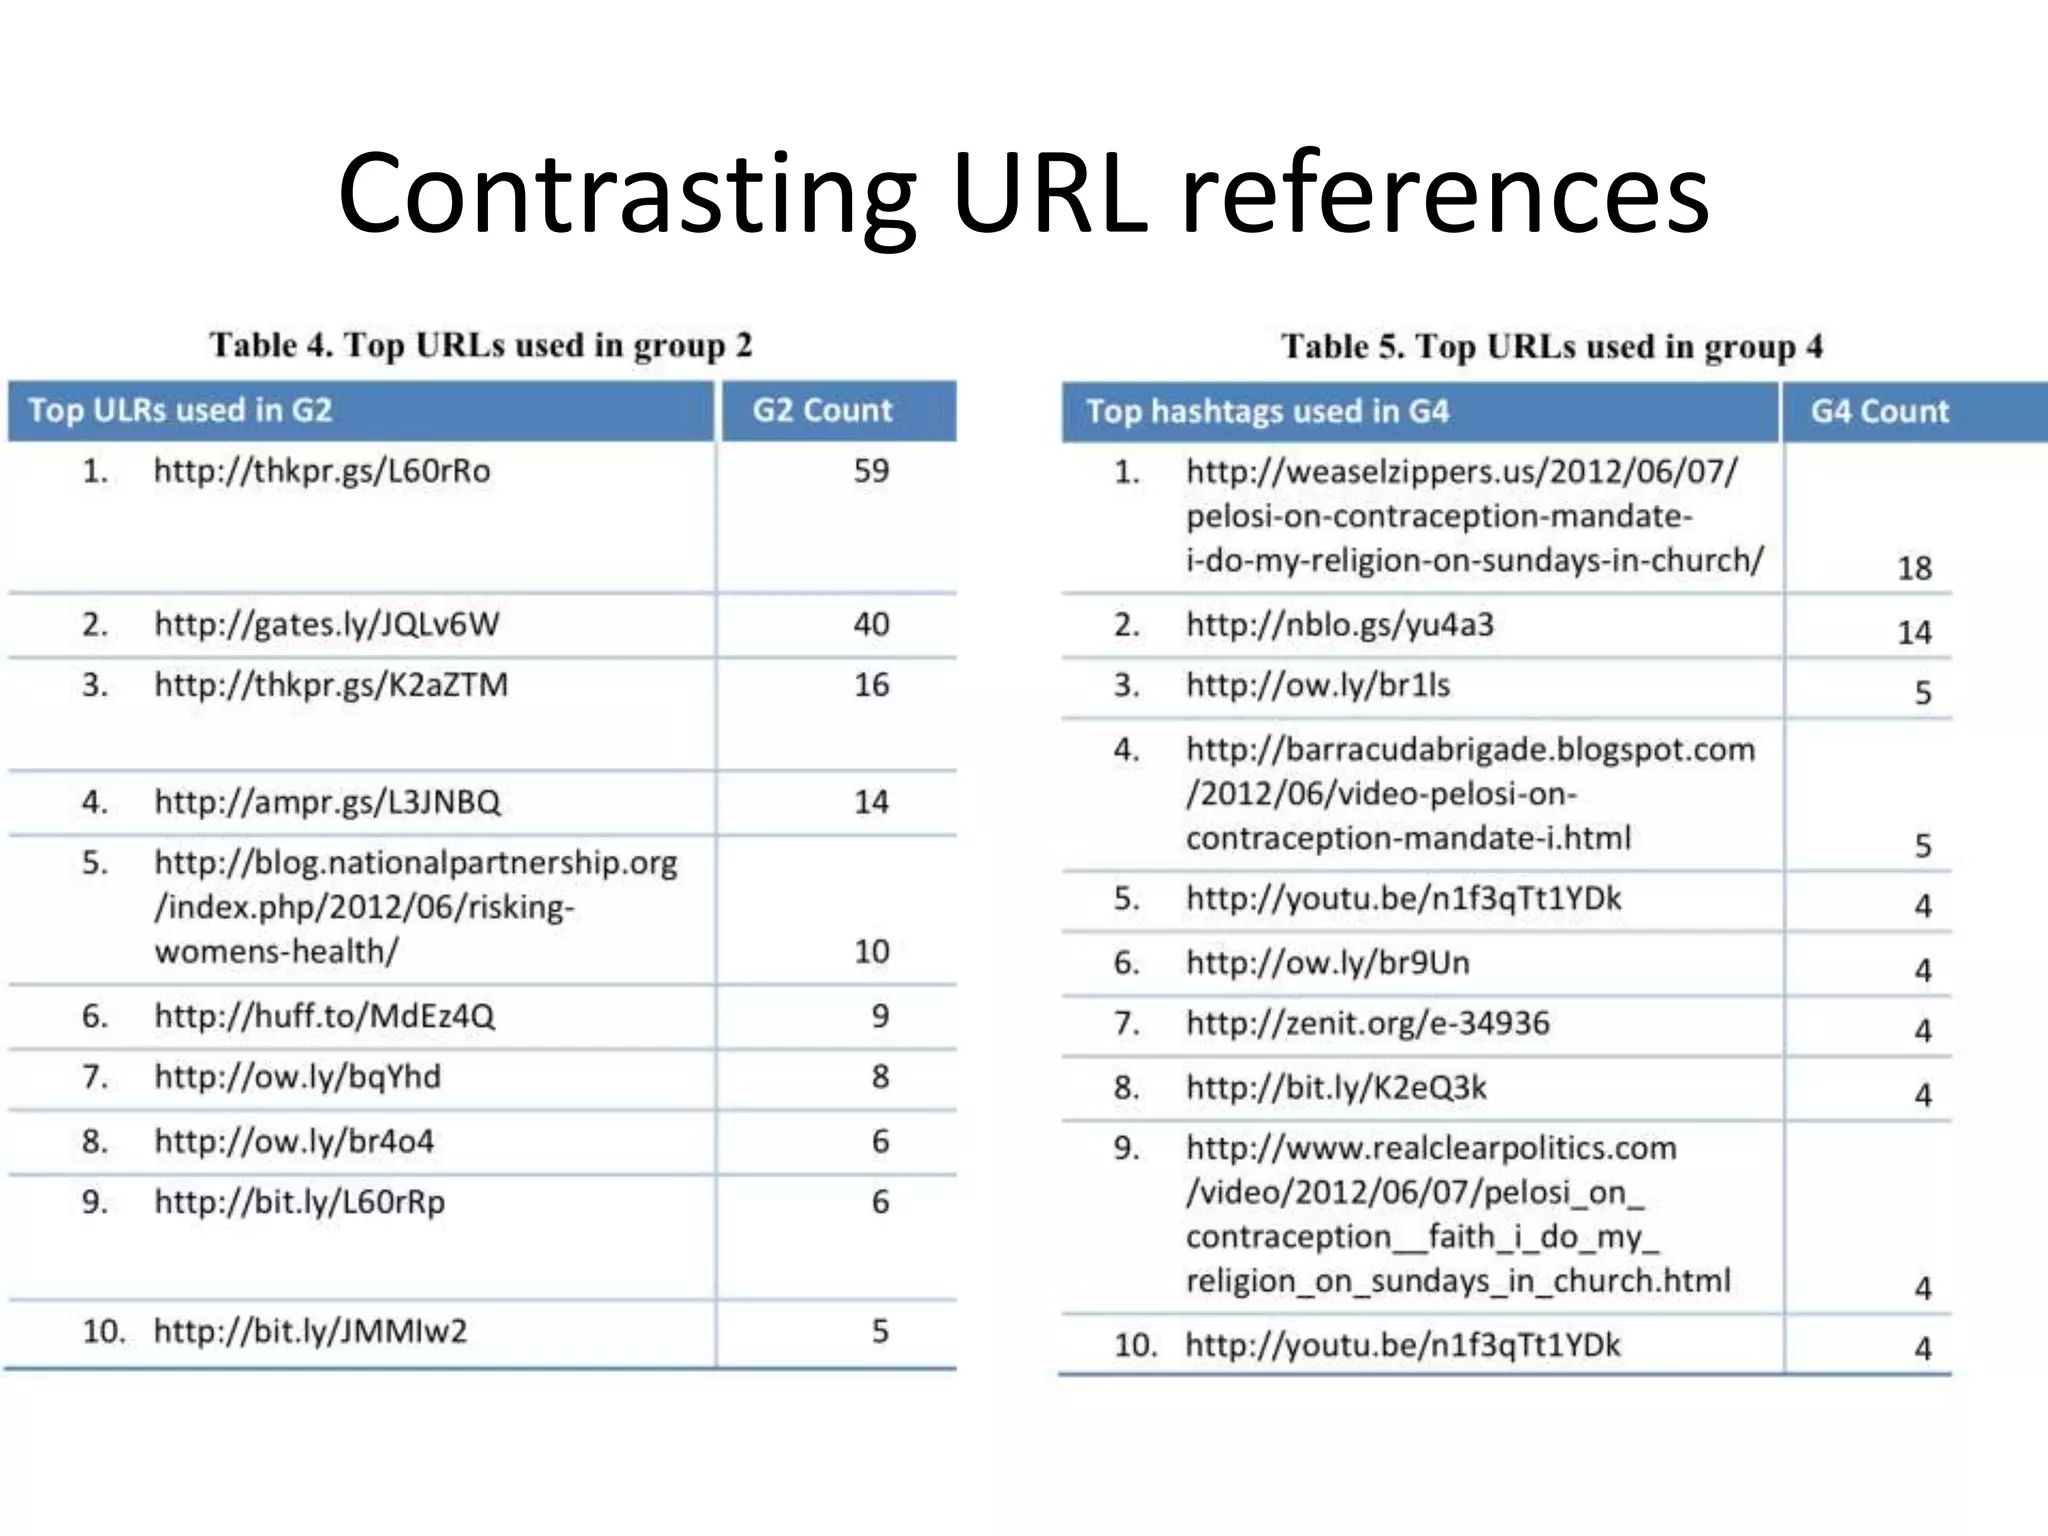
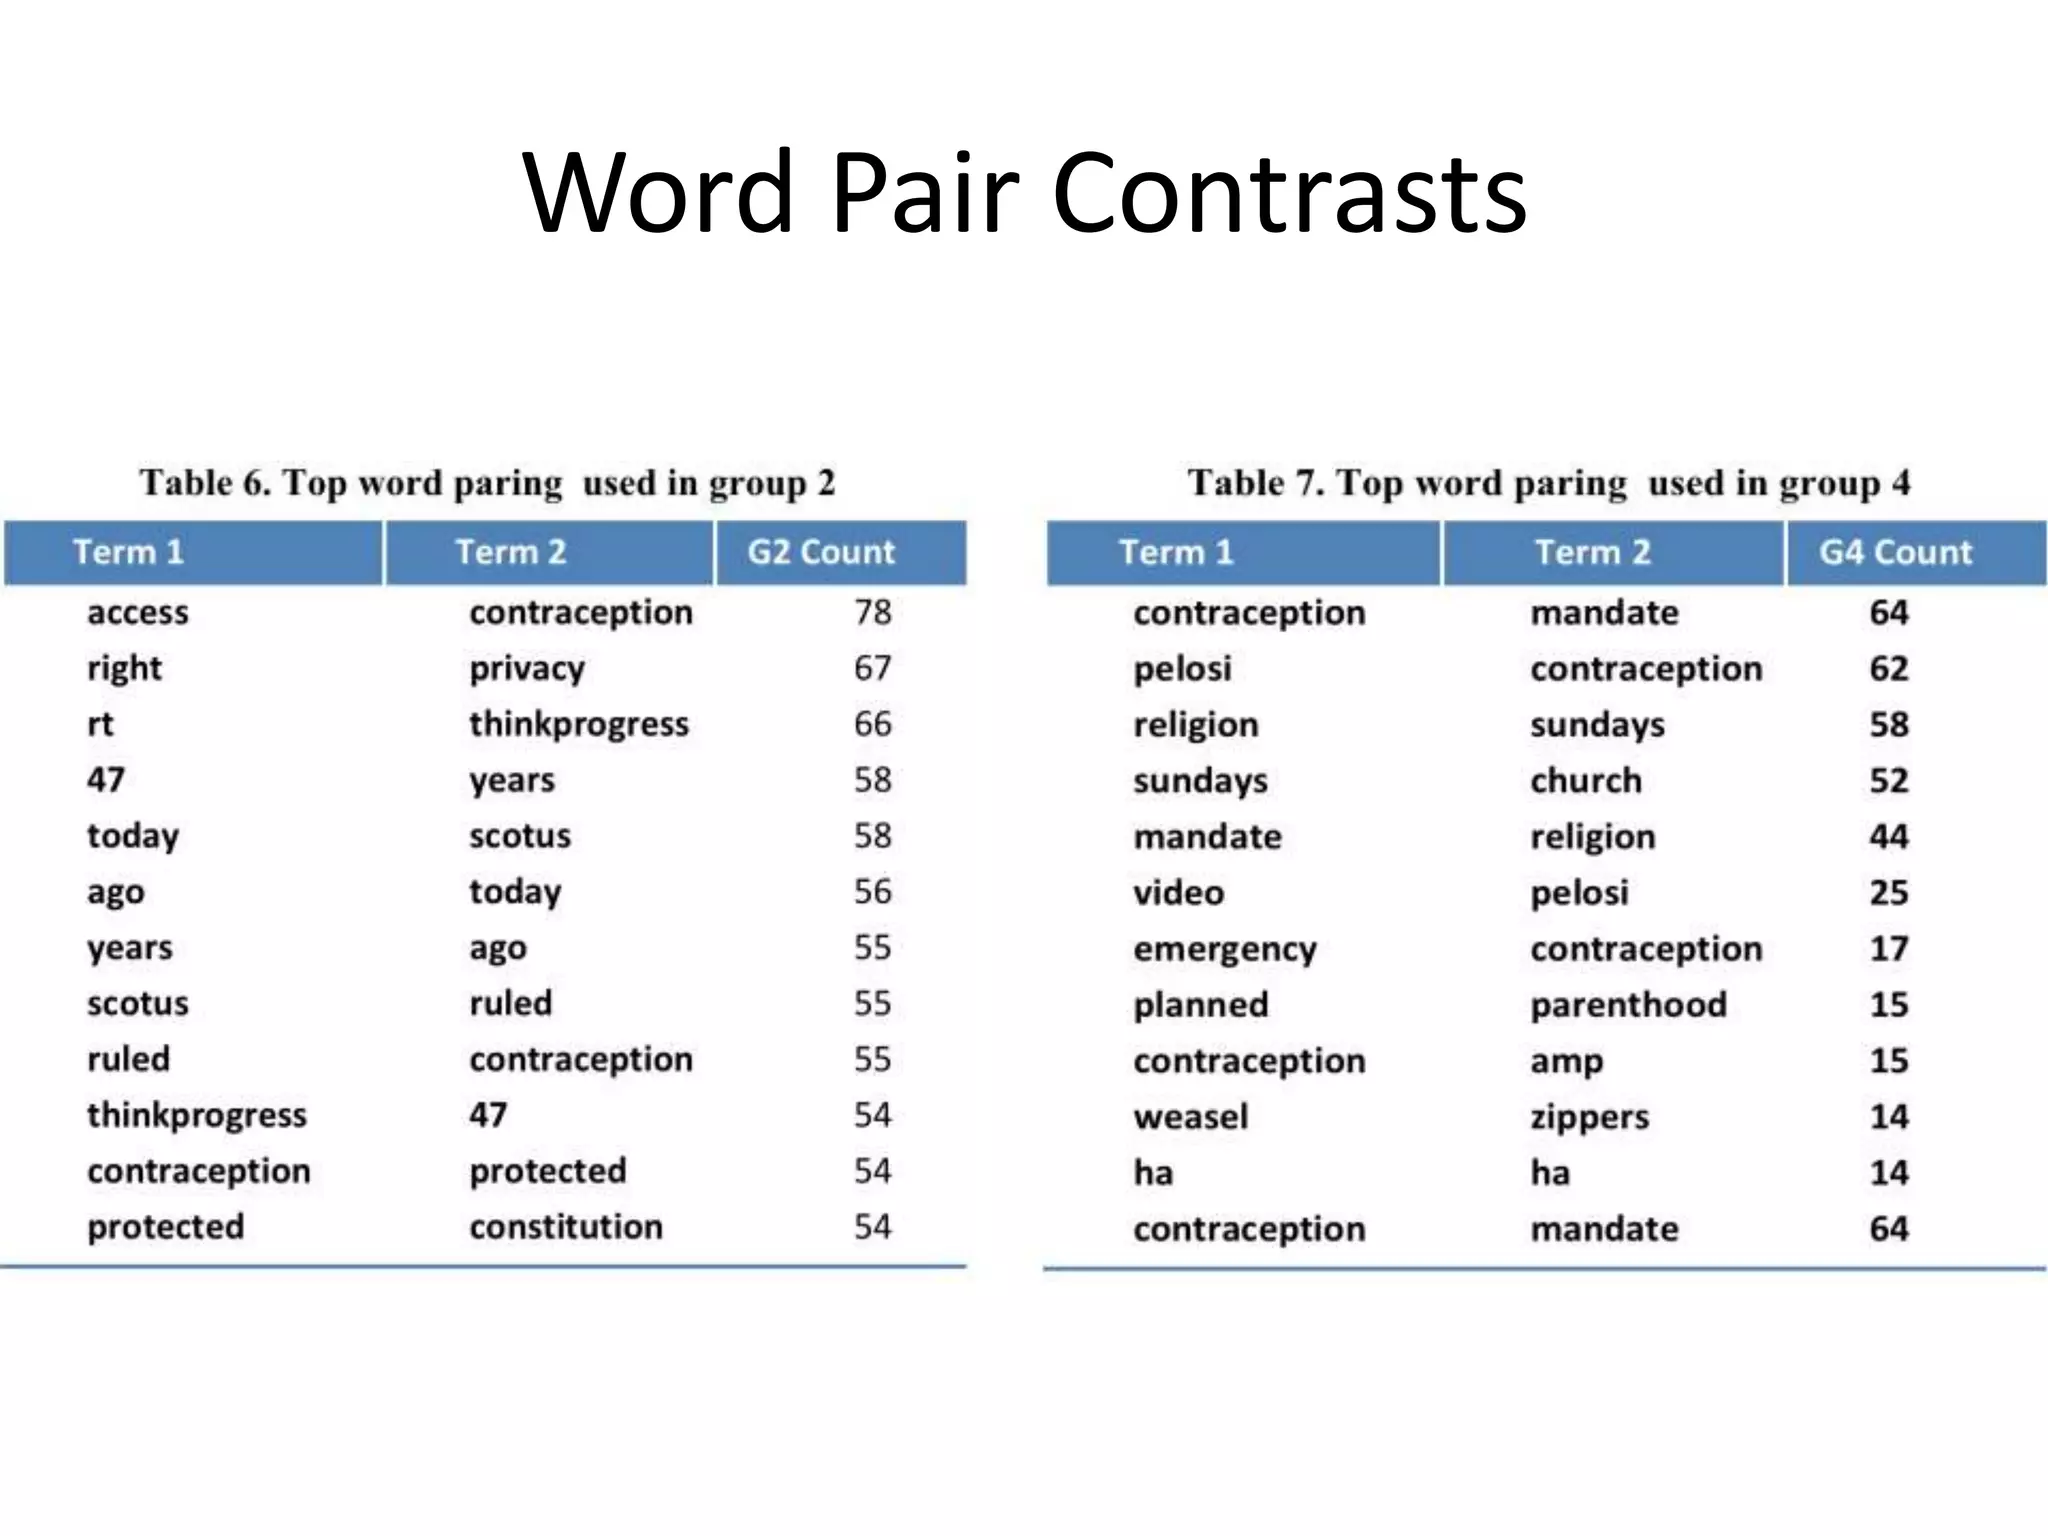
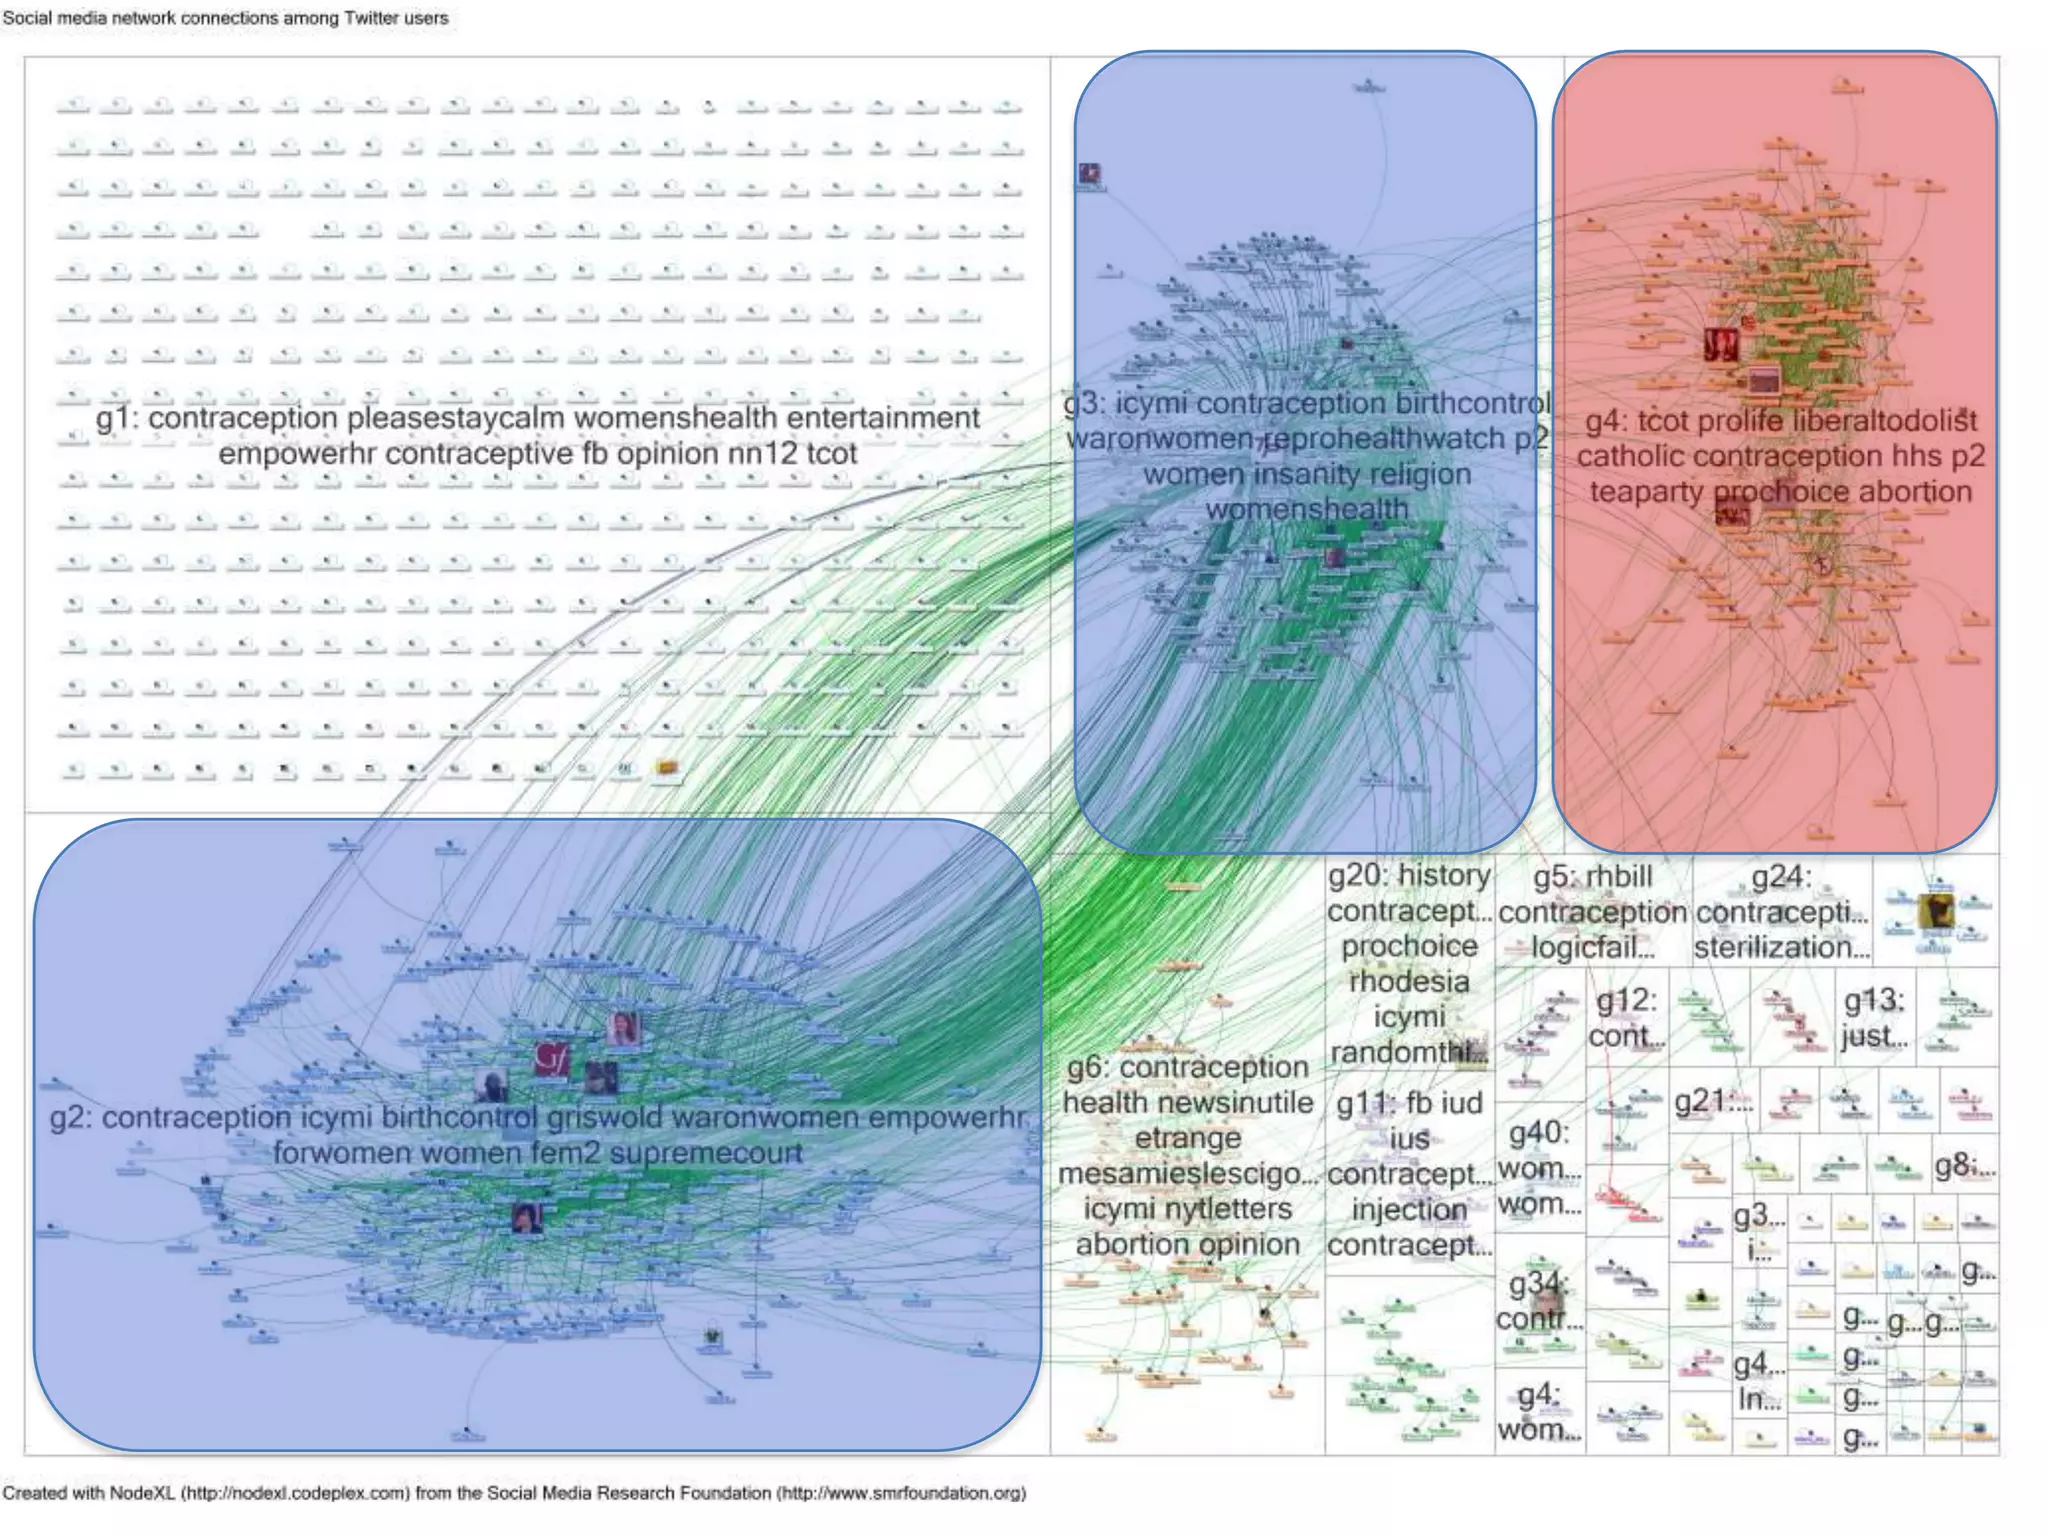
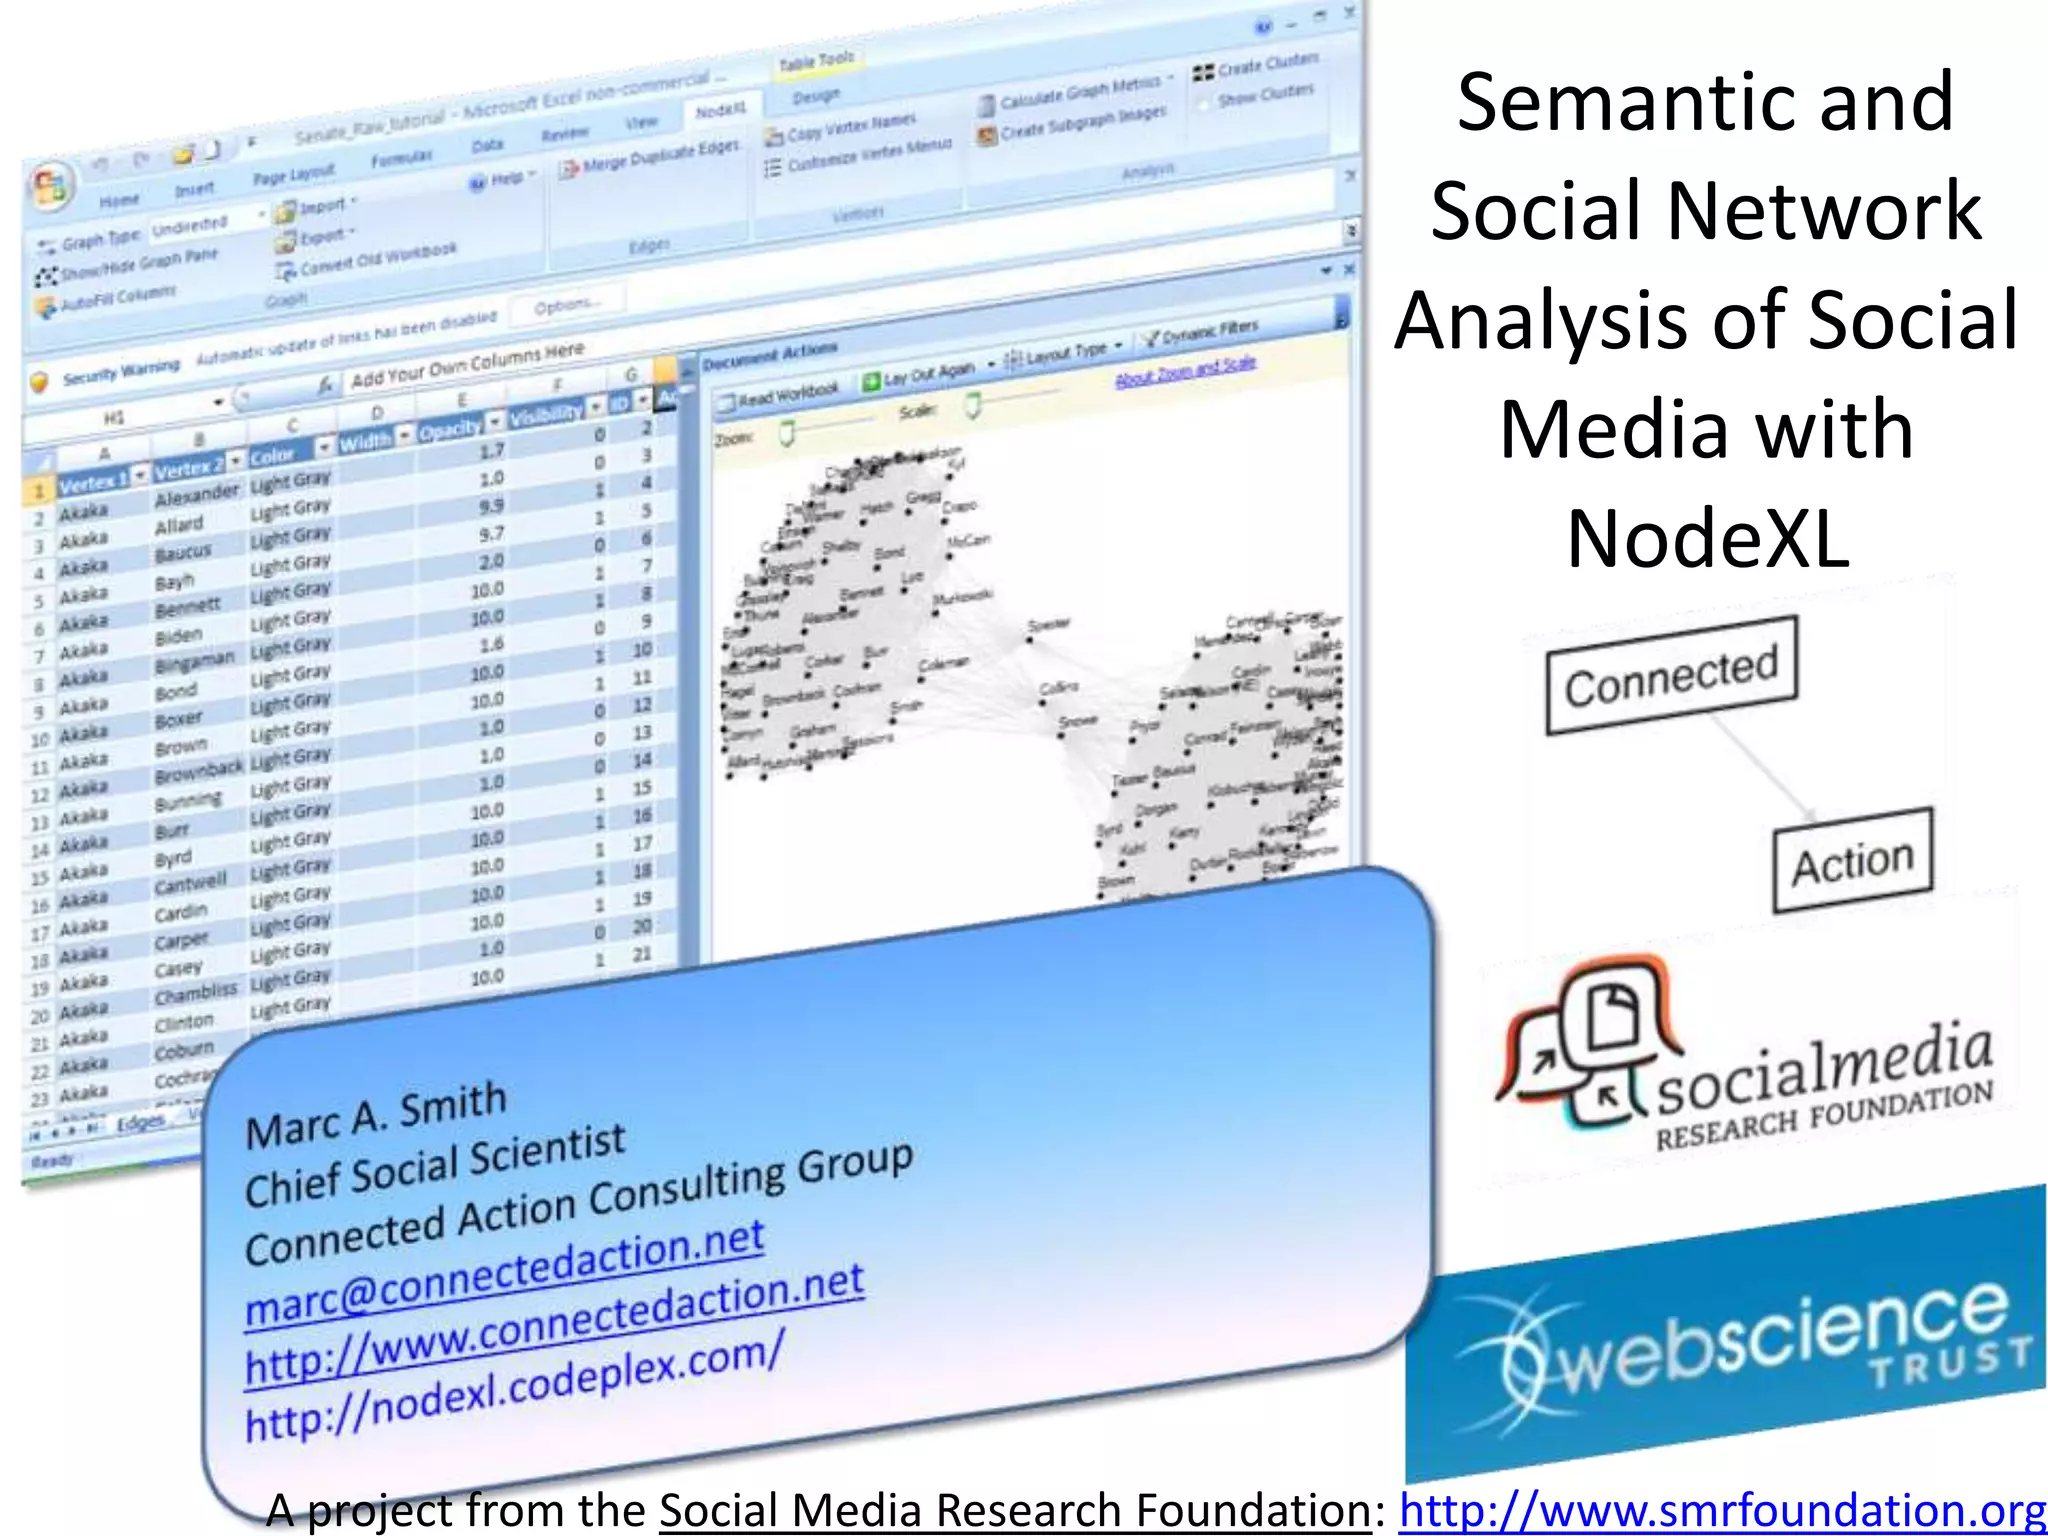
Semantic and
                                                    Social Network
                                                   Analysis of Social
                                                      Media with
                                                       NodeXL


A project from the Social Media Research Foundation: http://www.smrfoundation.org
Social Media Research Foundation
       http://smrfoundation.org
Social Media Research Foundation
    People             Disciplines                Institutions

   University      Computer Science         University of Maryland
    Faculty
   Students            HCI, CSCW            Oxford Internet Institute

   Industry        Machine Learning           Stanford University

  Independent   Information Visualization     Microsoft Research

  Researchers            UI/UX                 Illinois Institute of
                                                    Technology
  Developers    Social Science/Sociology       Connected Action

                   Network Analysis                  Cornell

                    Collective Action        Morningside Analytics
About Me
Introductions
Marc A. Smith
Chief Social Scientist
Connected Action Consulting Group
Marc@connectedaction.net
http://www.connectedaction.net
http://www.codeplex.com/nodexl
http://www.twitter.com/marc_smith
http://delicious.com/marc_smith/Paper
http://www.flickr.com/photos/marc_smith
http://www.facebook.com/marc.smith.sociologist
http://www.linkedin.com/in/marcasmith
http://www.slideshare.net/Marc_A_Smith
http://www.smrfoundation.org
Like MSPaint™ for graphs
What we are trying to do:
Open Tools, Open Data, Open Scholarship
• Build the “Firefox of GraphML” – open tools for
  collecting and visualizing social media data
• Connect users to network analysis – make
  network charts as easy as making a pie chart
• Connect researchers to social media data sources
• Archive: Be the “Allen Very Large Telescope Array”
  for Social Media data – coordinate and aggregate
  the results of many user’s data collection and
  analysis
• Create open access research papers & findings
• Make “collections of connections” easy for users
  to manage
What we have done: Open Tools
• NodeXL
• Data providers (“spigots”)
  –   ThreadMill Message Board
  –   Exchange Enterprise Email
  –   Voson Hyperlink
  –   SharePoint
  –   Facebook
  –   Twitter
  –   YouTube
  –   Flickr
What we have done: Open Data
• NodeXLGraphGallery.org
  – User generated collection
    of network graphs,
    datasets and annotations
  – Collective repository for
    the research community
  – Published collections of
    data from a range of social
    media data sources to help
    students and researchers
    connect with data of
    interest and relevance
Now Available
Group-in-a-box Layout
#teaparty
                                                                       15 November 2011


#occupywallstreet
15 November 2011


http://www.newscientist.com/blogs/onepercent/2011/11/occupy-vs-tea-party-what-their.html
This graph represents a
     directed network of
      1,360 Twitter users
    whose recent tweets
contained "contraceptive
 OR contraception". The
   network was obtained
 on Friday, 08 June 2012
  at 13:22 UTC. There is
 an edge for each follows
 relationship. There is an
  edge for each "replies-
     to" relationship in a
 tweet. There is an edge
     for each "mentions"
        relationship in a
   tweet. There is a self-
loop edge for each tweet
 that is not a "replies-to"
     or "mentions". The
 tweets were made over
   the 2-day period from
  Thursday, 07 June 2012
  at 18:46 UTC to Friday,
   08 June 2012 at 13:06
       UTC. The graph's
vertices were grouped by
cluster using the Clauset-
 Newman-Moore cluster
    algorithm. The edge
     colors are based on
 relationship values. The
vertex sizes are based on
   each user’s number of
      followers. Table 1
    reports the summary
    network metrics that
      describe the graph.
Summary network metrics
 Table 1. Summary network metrics for the graph in Figure 1
 Network Metric                                      Value
                                  Graph Type      Directed
                                     Vertices        1360
                               Unique Edges          5641
                        Edges With Duplicates         771
                                  Total Edges        6412
                                   Self-Loops        1096
                        Connected Components          427
          Single-Vertex Connected Components          395
  Maximum Vertices in a Connected Component           880
        Max Edges in a Connected Component           5818
        Maximum Geodesic Distance (Diameter)           12
                  Average Geodesic Distance      3.557807
                                Graph Density 0.002705817
                                   Modularity    0.446145
The Vertices spreadsheet lists users who contributed a
       tweet containing the terms “contraception OR
contraceptives” over two days in early June 2012. Users are
 ranked by their computed betweenness centrality within
 the network of follows, replies, and mentions edges. The
 top 10 vertices, ranked by betweenness centrality are the
   accounts at the center of the network. These include:
    @thinkprogress, @gatesfoundation, @SandraFluke,
  @maleeek, @Change, @foxandfriends, @melindagates,
          @AshleyJudd, @cnalive, and @SOHLTC.
NodeXL calculates
network metrics and
    word pairs
Contrasting groups
The Content summary
 spreadsheet displays the most
frequently used URLs, hashtags,
   and user names within the
 network as a whole and within
   each calculated sub-group.
Contrast hashtags in Groups 2 & 4
Contrasting URL references
Word Pair Contrasts
Semantic and
                                                    Social Network
                                                   Analysis of Social
                                                      Media with
                                                       NodeXL


A project from the Social Media Research Foundation: http://www.smrfoundation.org
20120622 web sci12-won-marc smith-semantic and social network analysis of …

20120622 web sci12-won-marc smith-semantic and social network analysis of …

  • 2.
    Semantic and Social Network Analysis of Social Media with NodeXL A project from the Social Media Research Foundation: http://www.smrfoundation.org
  • 3.
    Social Media ResearchFoundation http://smrfoundation.org
  • 4.
    Social Media ResearchFoundation People Disciplines Institutions University Computer Science University of Maryland Faculty Students HCI, CSCW Oxford Internet Institute Industry Machine Learning Stanford University Independent Information Visualization Microsoft Research Researchers UI/UX Illinois Institute of Technology Developers Social Science/Sociology Connected Action Network Analysis Cornell Collective Action Morningside Analytics
  • 5.
    About Me Introductions Marc A.Smith Chief Social Scientist Connected Action Consulting Group Marc@connectedaction.net http://www.connectedaction.net http://www.codeplex.com/nodexl http://www.twitter.com/marc_smith http://delicious.com/marc_smith/Paper http://www.flickr.com/photos/marc_smith http://www.facebook.com/marc.smith.sociologist http://www.linkedin.com/in/marcasmith http://www.slideshare.net/Marc_A_Smith http://www.smrfoundation.org
  • 6.
  • 7.
    What we aretrying to do: Open Tools, Open Data, Open Scholarship • Build the “Firefox of GraphML” – open tools for collecting and visualizing social media data • Connect users to network analysis – make network charts as easy as making a pie chart • Connect researchers to social media data sources • Archive: Be the “Allen Very Large Telescope Array” for Social Media data – coordinate and aggregate the results of many user’s data collection and analysis • Create open access research papers & findings • Make “collections of connections” easy for users to manage
  • 8.
    What we havedone: Open Tools • NodeXL • Data providers (“spigots”) – ThreadMill Message Board – Exchange Enterprise Email – Voson Hyperlink – SharePoint – Facebook – Twitter – YouTube – Flickr
  • 9.
    What we havedone: Open Data • NodeXLGraphGallery.org – User generated collection of network graphs, datasets and annotations – Collective repository for the research community – Published collections of data from a range of social media data sources to help students and researchers connect with data of interest and relevance
  • 11.
  • 12.
  • 13.
    #teaparty 15 November 2011 #occupywallstreet 15 November 2011 http://www.newscientist.com/blogs/onepercent/2011/11/occupy-vs-tea-party-what-their.html
  • 15.
    This graph representsa directed network of 1,360 Twitter users whose recent tweets contained "contraceptive OR contraception". The network was obtained on Friday, 08 June 2012 at 13:22 UTC. There is an edge for each follows relationship. There is an edge for each "replies- to" relationship in a tweet. There is an edge for each "mentions" relationship in a tweet. There is a self- loop edge for each tweet that is not a "replies-to" or "mentions". The tweets were made over the 2-day period from Thursday, 07 June 2012 at 18:46 UTC to Friday, 08 June 2012 at 13:06 UTC. The graph's vertices were grouped by cluster using the Clauset- Newman-Moore cluster algorithm. The edge colors are based on relationship values. The vertex sizes are based on each user’s number of followers. Table 1 reports the summary network metrics that describe the graph.
  • 16.
    Summary network metrics Table 1. Summary network metrics for the graph in Figure 1 Network Metric Value Graph Type Directed Vertices 1360 Unique Edges 5641 Edges With Duplicates 771 Total Edges 6412 Self-Loops 1096 Connected Components 427 Single-Vertex Connected Components 395 Maximum Vertices in a Connected Component 880 Max Edges in a Connected Component 5818 Maximum Geodesic Distance (Diameter) 12 Average Geodesic Distance 3.557807 Graph Density 0.002705817 Modularity 0.446145
  • 17.
    The Vertices spreadsheetlists users who contributed a tweet containing the terms “contraception OR contraceptives” over two days in early June 2012. Users are ranked by their computed betweenness centrality within the network of follows, replies, and mentions edges. The top 10 vertices, ranked by betweenness centrality are the accounts at the center of the network. These include: @thinkprogress, @gatesfoundation, @SandraFluke, @maleeek, @Change, @foxandfriends, @melindagates, @AshleyJudd, @cnalive, and @SOHLTC.
  • 18.
  • 19.
  • 20.
    The Content summary spreadsheet displays the most frequently used URLs, hashtags, and user names within the network as a whole and within each calculated sub-group.
  • 21.
  • 22.
  • 23.
  • 25.
    Semantic and Social Network Analysis of Social Media with NodeXL A project from the Social Media Research Foundation: http://www.smrfoundation.org