This document provides instructions for using geometry tools and concepts in GeoGebra. It includes sections on reflection, area under a curve using Riemann sums, circle theorems, and calculating angle sums in triangles. The reflection section demonstrates how to reflect polygons across lines. The area under a curve section shows how to calculate lower and upper Riemann sums and the actual integral. The circle theorems section lists several theorems without examples. The triangle section provides step-by-step instructions to construct a triangle, rotate it, and calculate interior angles and their sum. Users are encouraged to practice these concepts by following the commands.


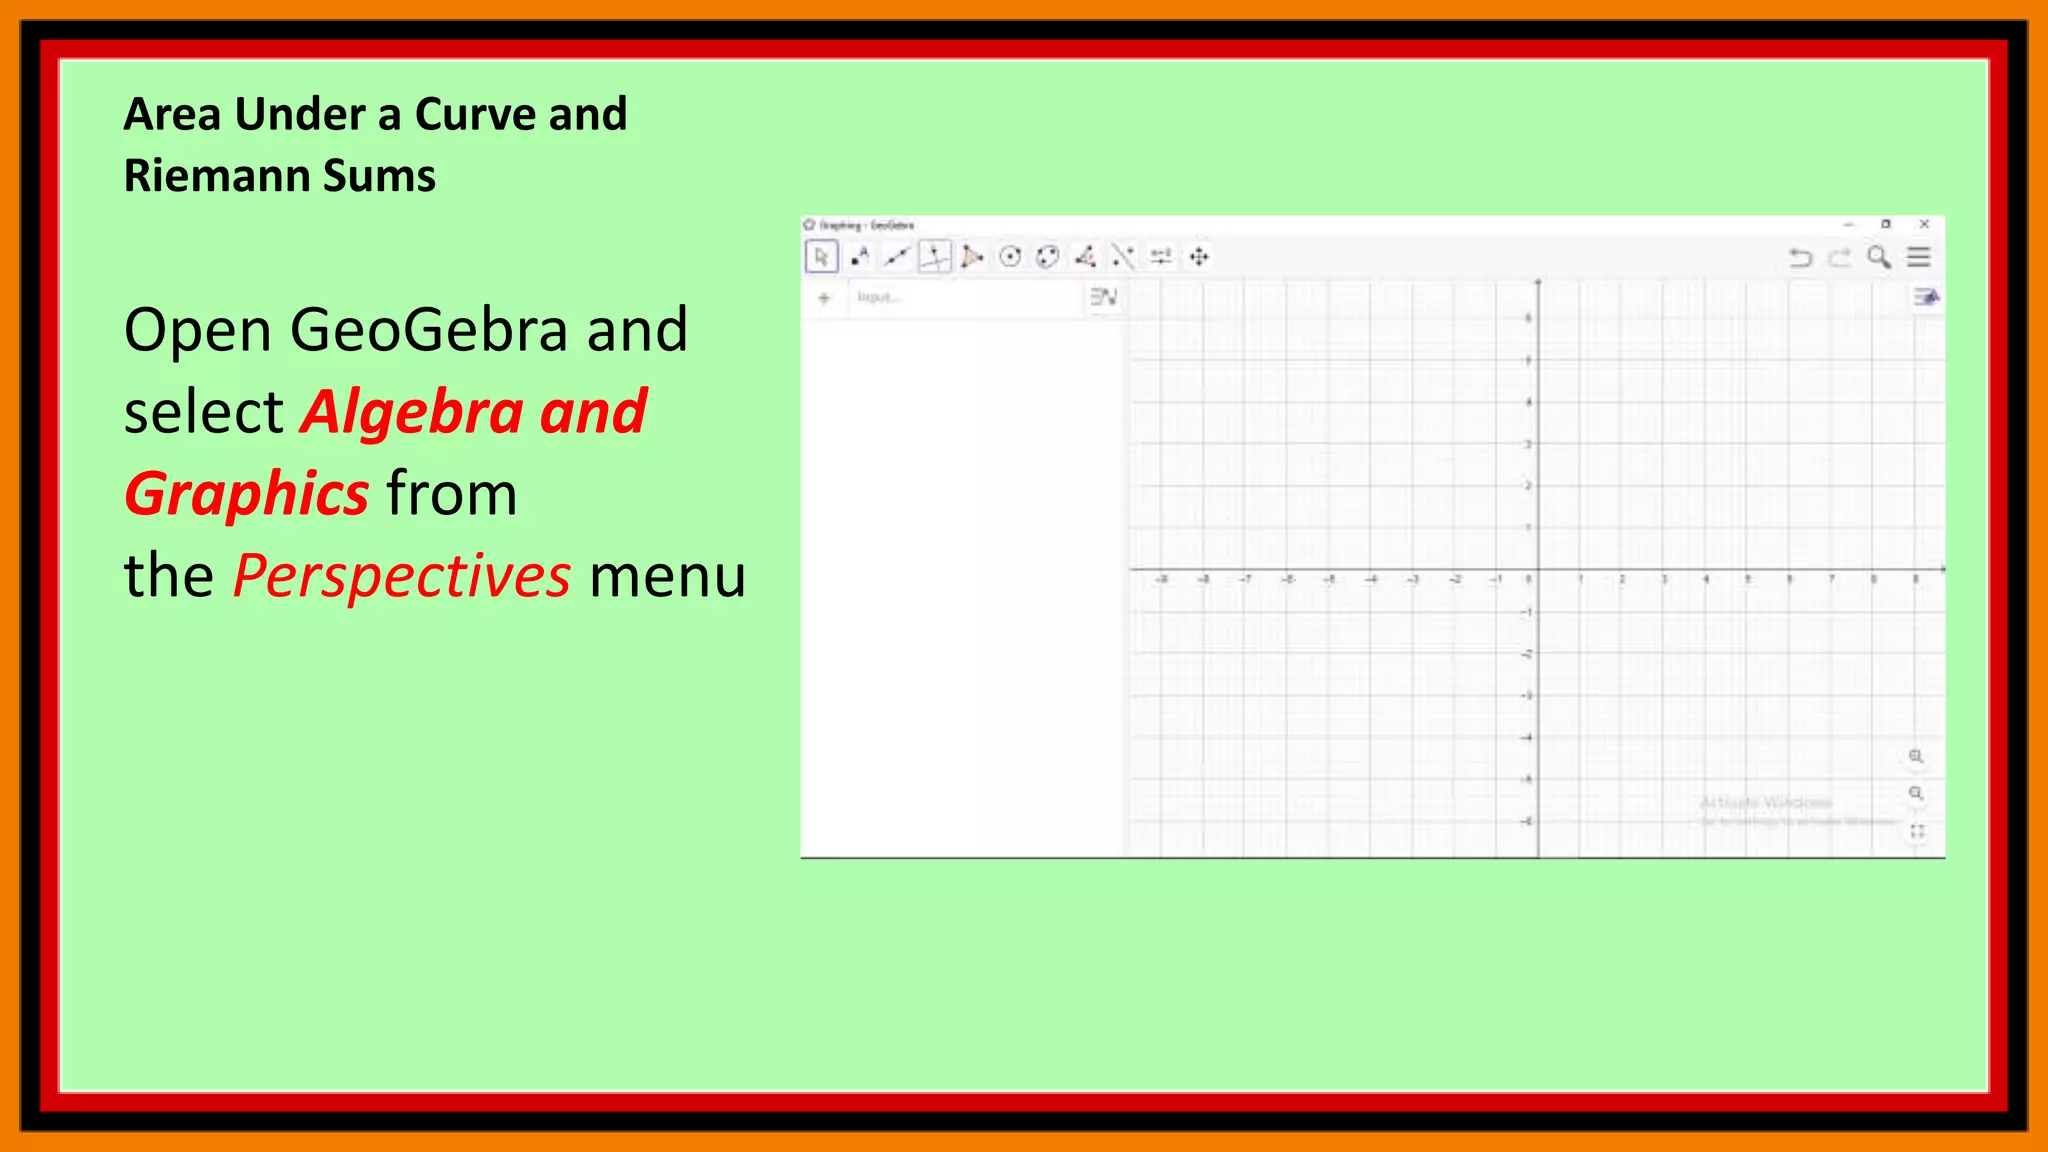

![Area Under a Curve and
Riemann Sums
To construct the lower sum
(rectangles whose upper
left corners are on the
curve),
type lowersum[f,0,1,n] and
then press the ENTER key
on your keyboard. That is,
the lowersum (sum of the
areas of rectangles) under
the function f from 0 to 1
with n number of
rectangles.
LowerSum(f,0,1,n)](https://image.slidesharecdn.com/geogebra9-210425141350/75/Geogebra-9-13-2048.jpg)

![Area Under a Curve and
Riemann Sums
To construct the upper
sum,
type uppersum[f,0,1,n
] in the drawing pad,
and press the ENTER
key.
upperSum(f,0,1,n)](https://image.slidesharecdn.com/geogebra9-210425141350/75/Geogebra-9-15-2048.jpg)


![Area Under a Curve and
Riemann Sums
To get the actual area
under the curve, we
need the integral of
the function f from 0
to 1. To do this, type
integral integral[f, 0,
1] in the Input bar,
and press the ENTER
key.
Area under curve](https://image.slidesharecdn.com/geogebra9-210425141350/75/Geogebra-9-19-2048.jpg)
![Area Under a Curve and
Riemann Sums
In the Caption text
box, type Show/Hide
Lower
Sum, select Number a:
Lower Sum[f,0,1,n] in
the Select
objects… box, and
then click the OK
button.
a: Lower Sum[f,0,1,n]
Click the OK button](https://image.slidesharecdn.com/geogebra9-210425141350/75/Geogebra-9-21-2048.jpg)

![Area Under a Curve and
Riemann Sums
Try to change the
values of a: Lower
Sum[f,0,1,n] to a:
Lower Sum[f,0,3,n]
and b: Upper
Sum[f,0,1,n] to b:
Upper Sum[f,0,3,n].
What happens?
Change values here](https://image.slidesharecdn.com/geogebra9-210425141350/75/Geogebra-9-23-2048.jpg)