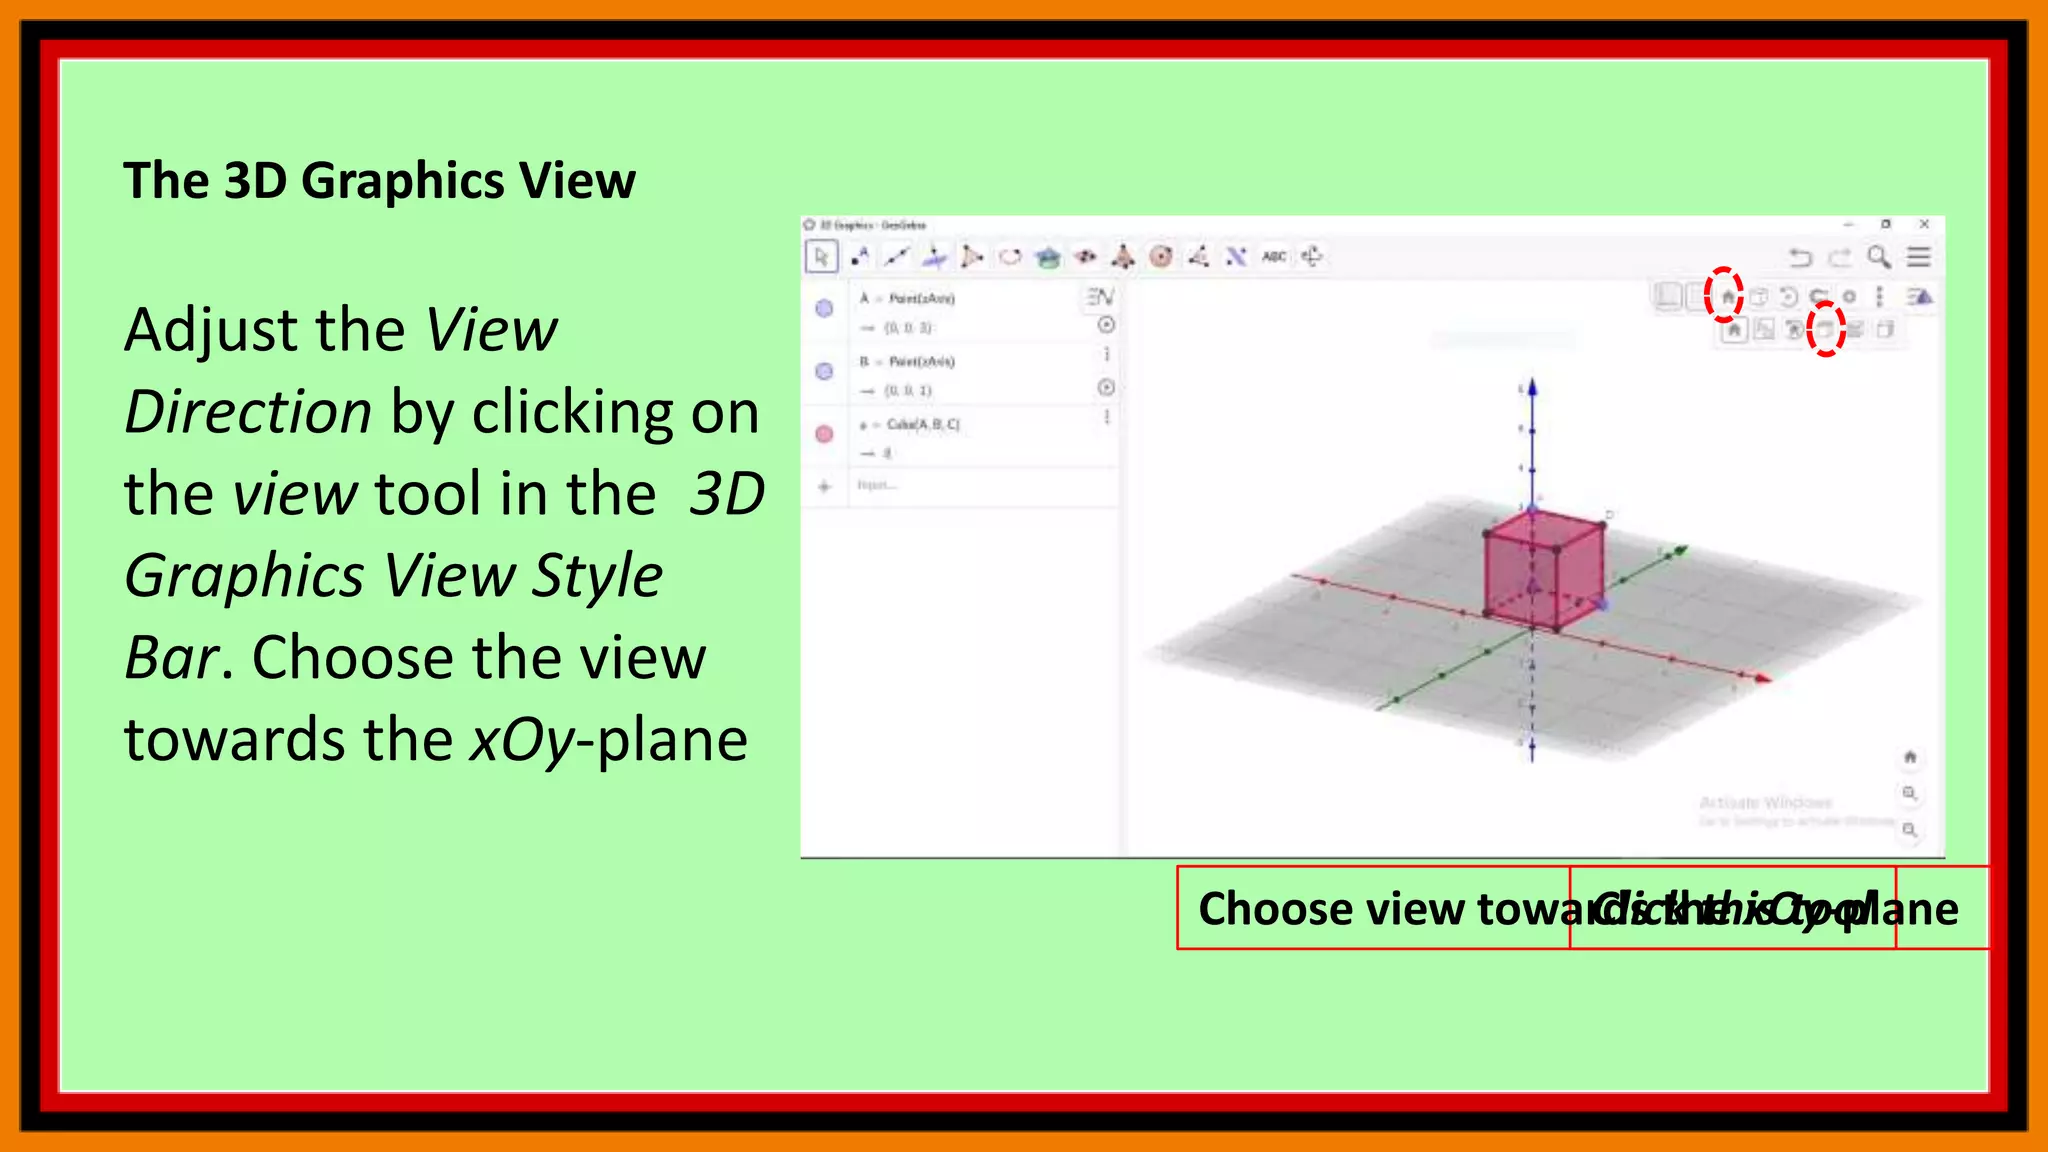
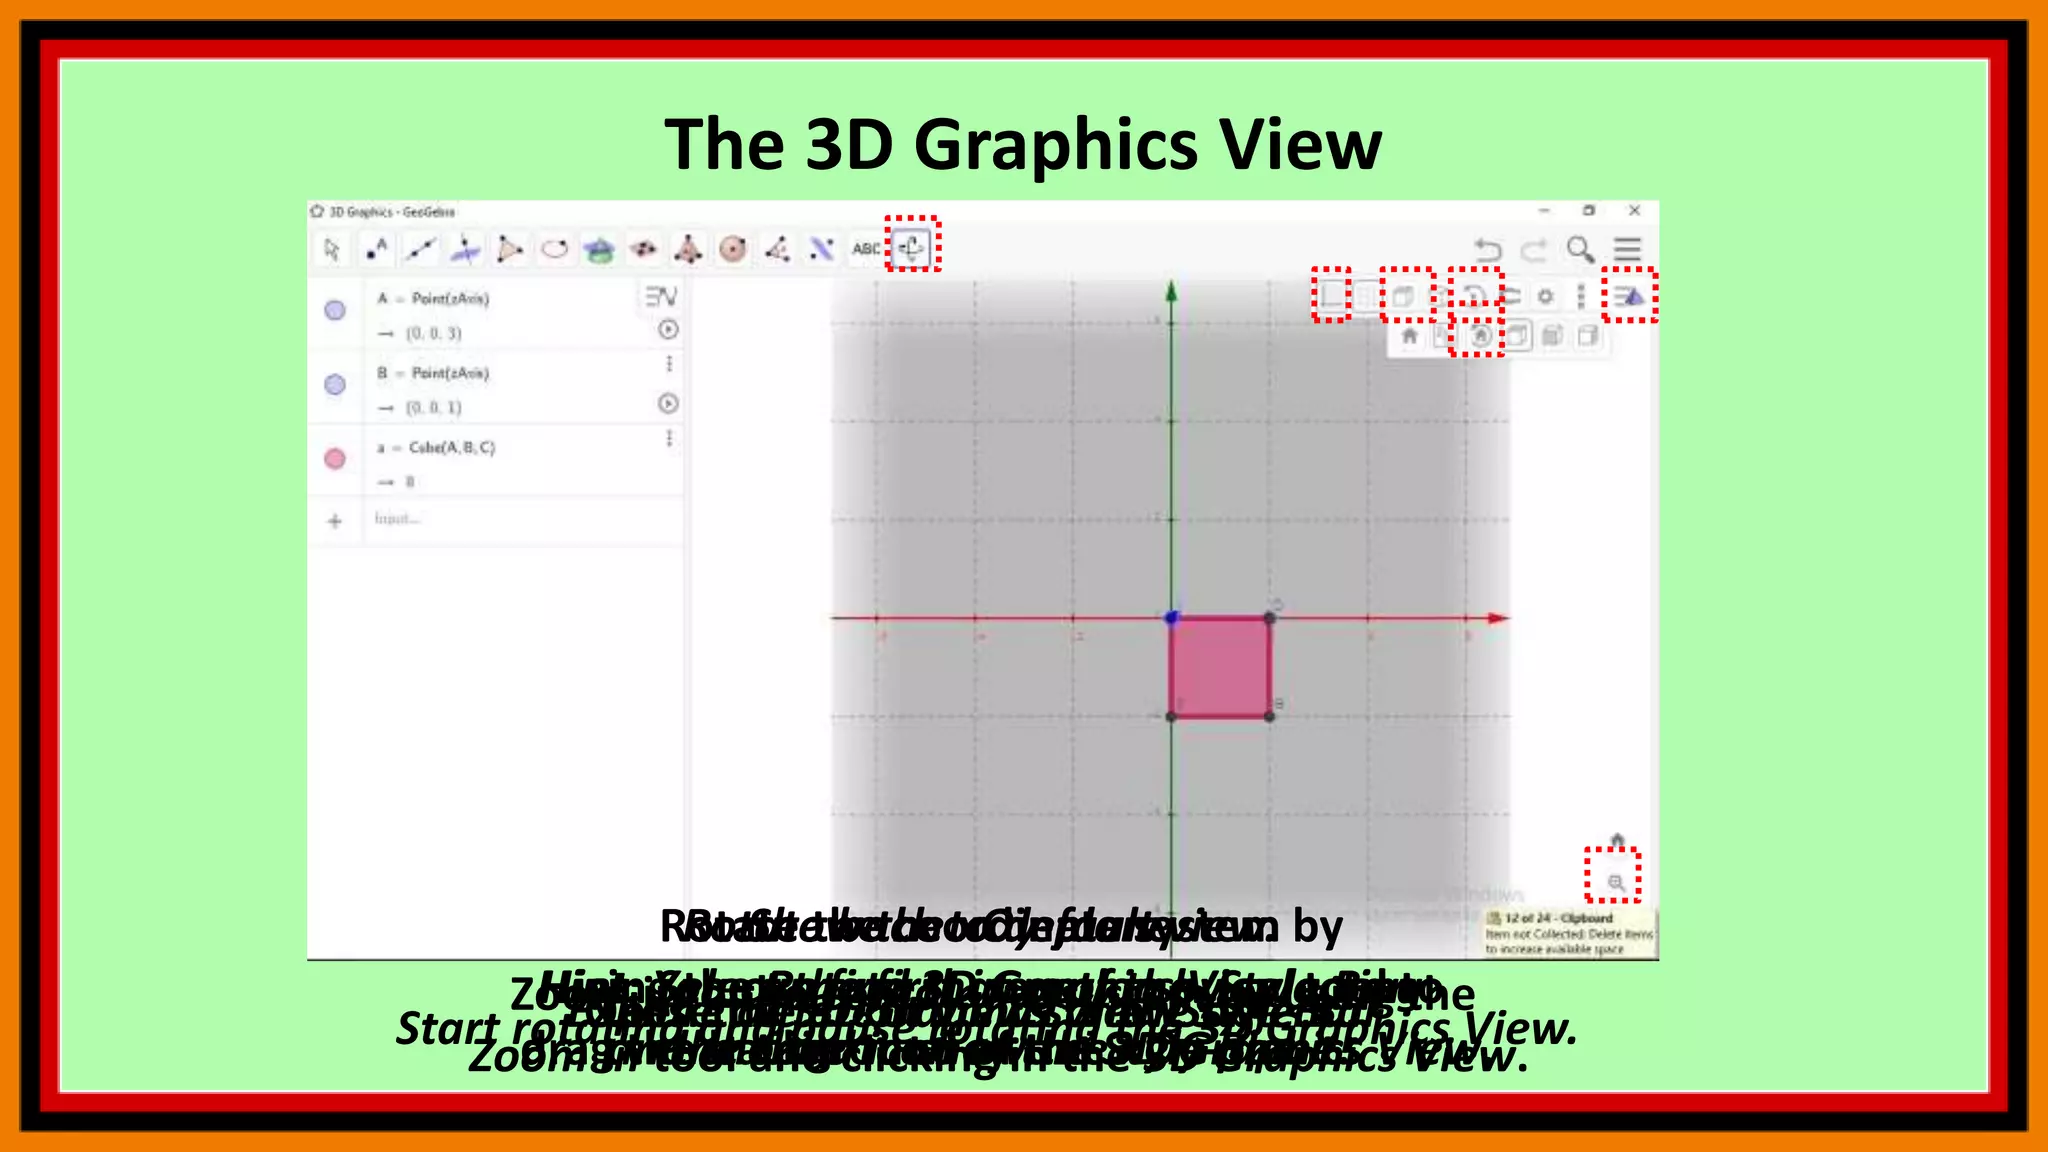
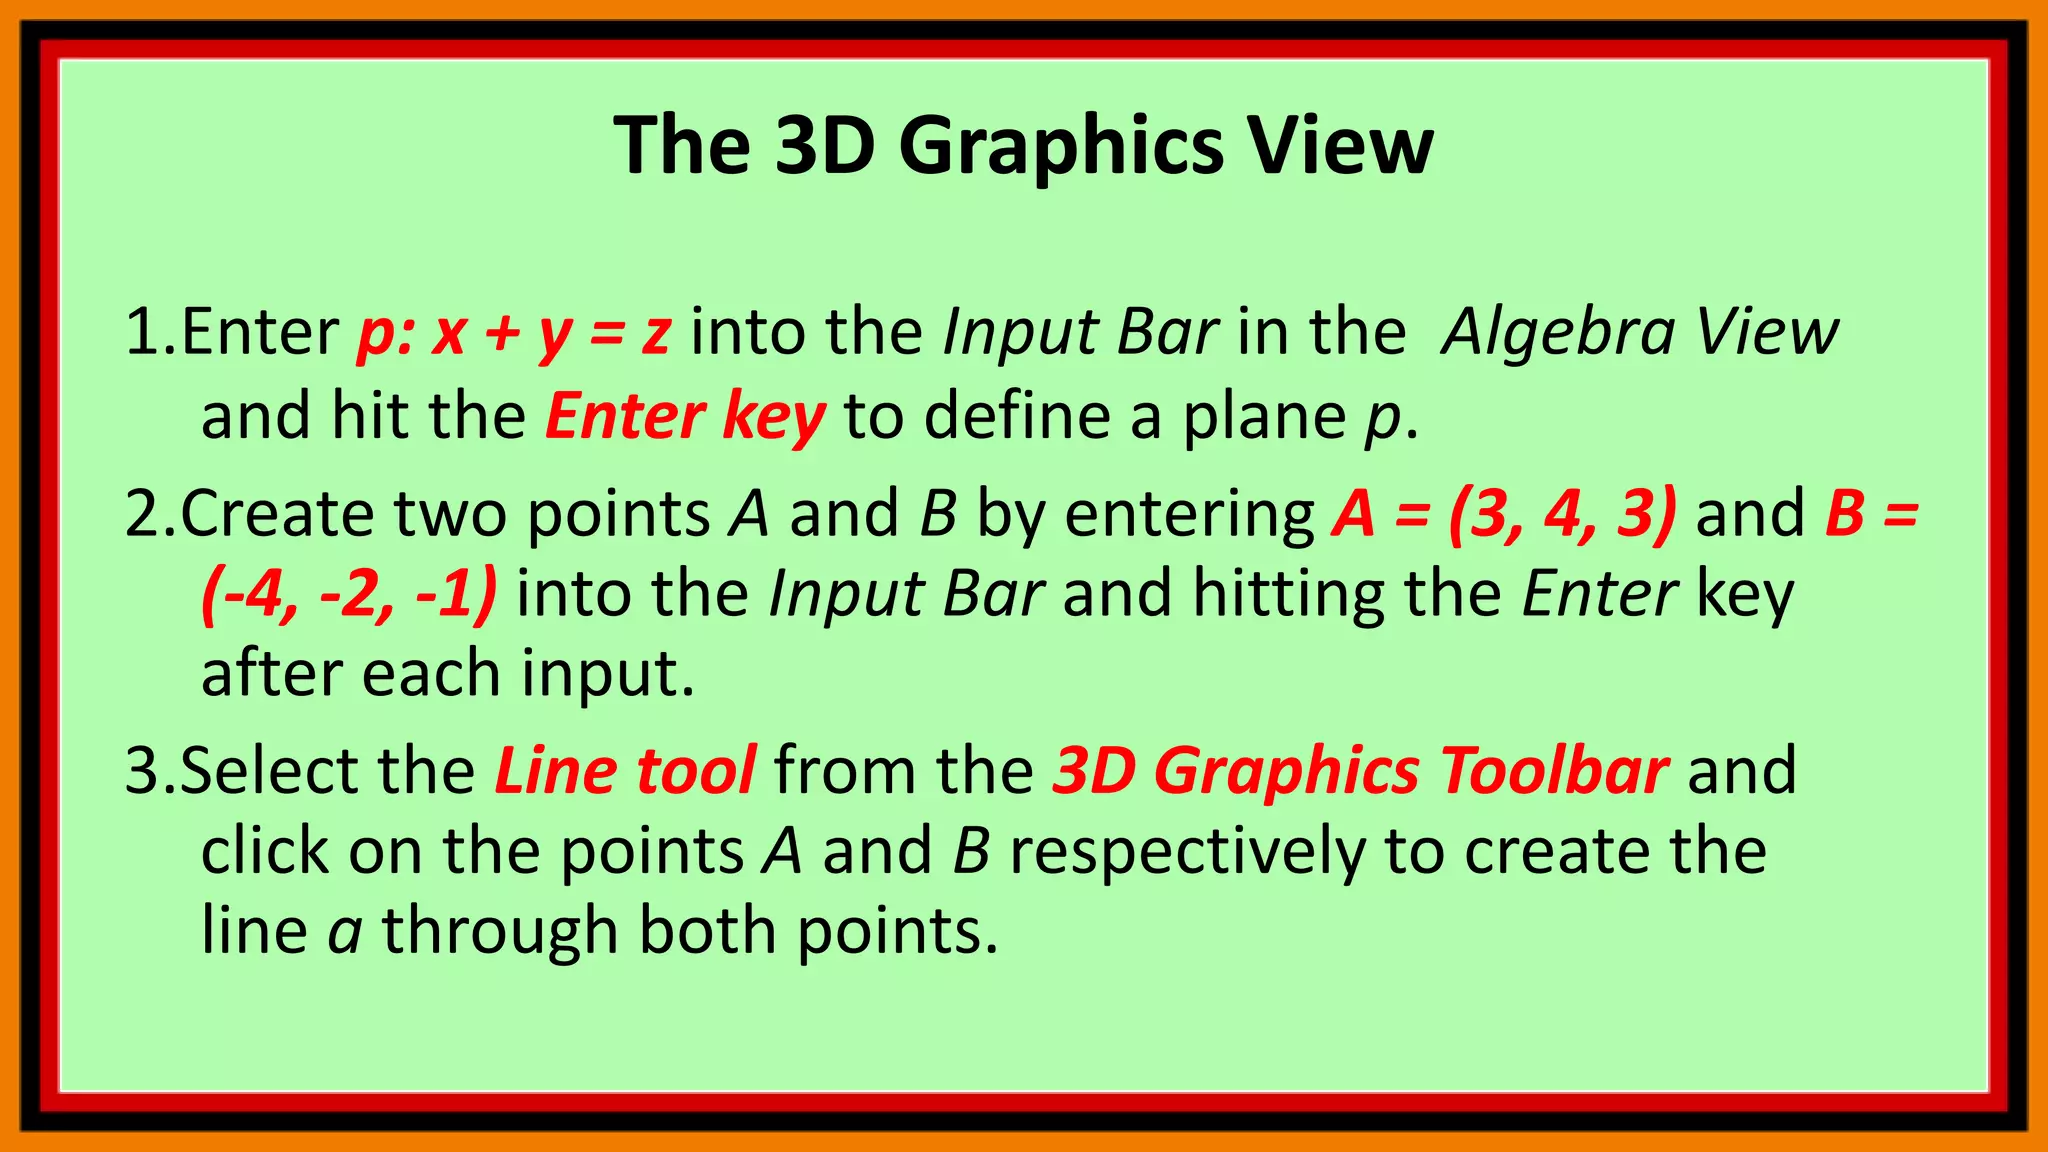
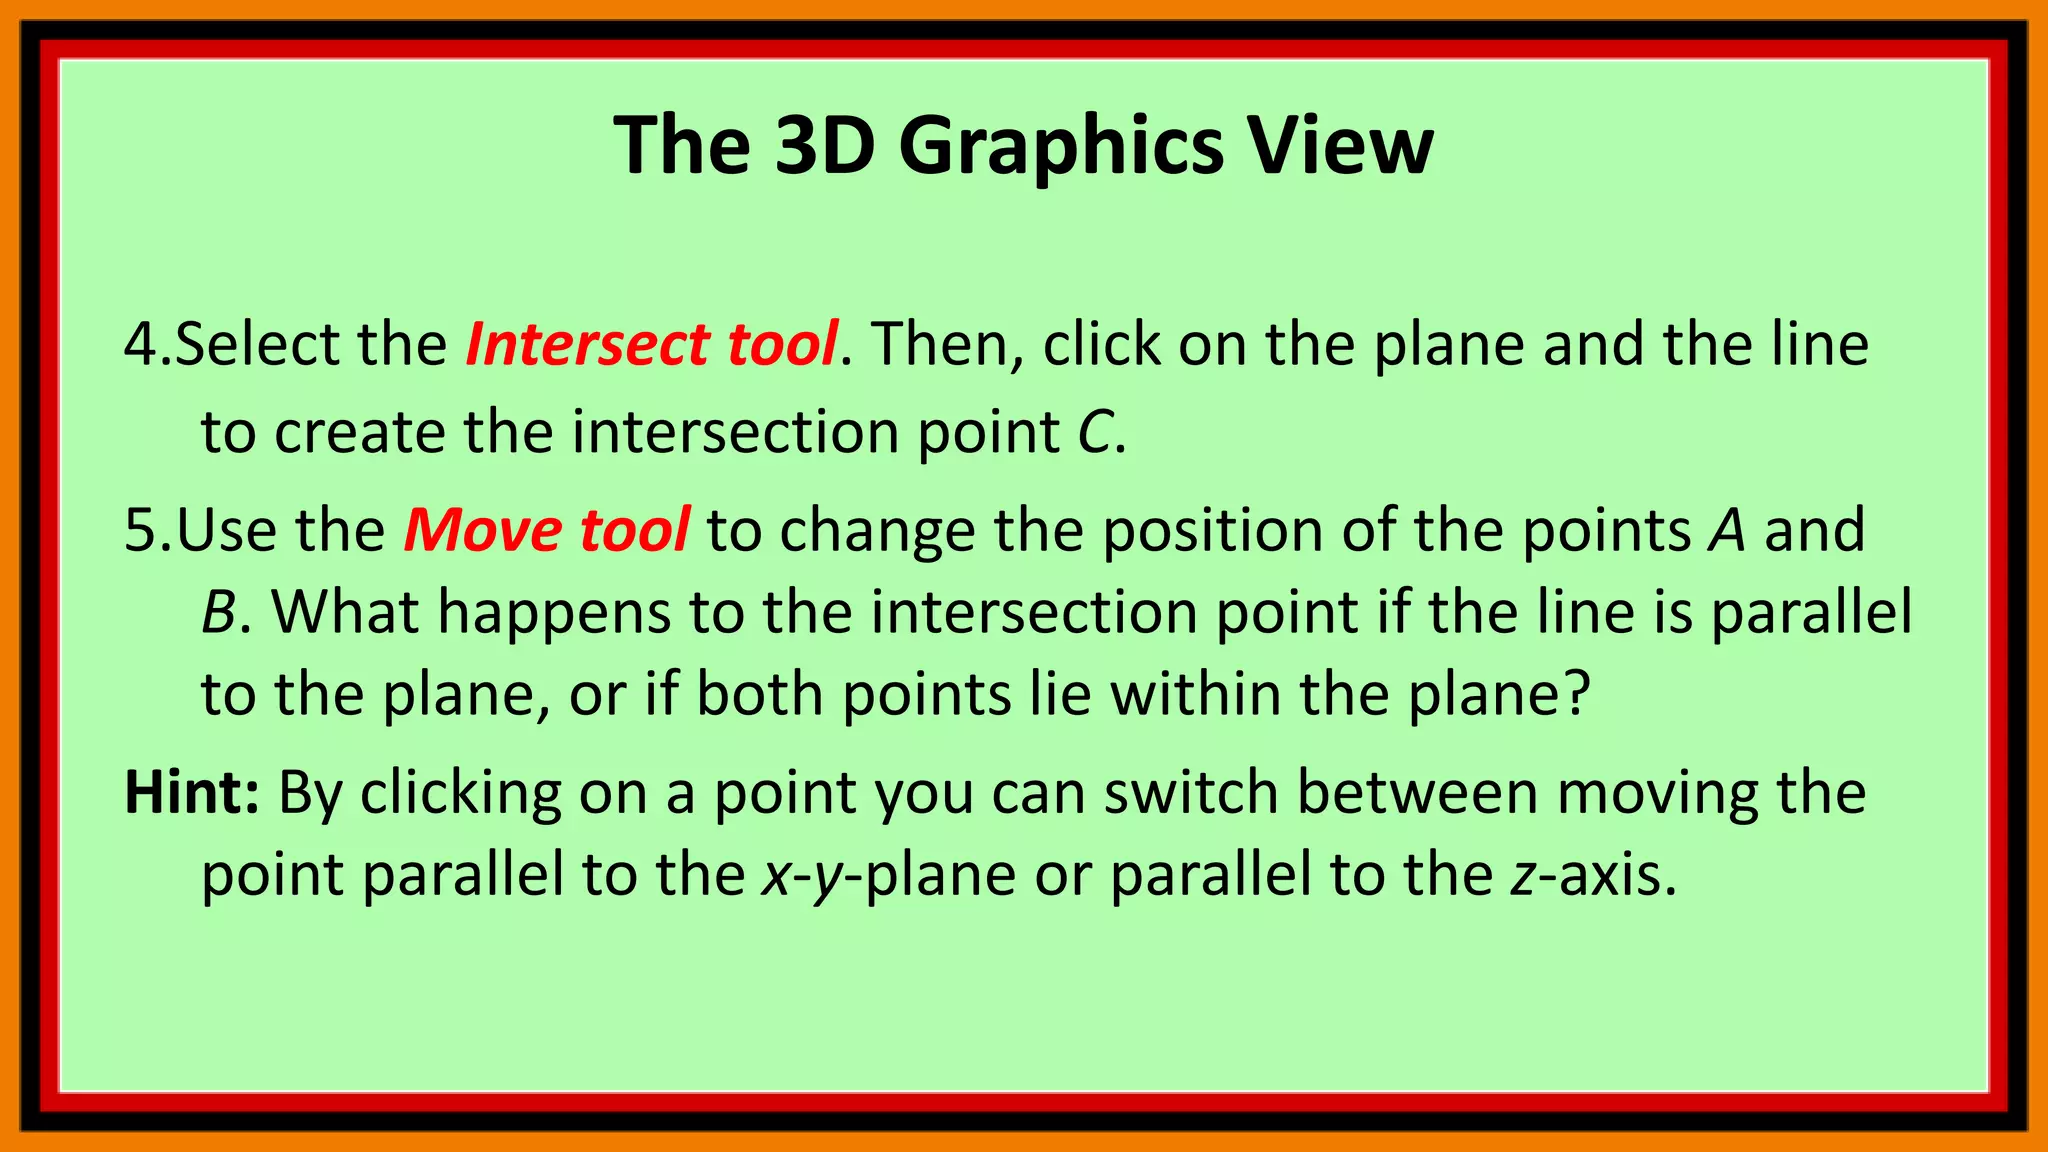
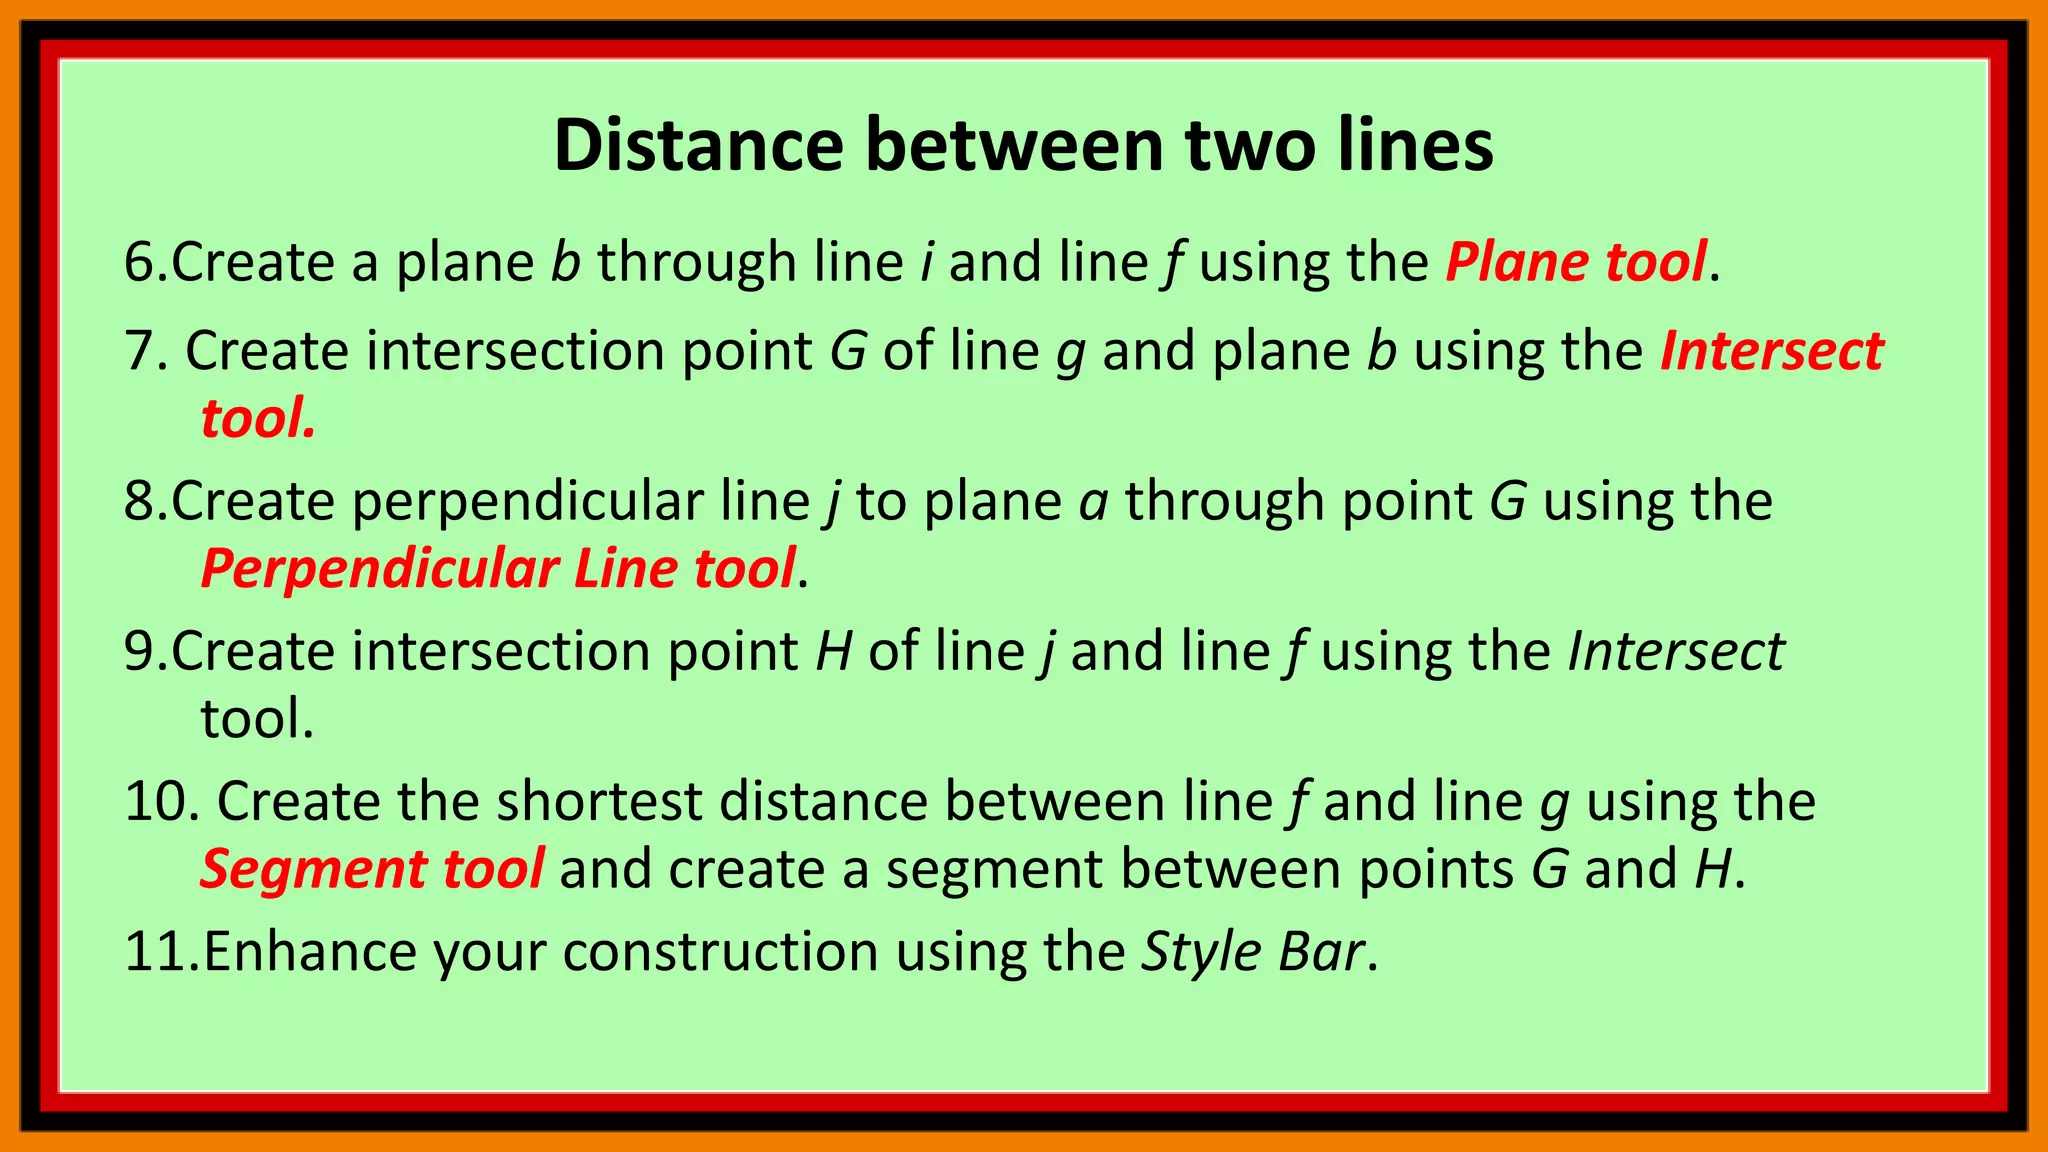
3D Graphics
Contents
 3D Graphics Perspective
 Customizing the 3D Graphics View
 Intersection of a Plane and a Line
 Distance between two lines
 Functions of two variables
 Commands
3D Graphics Perspective
The 3D Graphics Perspective includes the 3D Graphics
View and the Algebra View. By default, the coordinate axes
and the xOy-plane are shown in the 3D Graphics View.
Furthermore, the 3D Graphics View Toolbar and the Undo /
Redo buttons in the top right corner are displayed.
The 3D Graphics View
Using the construction
Tools available in the
3D Graphics View
Toolbar you can create
geometric
constructions in
the 3D Graphics View.
Geometric Construction
3D Graphics View Toolbar
The 3D Graphics View
Select any
construction Tool from
the 3D Graphics View
Toolbar and read the
appearing Tooltip to
find out how to use
the selected Tool.
Tooltip
The 3D Graphics View
Note: Any object you
create in the 3D
Graphics View also has
an algebraic
representation in
the Algebra View.
Algebraic representation
The 3D Graphics View
Example
Select the Sphere with
Center through Point tool
and click twice in the 3D
Graphics View. The first
click creates the center
point while the second
click creates a sphere and
a point on the sphere. First Click
Second Click
The 3D Graphics View
Task
Select the Cube tool
from the Toolbox of
solids and click twice in
the 3D Graphics View
to create a cube
First Click
Second Click
The 3D Graphics View
Select the Move tool and
change the position of the
points and the size of the
cube by dragging them
with the pointer.
Hint: By clicking on a point you
can switch between moving the
point parallel to the x-y-plane or
parallel to the z-axis.
The 3D Graphics View
Open the 3D Graphics
View Style Bar by
clicking the button in
the top right corner.
3D Graphics View Style Bar
The 3D Graphics View
Adjust the View
Direction by clicking on
the view tool in the 3D
Graphics View Style
Bar. Choose the view
towards the xOy-plane
Click this tool
Choose view towards the xOy-plane
The 3D Graphics View
Rotate the 3D Graphics
View back to default
view.
Click here to return to default view
The 3D Graphics View
Select the Rotate 3D
Graphics View tool and
drag the background of
the 3D Graphics View
with your pointing
device.
Hint: Alternatively you can
right-drag the background of
the 3D Graphics View to rotate
the coordinate system.
Rotate 3D Graphics View tool
Customizing the 3D Graphics View
You can customize the 3D Graphics View according to the
mathematical topic you want to work with. The basic setup
can be changed using the 3D Graphics View Style Bar (e.g.
display of coordinate axes, xOy-plane, grid).
Note: In addition, the Settings provide more options to
customize the 3D Graphics View.
Customize the 3D Graphics View by following the instructions
below.
The 3D Graphics View
Open the 3D Graphics View Style Bar
Show the xOy-plane.
Hint: Select the first icon of the Style Bar
and choose to show the xOy-plane.
Explore different views of the object.
Start rotating and pause rotating the 3D Graphics View.
Rotate back to default view.
Hint: You can find that option by selecting
the third icon of the Style Bar.
Zoom into the coordinate system by using the
Zoom In tool and clicking in the 3D Graphics View.
Close the 3D Graphics View Style Bar.
Rotate the coordinate system by
using the Rotate 3D Graphics View tool to
drag the background of the 3D Graphics View.
Intersection of a Plane and a Line
Do It Yourself
Task 1
Intersect a plane and a line in the 3D Graphics View of
GeoGebra to create the intersection point.
The 3D Graphics View
1.Enter p: x + y = z into the Input Bar in the Algebra View
and hit the Enter key to define a plane p.
2.Create two points A and B by entering A = (3, 4, 3) and B =
(-4, -2, -1) into the Input Bar and hitting the Enter key
after each input.
3.Select the Line tool from the 3D Graphics Toolbar and
click on the points A and B respectively to create the
line a through both points.
The 3D Graphics View
4.Select the Intersect tool. Then, click on the plane and the line
to create the intersection point C.
5.Use the Move tool to change the position of the points A and
B. What happens to the intersection point if the line is parallel
to the plane, or if both points lie within the plane?
Hint: By clicking on a point you can switch between moving the
point parallel to the x-y-plane or parallel to the z-axis.
Distance between two lines
Task 2
Find out the shortest distance between two lines.
1. Select the Line tool and create two arbitrary lines f and g.
2.Select the Parallel Line tool and create a parallel line h of g through
point A. Create point E on the parallel line h using the Point on
Object tool.
3.Create a plane a through the points A, B and E using the Plane
through 3 Points tool.
4.Create a point F on line f using the Point on Object tool.
5.Create a perpendicular line i to plane a through point F using the
Perpendicular Line tool.
Distance between two lines
6.Create a plane b through line i and line f using the Plane tool.
7. Create intersection point G of line g and plane b using the Intersect
tool.
8.Create perpendicular line j to plane a through point G using the
Perpendicular Line tool.
9.Create intersection point H of line j and line f using the Intersect
tool.
10. Create the shortest distance between line f and line g using the
Segment tool and create a segment between points G and H.
11.Enhance your construction using the Style Bar.
Functions of two variables
Task 3
Graph the function f(x, y) = sin(x + y) and observe the created
surface by moving a point along the function graph.
1.Enter f(x, y)= sin(x + y) into the Input Bar and hit the Enter key
to define a function f.
2.Create the point A by entering A = (2, 0, 0) into the Input Bar
and hitting the Enter key.
3.Enter Segment(A, (x(A), y(A), f(x(A), y(A)))) into the Input Bar to
create a segment g.
Functions of two variables
Graph the function f(x, y) = sin(x + y) and observe the created
surface by moving a point along the function graph.
4.Create the point B by entering B = (x(A), y(A), f(x(A), y(A))) into
the Input Bar.
5.Exploration: Use the Move tool to change the position of point
A. You can also change the function f by entering another
function: e.g. f(x, y)= sin(x) + sin(y)
6. Enhance your construction using the Style Bar.
Commands
In order to locate
commands faster, click
near the + sign and
then click help button.
Press Help
Click the + sign on any
of the topics you
would like to visualize.
Press Help
Click the subtopic you
would like to visualize.
Choose any one of these depending on
the parameters you have
Press Help
Click the subtopic you
would like to visualize.
Enter object and Vector
Press Help
Sometimes you can
just type the
command and choose
the right command
among the popups.
Type
Choose Here
END
Try as many problems as possible. Practice
GeoGebra by following commands in the
GeoGebra Manual posted earlier. You can also
find many applets and resources on the GeoGebra
website.
Next: .

GeoGebra 10

  • 1.
  • 2.
    Contents  3D GraphicsPerspective  Customizing the 3D Graphics View  Intersection of a Plane and a Line  Distance between two lines  Functions of two variables  Commands
  • 3.
    3D Graphics Perspective The3D Graphics Perspective includes the 3D Graphics View and the Algebra View. By default, the coordinate axes and the xOy-plane are shown in the 3D Graphics View. Furthermore, the 3D Graphics View Toolbar and the Undo / Redo buttons in the top right corner are displayed.
  • 4.
    The 3D GraphicsView Using the construction Tools available in the 3D Graphics View Toolbar you can create geometric constructions in the 3D Graphics View. Geometric Construction 3D Graphics View Toolbar
  • 5.
    The 3D GraphicsView Select any construction Tool from the 3D Graphics View Toolbar and read the appearing Tooltip to find out how to use the selected Tool. Tooltip
  • 6.
    The 3D GraphicsView Note: Any object you create in the 3D Graphics View also has an algebraic representation in the Algebra View. Algebraic representation
  • 7.
    The 3D GraphicsView Example Select the Sphere with Center through Point tool and click twice in the 3D Graphics View. The first click creates the center point while the second click creates a sphere and a point on the sphere. First Click Second Click
  • 8.
    The 3D GraphicsView Task Select the Cube tool from the Toolbox of solids and click twice in the 3D Graphics View to create a cube First Click Second Click
  • 9.
    The 3D GraphicsView Select the Move tool and change the position of the points and the size of the cube by dragging them with the pointer. Hint: By clicking on a point you can switch between moving the point parallel to the x-y-plane or parallel to the z-axis.
  • 10.
    The 3D GraphicsView Open the 3D Graphics View Style Bar by clicking the button in the top right corner. 3D Graphics View Style Bar
  • 11.
    The 3D GraphicsView Adjust the View Direction by clicking on the view tool in the 3D Graphics View Style Bar. Choose the view towards the xOy-plane Click this tool Choose view towards the xOy-plane
  • 12.
    The 3D GraphicsView Rotate the 3D Graphics View back to default view. Click here to return to default view
  • 13.
    The 3D GraphicsView Select the Rotate 3D Graphics View tool and drag the background of the 3D Graphics View with your pointing device. Hint: Alternatively you can right-drag the background of the 3D Graphics View to rotate the coordinate system. Rotate 3D Graphics View tool
  • 14.
    Customizing the 3DGraphics View You can customize the 3D Graphics View according to the mathematical topic you want to work with. The basic setup can be changed using the 3D Graphics View Style Bar (e.g. display of coordinate axes, xOy-plane, grid). Note: In addition, the Settings provide more options to customize the 3D Graphics View. Customize the 3D Graphics View by following the instructions below.
  • 15.
    The 3D GraphicsView Open the 3D Graphics View Style Bar Show the xOy-plane. Hint: Select the first icon of the Style Bar and choose to show the xOy-plane. Explore different views of the object. Start rotating and pause rotating the 3D Graphics View. Rotate back to default view. Hint: You can find that option by selecting the third icon of the Style Bar. Zoom into the coordinate system by using the Zoom In tool and clicking in the 3D Graphics View. Close the 3D Graphics View Style Bar. Rotate the coordinate system by using the Rotate 3D Graphics View tool to drag the background of the 3D Graphics View.
  • 16.
    Intersection of aPlane and a Line Do It Yourself Task 1 Intersect a plane and a line in the 3D Graphics View of GeoGebra to create the intersection point.
  • 17.
    The 3D GraphicsView 1.Enter p: x + y = z into the Input Bar in the Algebra View and hit the Enter key to define a plane p. 2.Create two points A and B by entering A = (3, 4, 3) and B = (-4, -2, -1) into the Input Bar and hitting the Enter key after each input. 3.Select the Line tool from the 3D Graphics Toolbar and click on the points A and B respectively to create the line a through both points.
  • 18.
    The 3D GraphicsView 4.Select the Intersect tool. Then, click on the plane and the line to create the intersection point C. 5.Use the Move tool to change the position of the points A and B. What happens to the intersection point if the line is parallel to the plane, or if both points lie within the plane? Hint: By clicking on a point you can switch between moving the point parallel to the x-y-plane or parallel to the z-axis.
  • 19.
    Distance between twolines Task 2 Find out the shortest distance between two lines. 1. Select the Line tool and create two arbitrary lines f and g. 2.Select the Parallel Line tool and create a parallel line h of g through point A. Create point E on the parallel line h using the Point on Object tool. 3.Create a plane a through the points A, B and E using the Plane through 3 Points tool. 4.Create a point F on line f using the Point on Object tool. 5.Create a perpendicular line i to plane a through point F using the Perpendicular Line tool.
  • 20.
    Distance between twolines 6.Create a plane b through line i and line f using the Plane tool. 7. Create intersection point G of line g and plane b using the Intersect tool. 8.Create perpendicular line j to plane a through point G using the Perpendicular Line tool. 9.Create intersection point H of line j and line f using the Intersect tool. 10. Create the shortest distance between line f and line g using the Segment tool and create a segment between points G and H. 11.Enhance your construction using the Style Bar.
  • 21.
    Functions of twovariables Task 3 Graph the function f(x, y) = sin(x + y) and observe the created surface by moving a point along the function graph. 1.Enter f(x, y)= sin(x + y) into the Input Bar and hit the Enter key to define a function f. 2.Create the point A by entering A = (2, 0, 0) into the Input Bar and hitting the Enter key. 3.Enter Segment(A, (x(A), y(A), f(x(A), y(A)))) into the Input Bar to create a segment g.
  • 22.
    Functions of twovariables Graph the function f(x, y) = sin(x + y) and observe the created surface by moving a point along the function graph. 4.Create the point B by entering B = (x(A), y(A), f(x(A), y(A))) into the Input Bar. 5.Exploration: Use the Move tool to change the position of point A. You can also change the function f by entering another function: e.g. f(x, y)= sin(x) + sin(y) 6. Enhance your construction using the Style Bar.
  • 23.
    Commands In order tolocate commands faster, click near the + sign and then click help button.
  • 24.
    Press Help Click the+ sign on any of the topics you would like to visualize.
  • 25.
    Press Help Click thesubtopic you would like to visualize. Choose any one of these depending on the parameters you have
  • 26.
    Press Help Click thesubtopic you would like to visualize. Enter object and Vector
  • 27.
    Press Help Sometimes youcan just type the command and choose the right command among the popups. Type Choose Here
  • 28.
    END Try as manyproblems as possible. Practice GeoGebra by following commands in the GeoGebra Manual posted earlier. You can also find many applets and resources on the GeoGebra website. Next: .