The document discusses deriving the sine function and tracing trigonometric functions in GeoGebra. It provides steps to create an applet that graphs the sine function and its derivative by tracing the slope of tangents. Additionally, it describes how to construct a circle, point, and arc in GeoGebra that will trace the sine and cosine functions as another point is moved along the circle. The steps change the x-axis to radians and activate tracing to observe the paths of the points tracing sine and cosine.


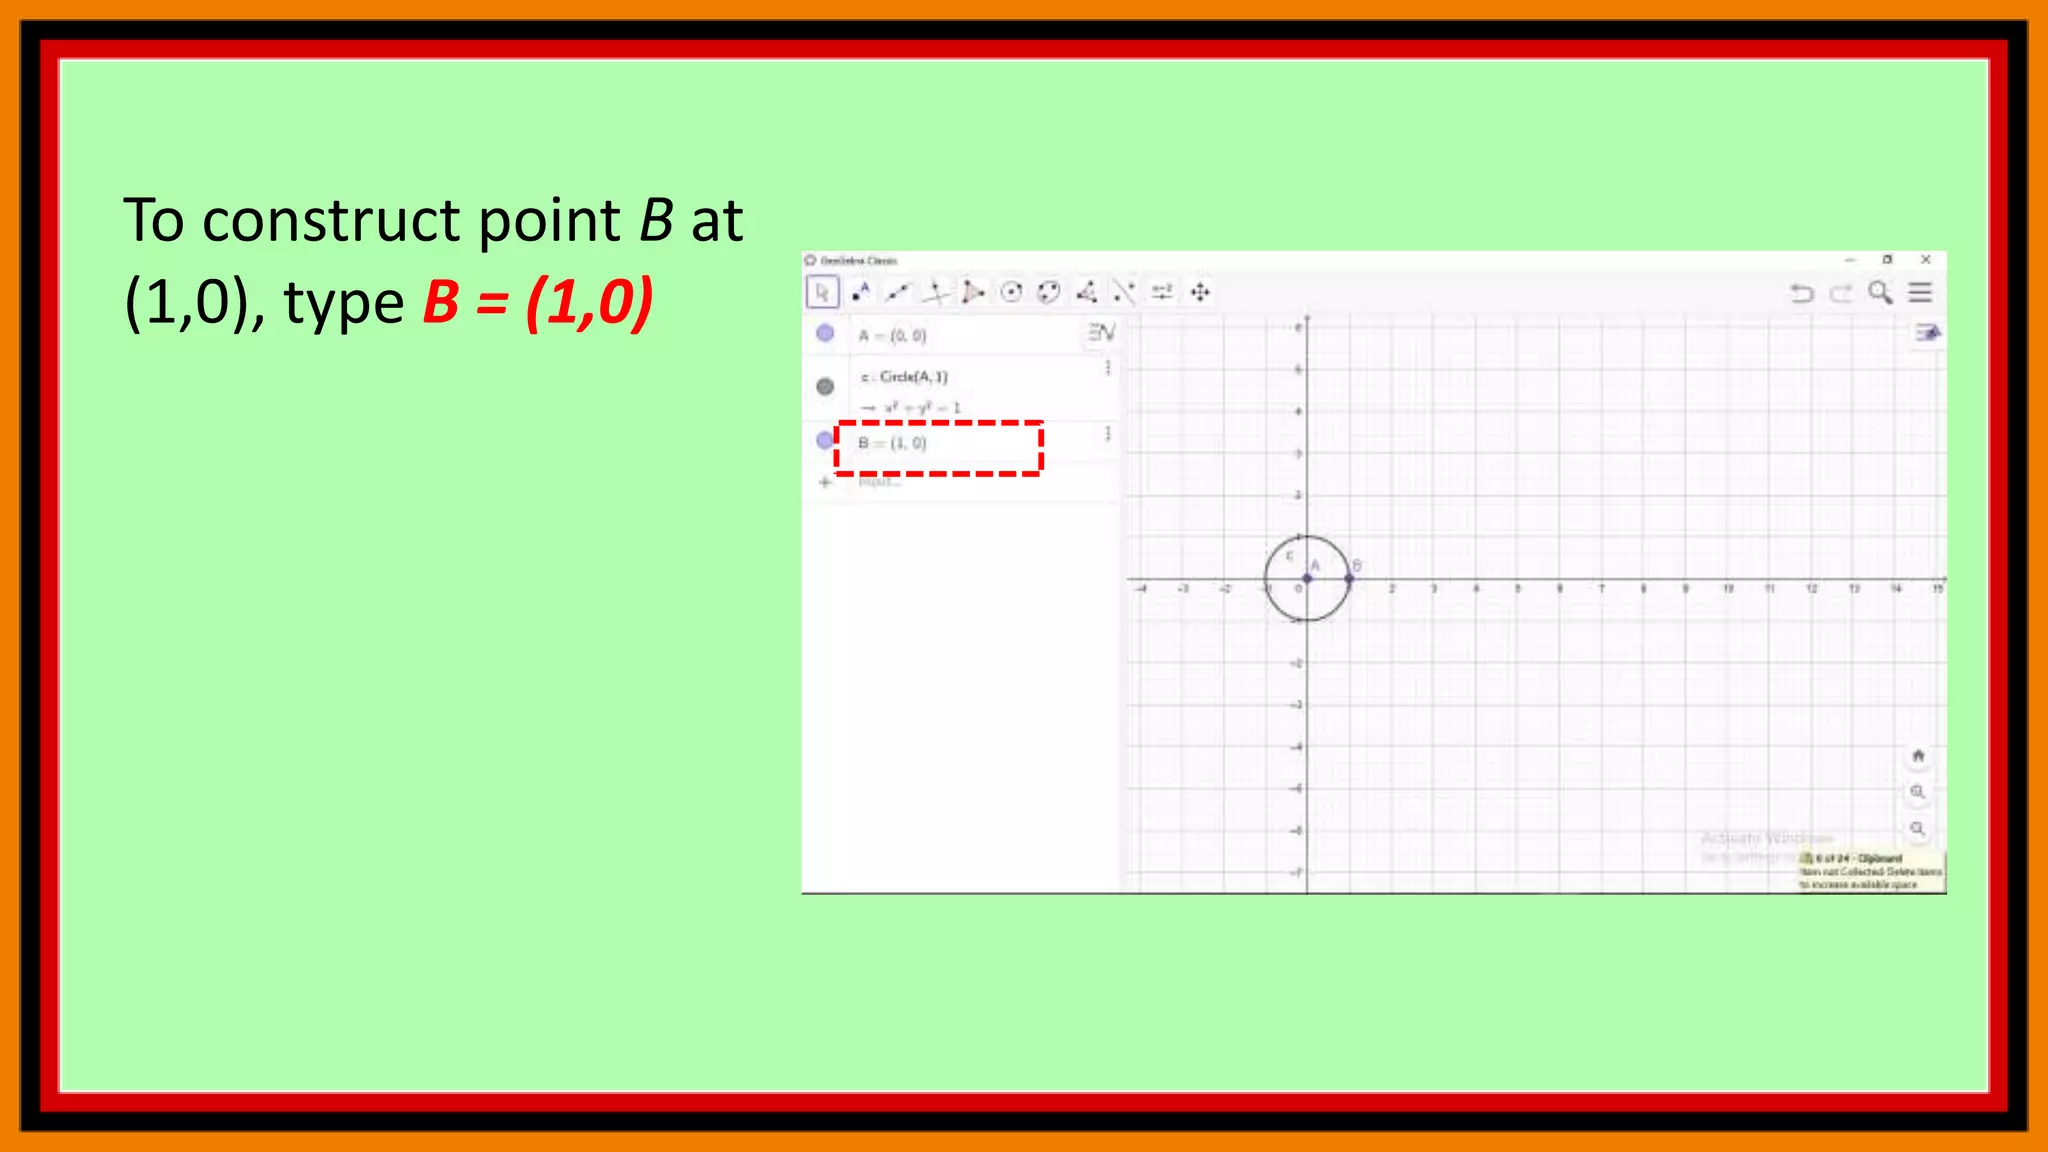
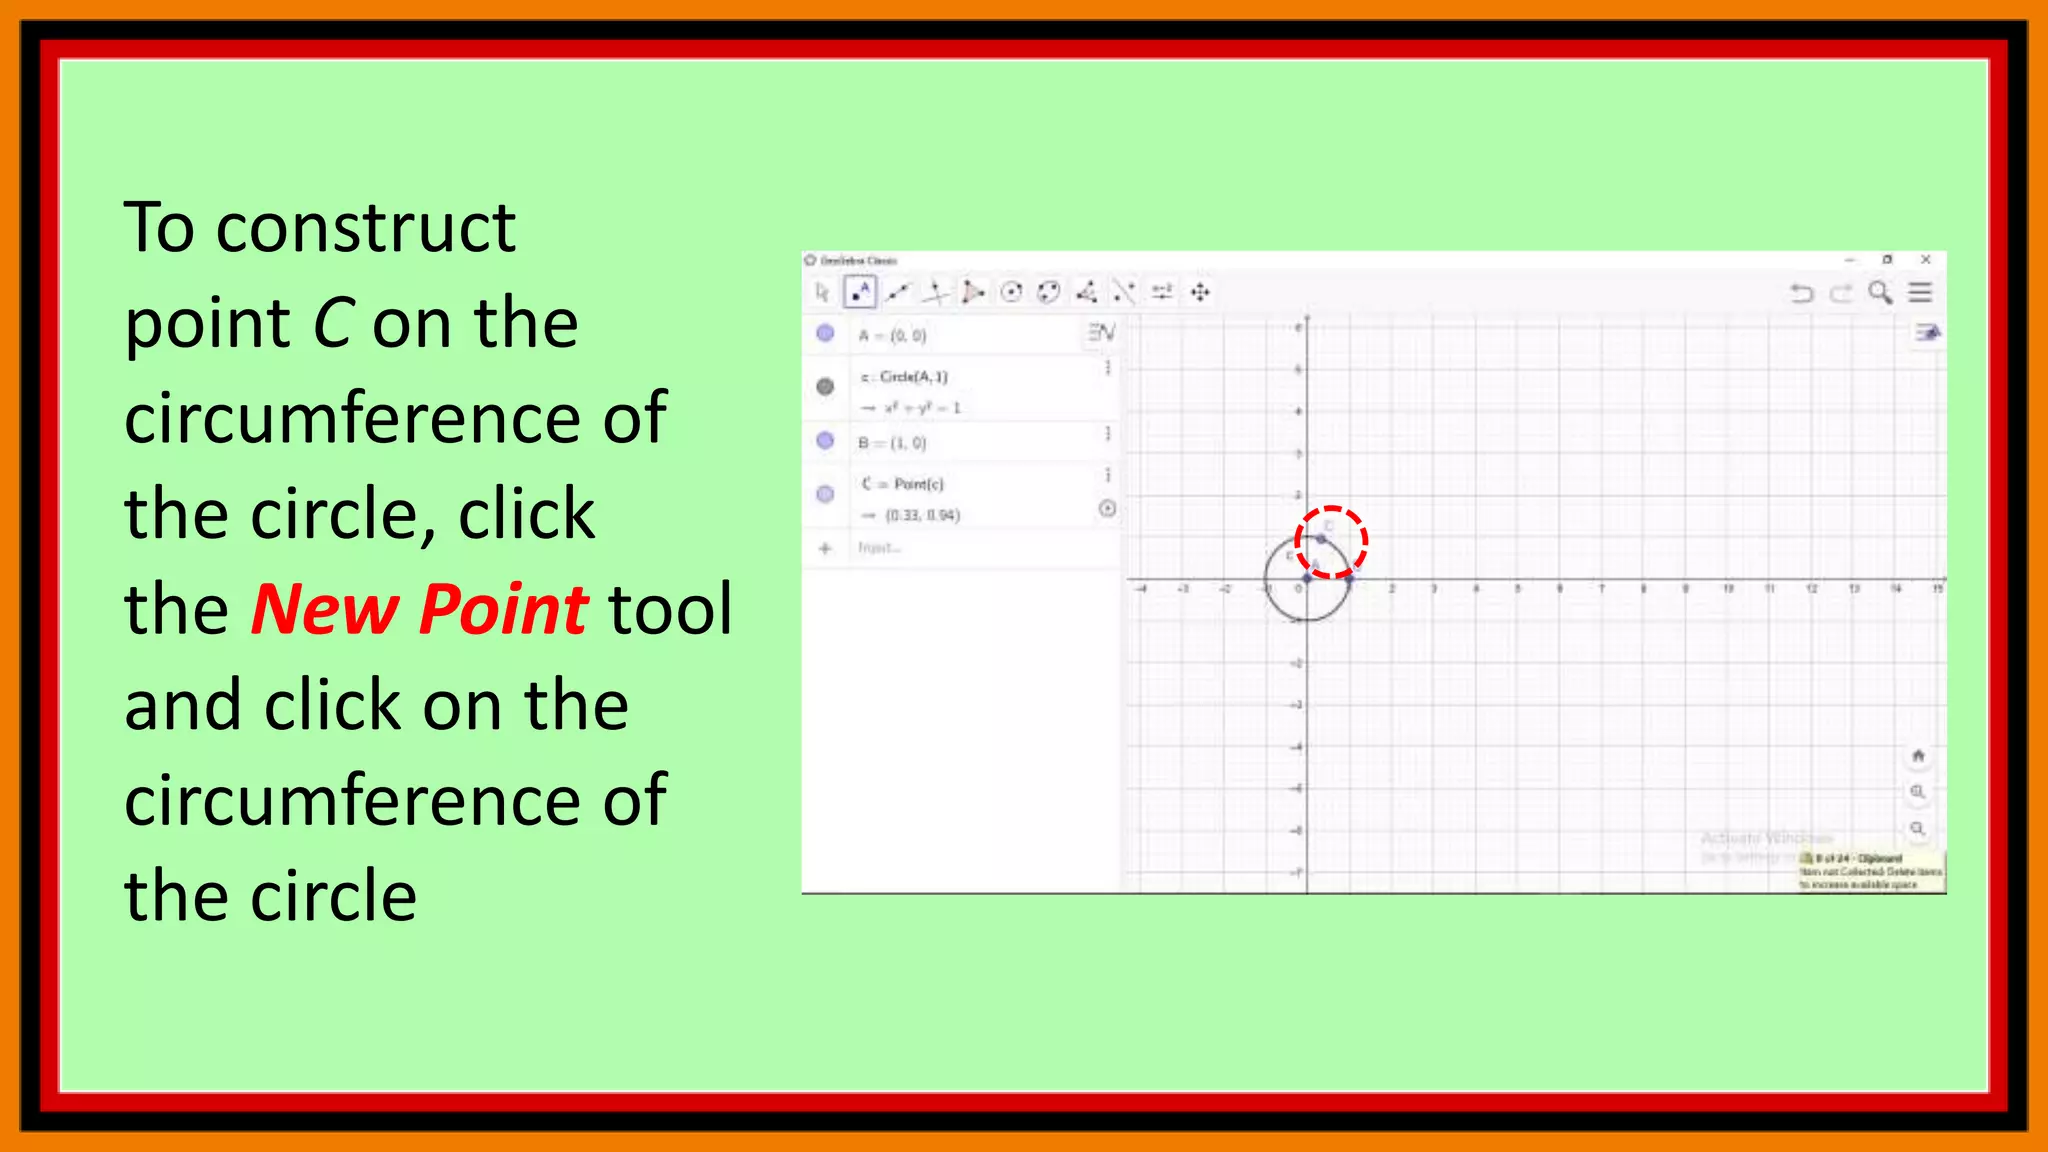
![Next, to construct a
circle with
center A and radius 1,
type circle[A,1] in
the Input Bar and
press the ENTER key
on your keyboard](https://image.slidesharecdn.com/geogebra5-210425141942/75/Geogebra-5-17-2048.jpg)


![Now we create
arc BC of circle with
center A starting
from B and going
counterclockwise
to C. To do this, type
circularArc[A, B, C]](https://image.slidesharecdn.com/geogebra5-210425141942/75/Geogebra-5-26-2048.jpg)