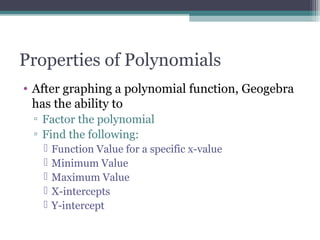
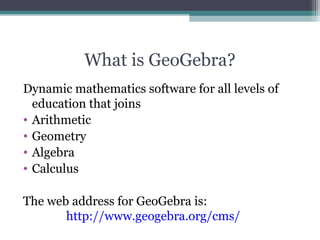
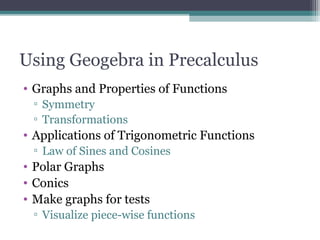
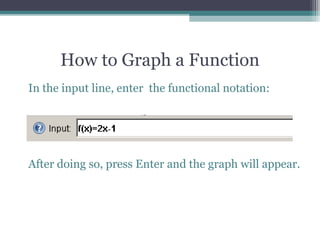
GeoGebra
Precalculus
Dr. Christine Brady and Vera Hu-Hyneman
Suffolk County Community College
What is GeoGebra?
Dynamic mathematics software for all levels of
education that joins
• Arithmetic
• Geometry
• Algebra
• Calculus
The web address for GeoGebra is:
http://www.geogebra.org/cms/
The page
Reference Websites
• Math 247 --tutorial for teachers
• Wiki --information about GeoGebra (it is written
in java, so program is available for multiple
platforms), use to learn geometry and more.
http://en.wikipedia.org/wiki/GeoGebra
Using Geogebra in Precalculus
• Graphs and Properties of Functions
▫ Symmetry
▫ Transformations
• Applications of Trigonometric Functions
▫ Law of Sines and Cosines
• Polar Graphs
• Conics
• Make graphs for tests
▫ Visualize piece-wise functions
How to Graph a Function
In the input line, enter the functional notation:
After doing so, press Enter and the graph will appear.
Restricted Domain
• To graph a function over the interval [a,b], use
the FUNCTION command.
• The syntax for the FUNCTION command is:
▫ Function[Function, a, b]
Piecewise-defined Functions
Graphing piecewise-defined functions
• Graph each piece separately over the indicated
domain (x-values)
• Plug in the endpoints of the indicated domain
for each piece to begin graphing
▫ If the endpoint is included then use a closed circle
▫ If the endpoint is not included then use an open
circle.
Example
• Graph:
2
2 -7 < x -1
( ) 1 -1 < x < 2
1
5 2 x 6
2
f x x
x

− ≤

= −

− + ≤ ≤

How to Plot Points
▫ Use the Point Tool
 This button is located on the toolbar.
 To create a point, click on the above button and then
the desired coordinates.
 By default the point will be solid.
 Characteristics of the point can be changed by going
to Object Properties,
Properties of Polynomials
• After graphing a polynomial function, Geogebra
has the ability to
▫ Factor the polynomial
▫ Find the following:
 Function Value for a specific x-value
 Minimum Value
 Maximum Value
 X-intercepts
 Y-intercept
Symmetry
Transformations
Applications of Trig
Rational
Polar Graphs
Conics

GeoGebra Talk - A basic introduction

  • 1.
    GeoGebra Precalculus Dr. Christine Bradyand Vera Hu-Hyneman Suffolk County Community College
  • 2.
    What is GeoGebra? Dynamicmathematics software for all levels of education that joins • Arithmetic • Geometry • Algebra • Calculus The web address for GeoGebra is: http://www.geogebra.org/cms/
  • 3.
  • 4.
    Reference Websites • Math247 --tutorial for teachers • Wiki --information about GeoGebra (it is written in java, so program is available for multiple platforms), use to learn geometry and more. http://en.wikipedia.org/wiki/GeoGebra
  • 5.
    Using Geogebra inPrecalculus • Graphs and Properties of Functions ▫ Symmetry ▫ Transformations • Applications of Trigonometric Functions ▫ Law of Sines and Cosines • Polar Graphs • Conics • Make graphs for tests ▫ Visualize piece-wise functions
  • 6.
    How to Grapha Function In the input line, enter the functional notation: After doing so, press Enter and the graph will appear.
  • 7.
    Restricted Domain • Tograph a function over the interval [a,b], use the FUNCTION command. • The syntax for the FUNCTION command is: ▫ Function[Function, a, b]
  • 8.
  • 9.
    Graphing piecewise-defined functions •Graph each piece separately over the indicated domain (x-values) • Plug in the endpoints of the indicated domain for each piece to begin graphing ▫ If the endpoint is included then use a closed circle ▫ If the endpoint is not included then use an open circle.
  • 10.
    Example • Graph: 2 2 -7< x -1 ( ) 1 -1 < x < 2 1 5 2 x 6 2 f x x x  − ≤  = −  − + ≤ ≤ 
  • 11.
    How to PlotPoints ▫ Use the Point Tool  This button is located on the toolbar.  To create a point, click on the above button and then the desired coordinates.  By default the point will be solid.  Characteristics of the point can be changed by going to Object Properties,
  • 12.
    Properties of Polynomials •After graphing a polynomial function, Geogebra has the ability to ▫ Factor the polynomial ▫ Find the following:  Function Value for a specific x-value  Minimum Value  Maximum Value  X-intercepts  Y-intercept
  • 13.
  • 14.
  • 15.
  • 16.
  • 17.
  • 18.

Editor's Notes

  • #6 Functions – Linear, Quadratic, Polynomials, Exponential, Logarithms, Trigonometric, inverse functions, Properties – max, min, zeros, intercepts, domain, range, increasing, decreasing,
  • #7 Sample .ggb
  • #8 This can be used to graph piece-wise functions.
  • #11 Open Piecewise.ggb Note: Geogebra has a built in command for graphing two functions given a specific condition. This is done using the IF command. This can be found in the HELP. Also show Exam1.ggb
  • #15 Use the Piecewise.ggb example. Color, size, style, name, value, shape
  • #16 Open Polynomial.ggb Modify Axis: Click on MOVE and drag on axis to change scale. To find function value: f( #) To factor: Use Factor [f] . However if it is unfactorable it will return the original function. To find X-int: Use Root command Root [f] or Use Intercept Two Objects Button To find Y-int: Use Intercept Two Objects Button (Click on both) To find max &amp; min use the Extremum command. Extremum[f] Also talk about the relationship between zeros and multiplicity, End behavior