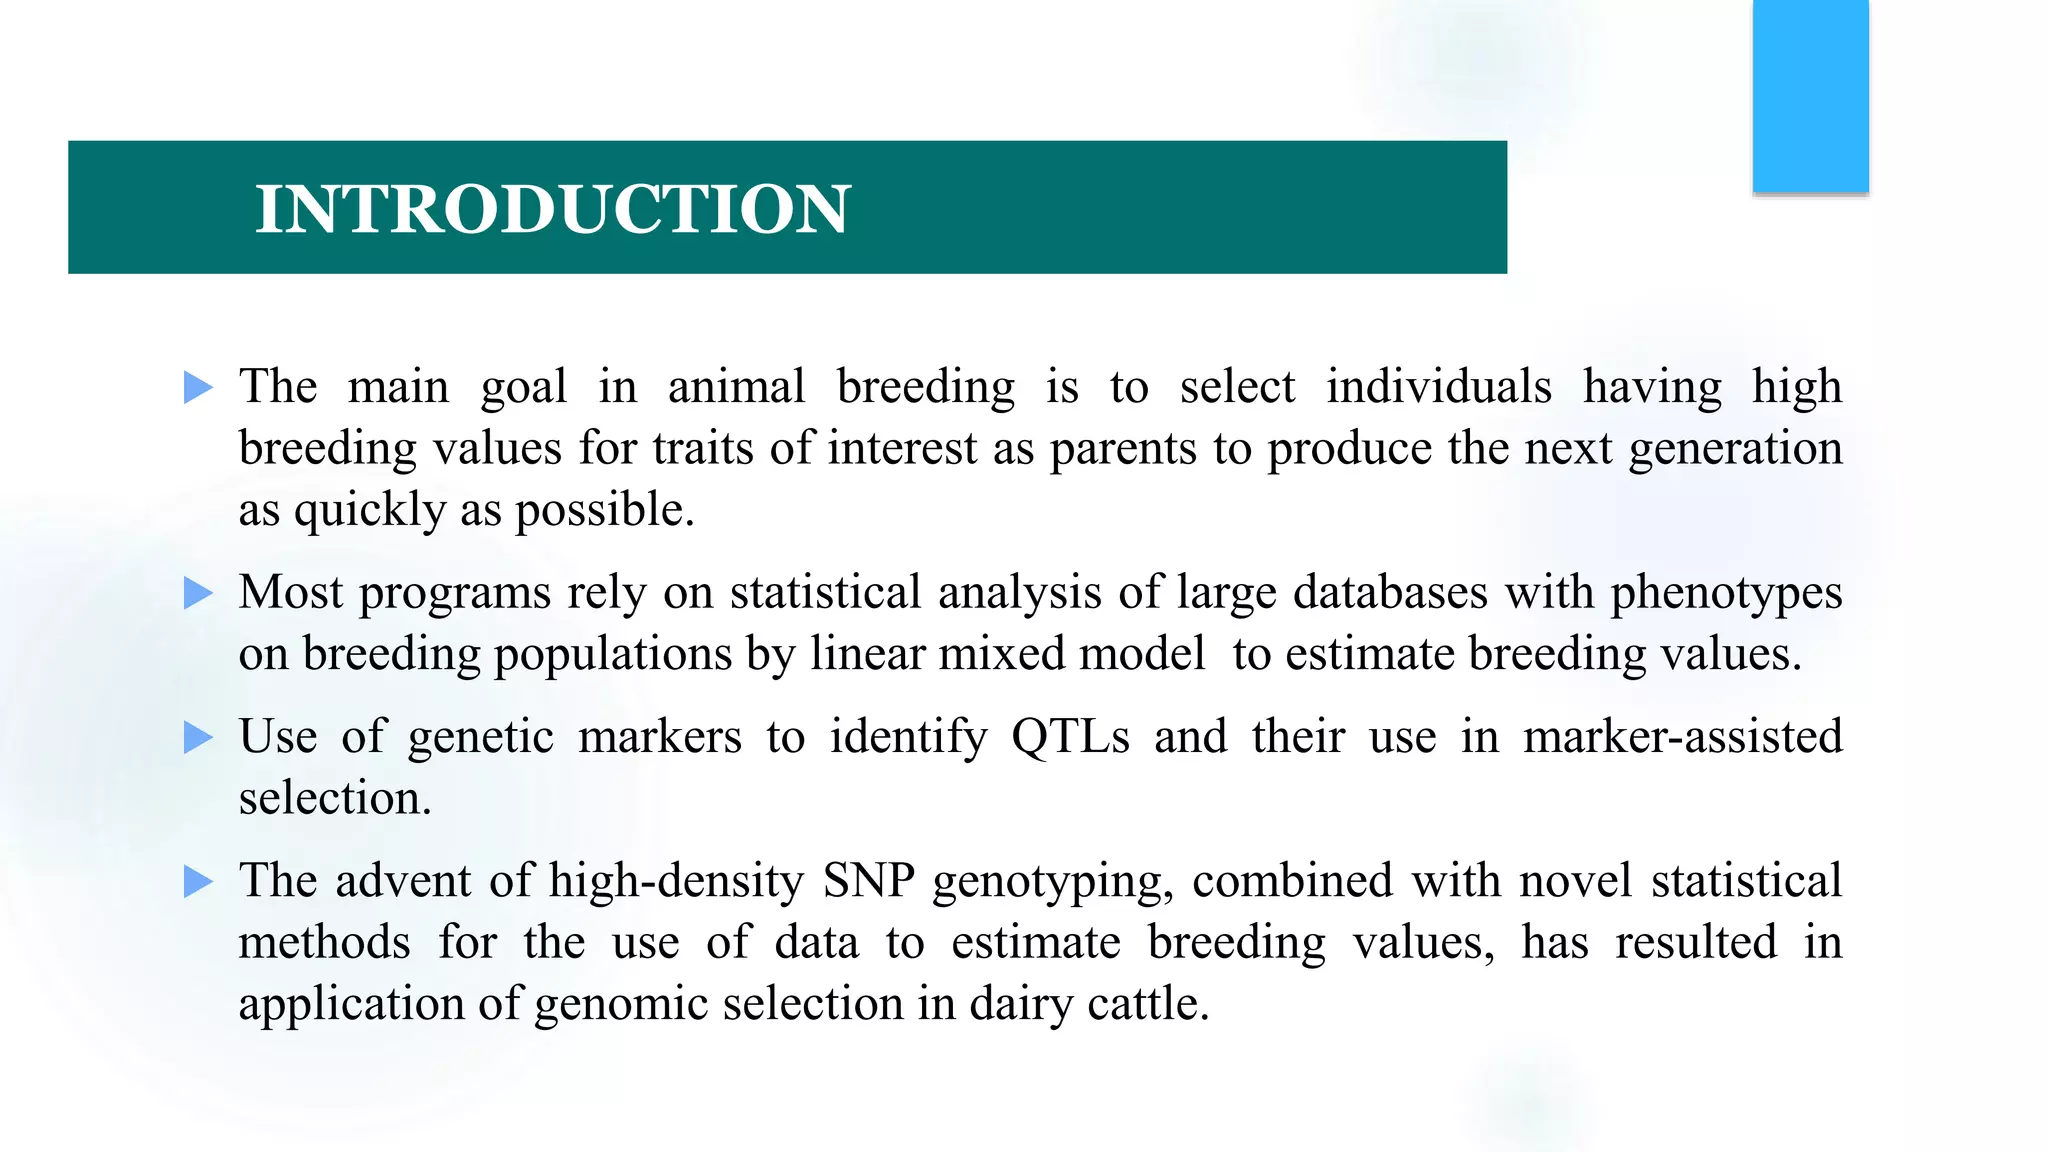
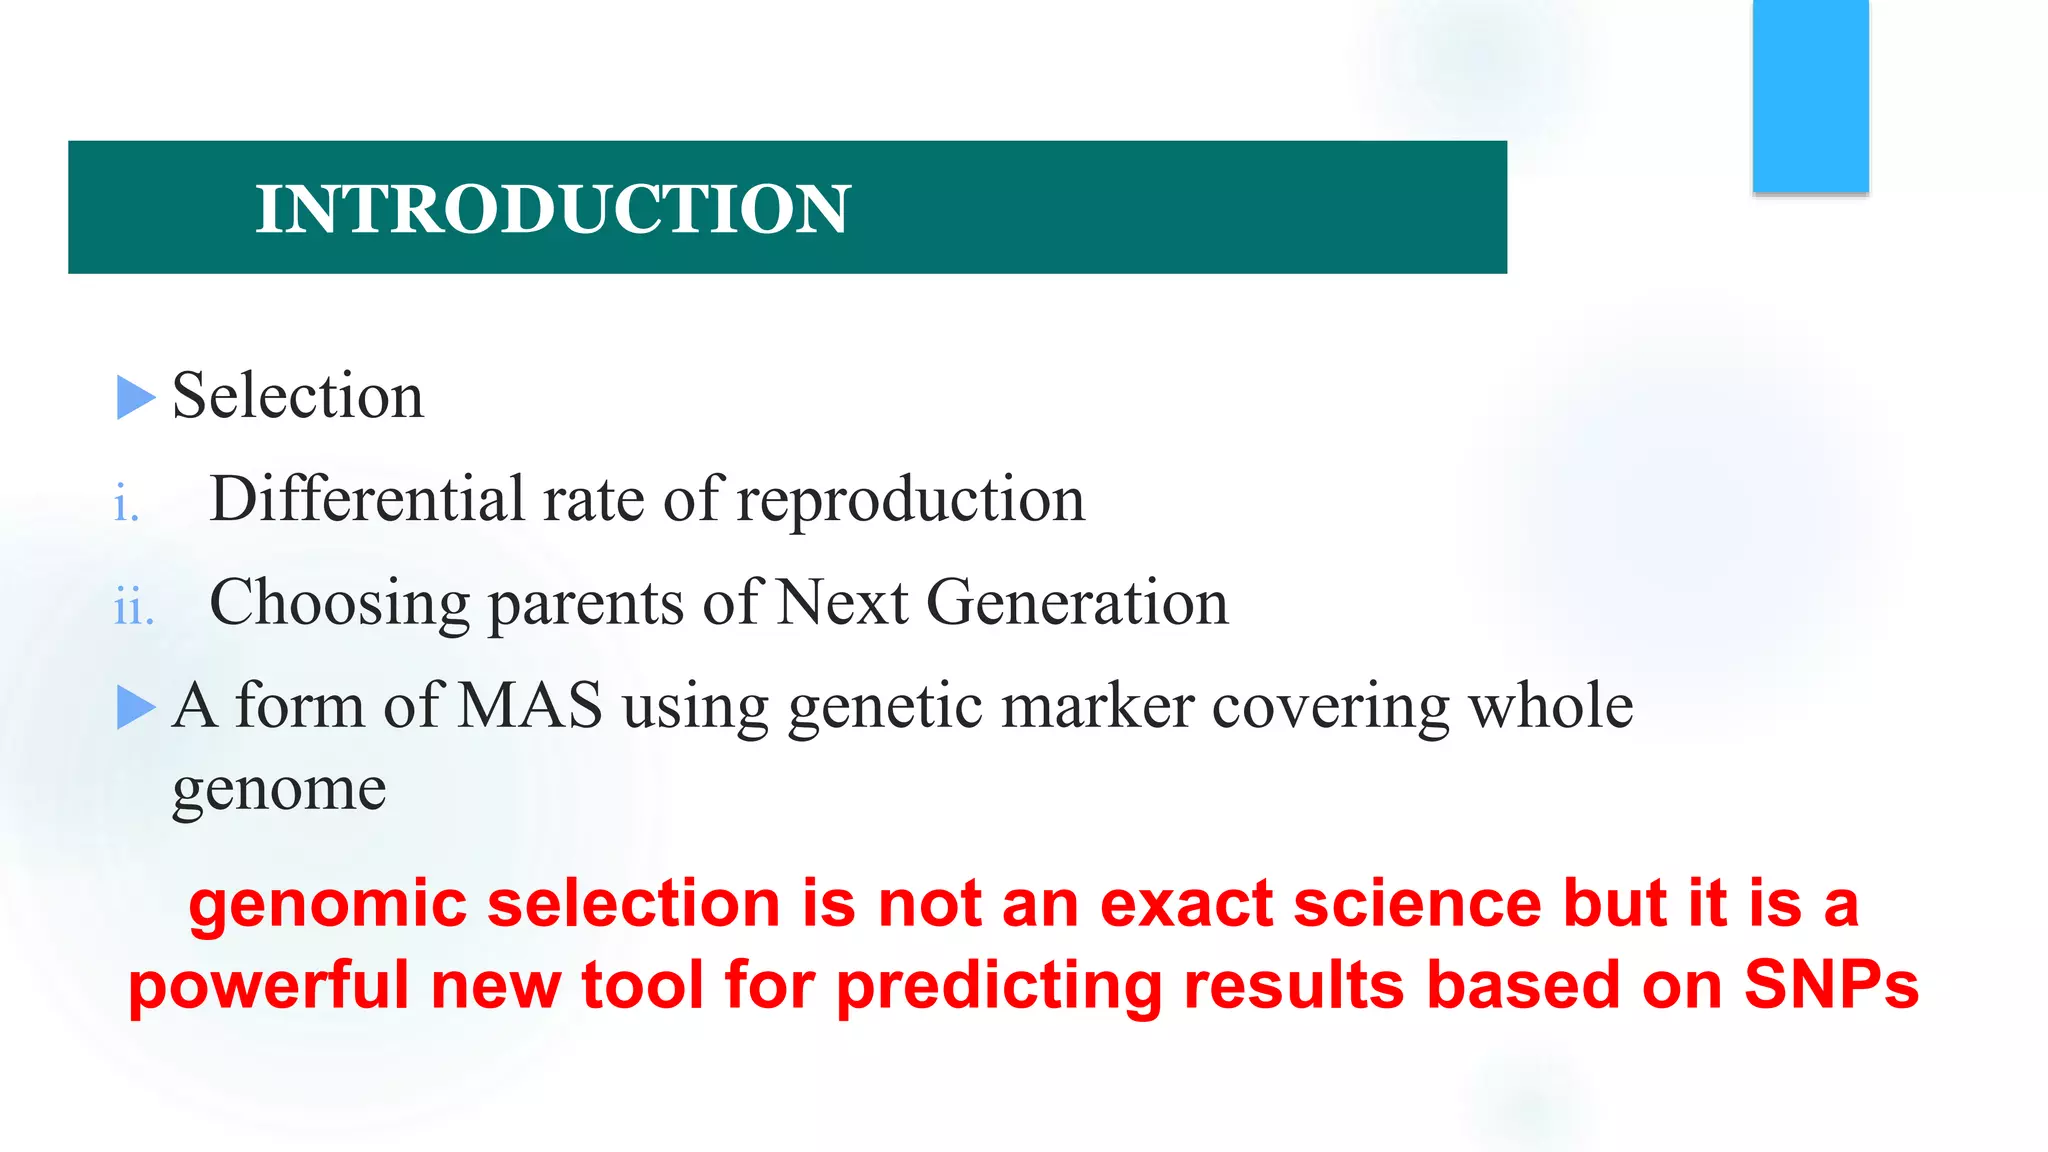
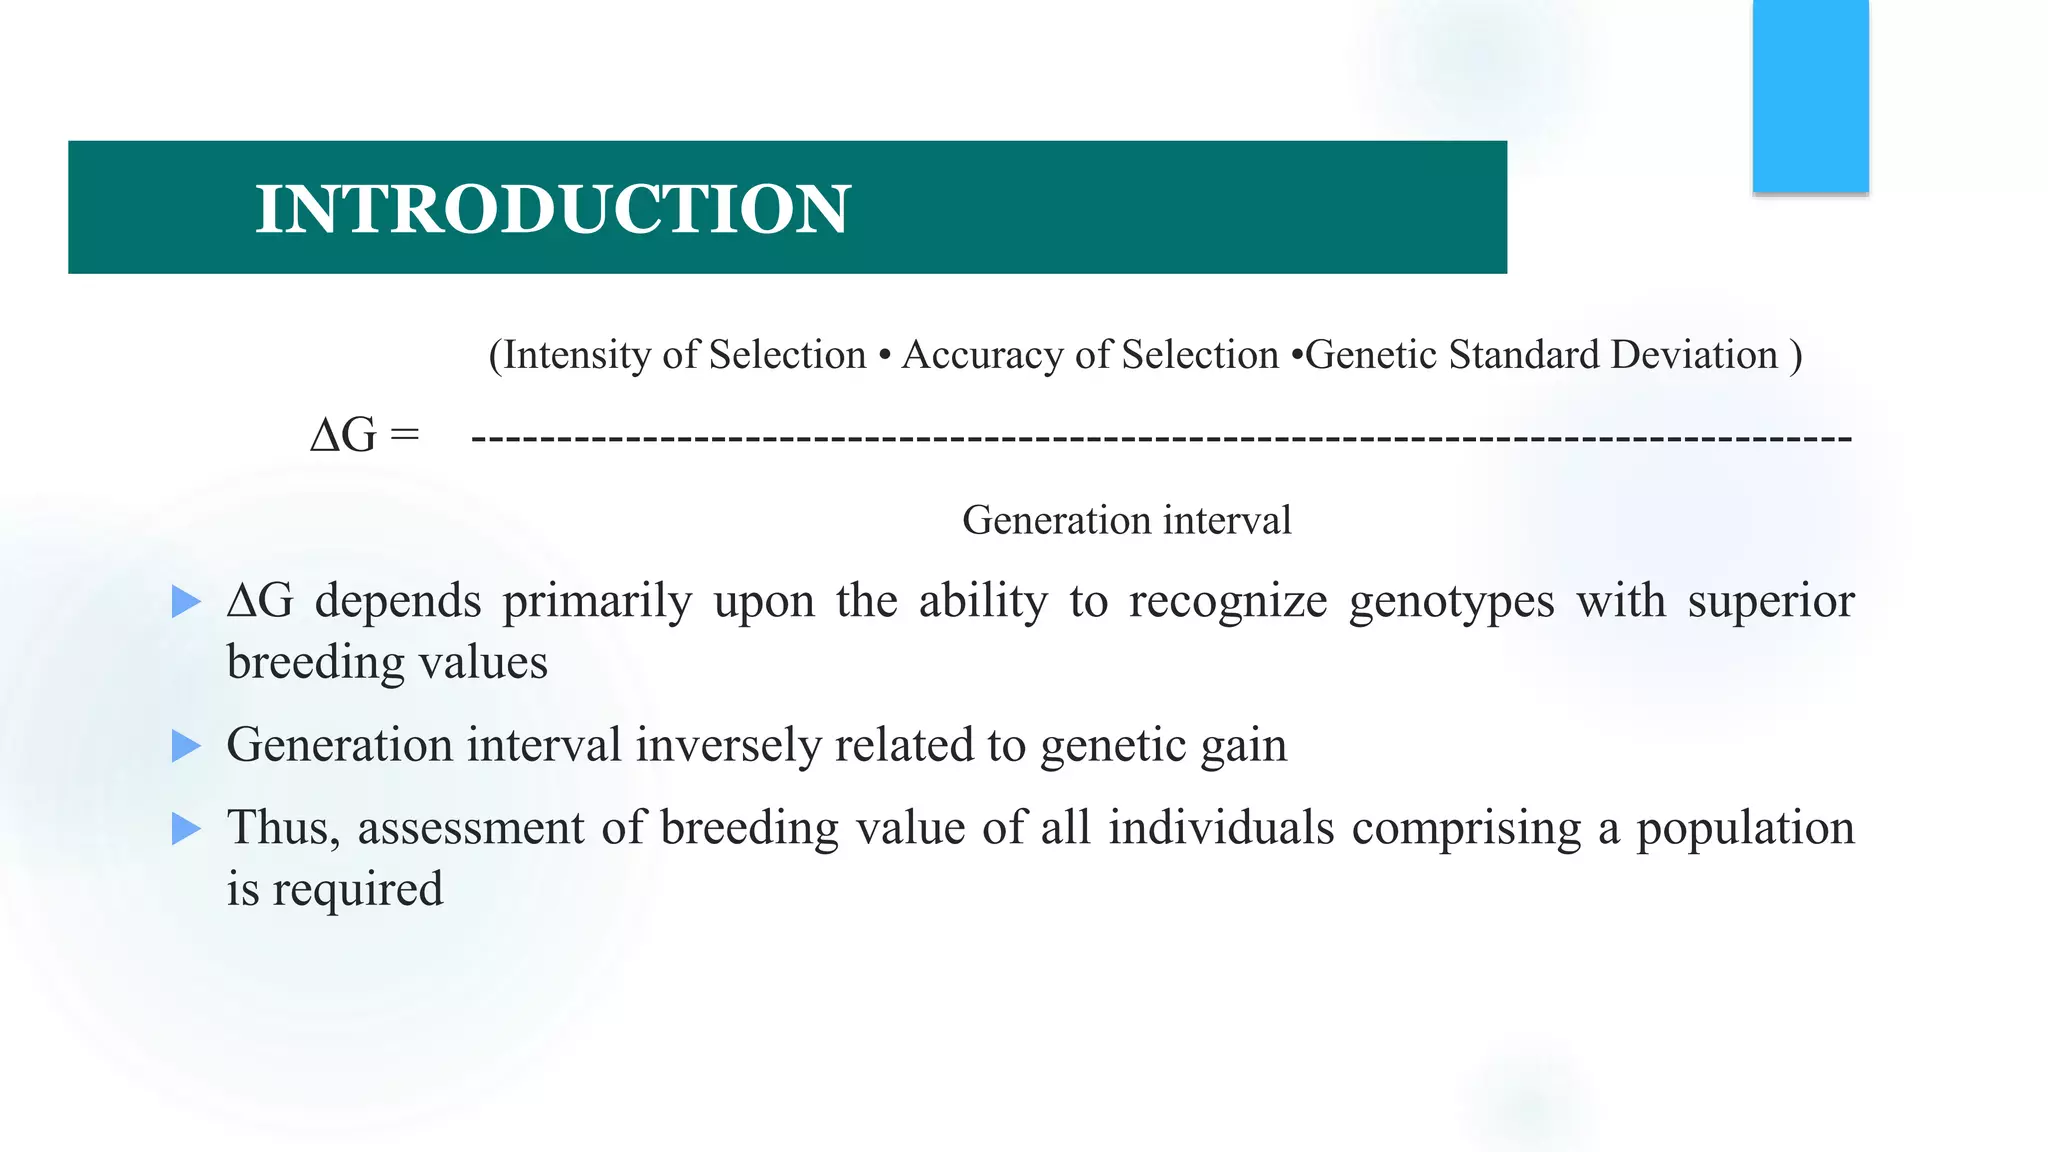
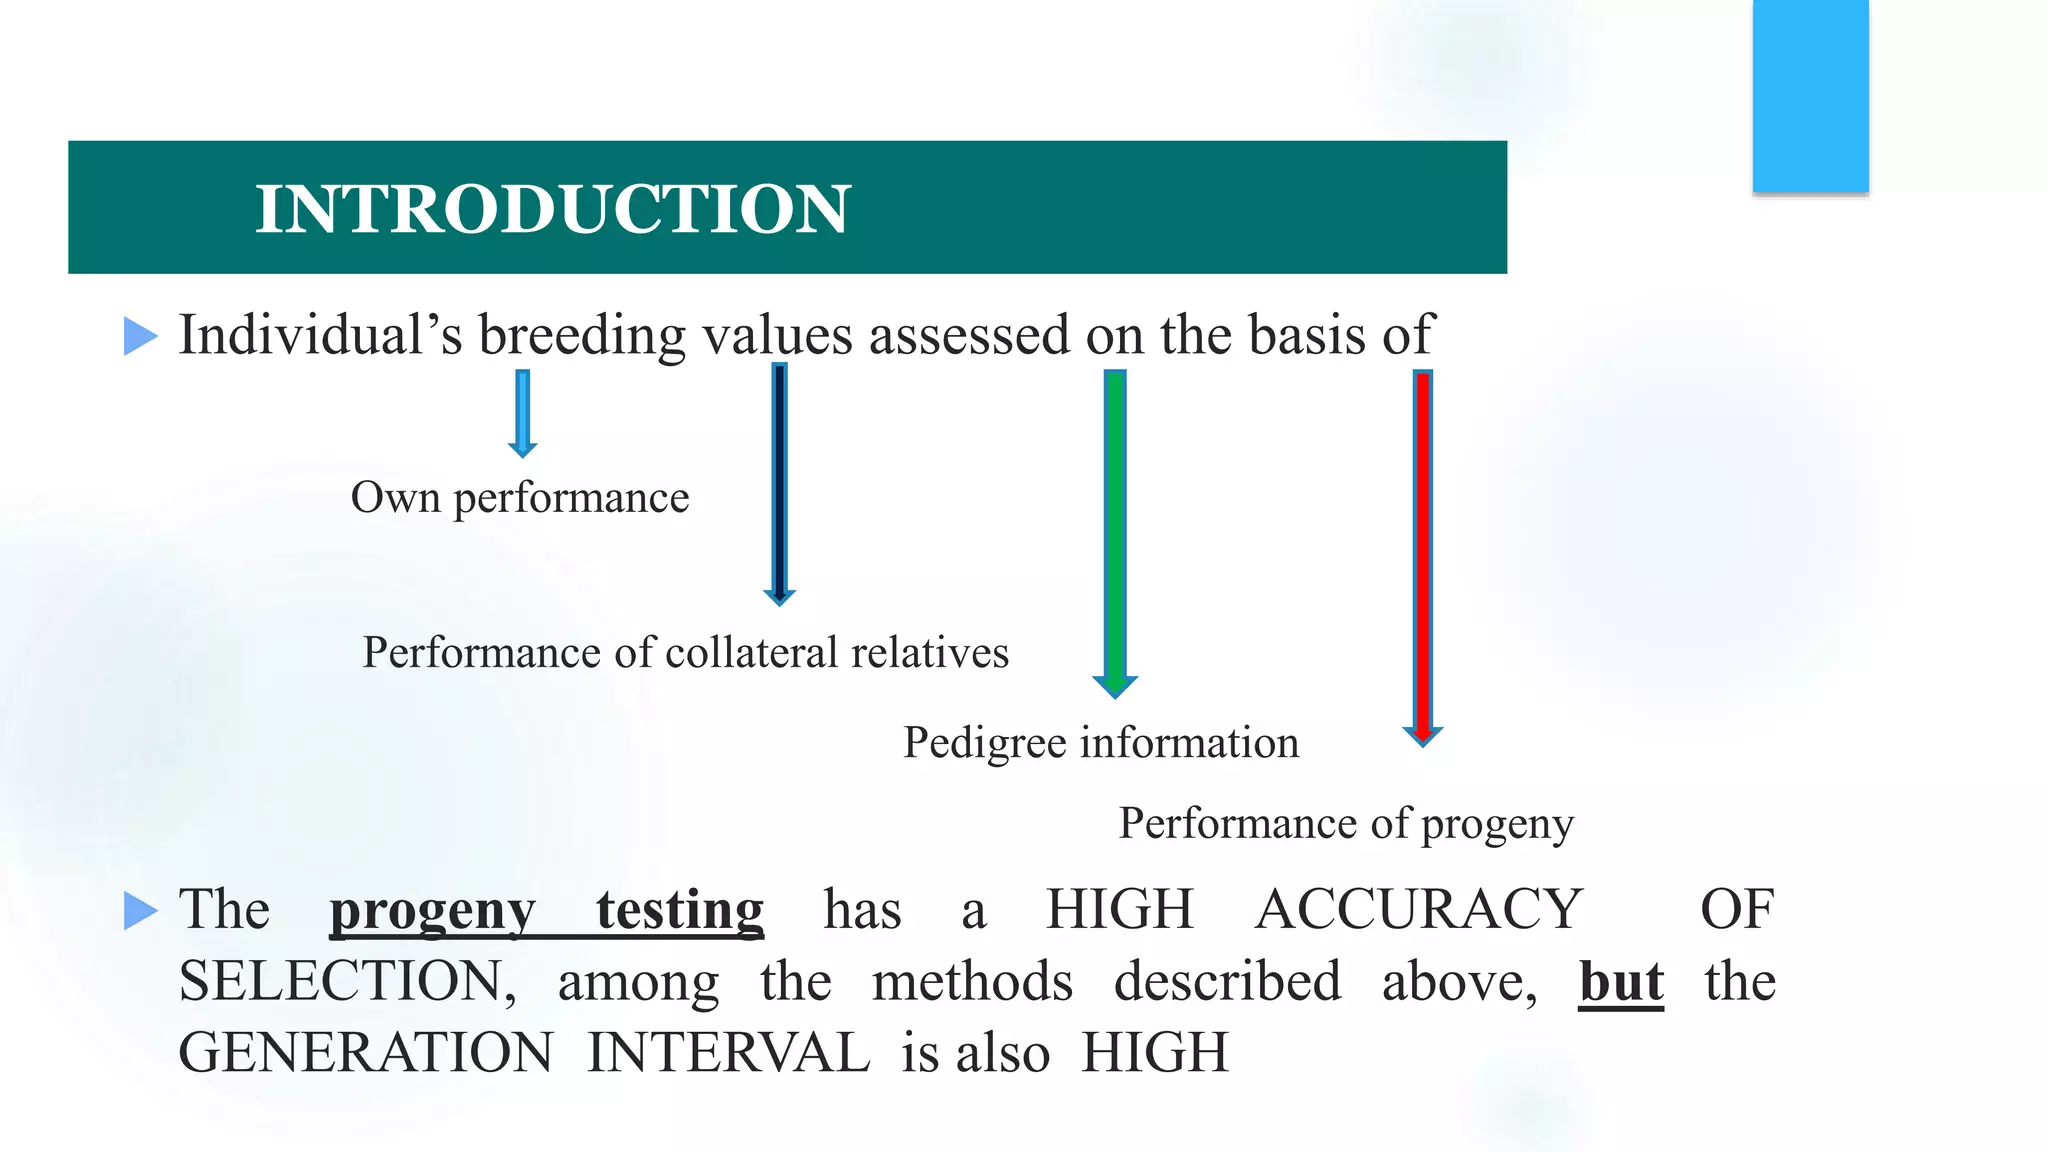
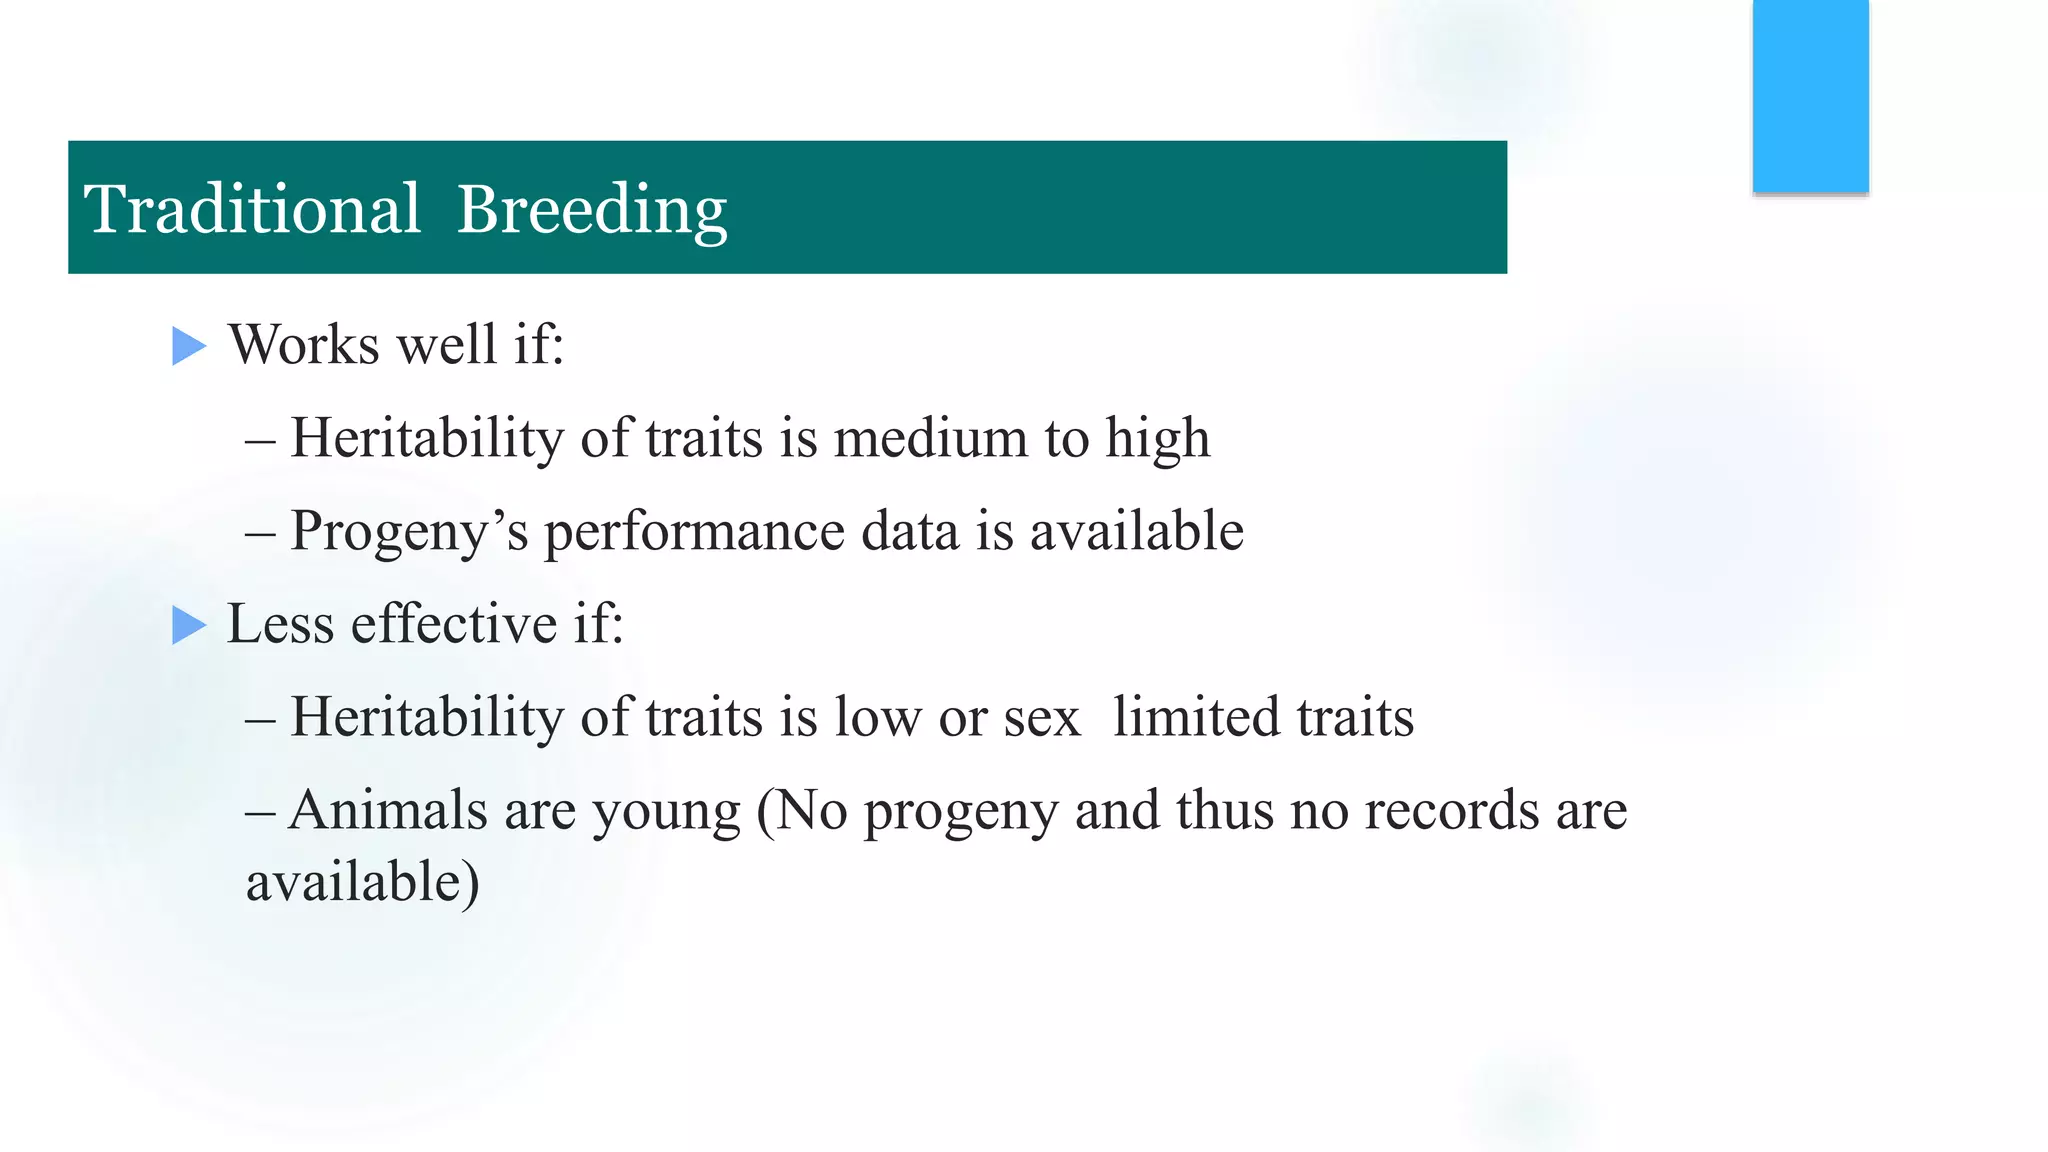
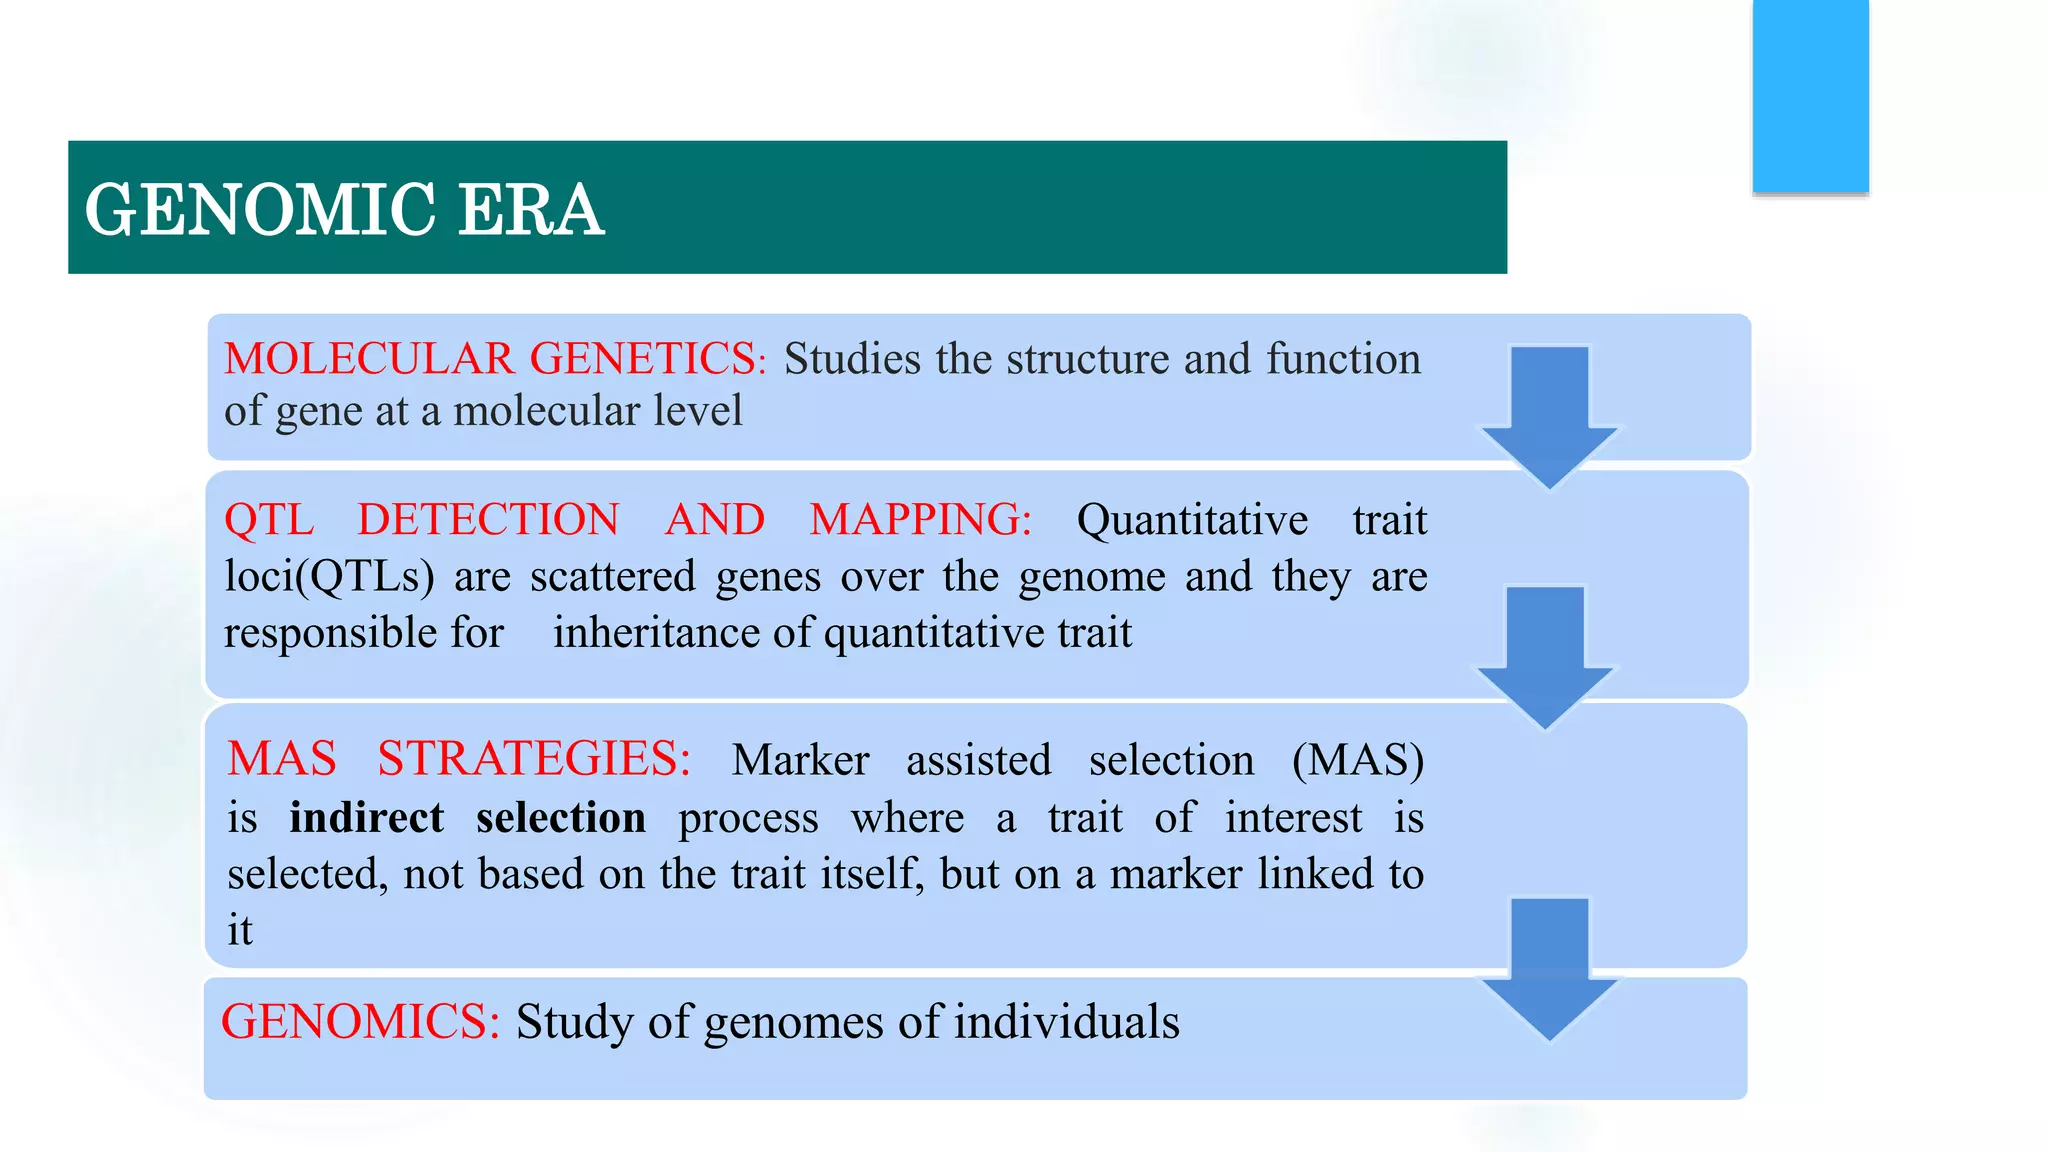
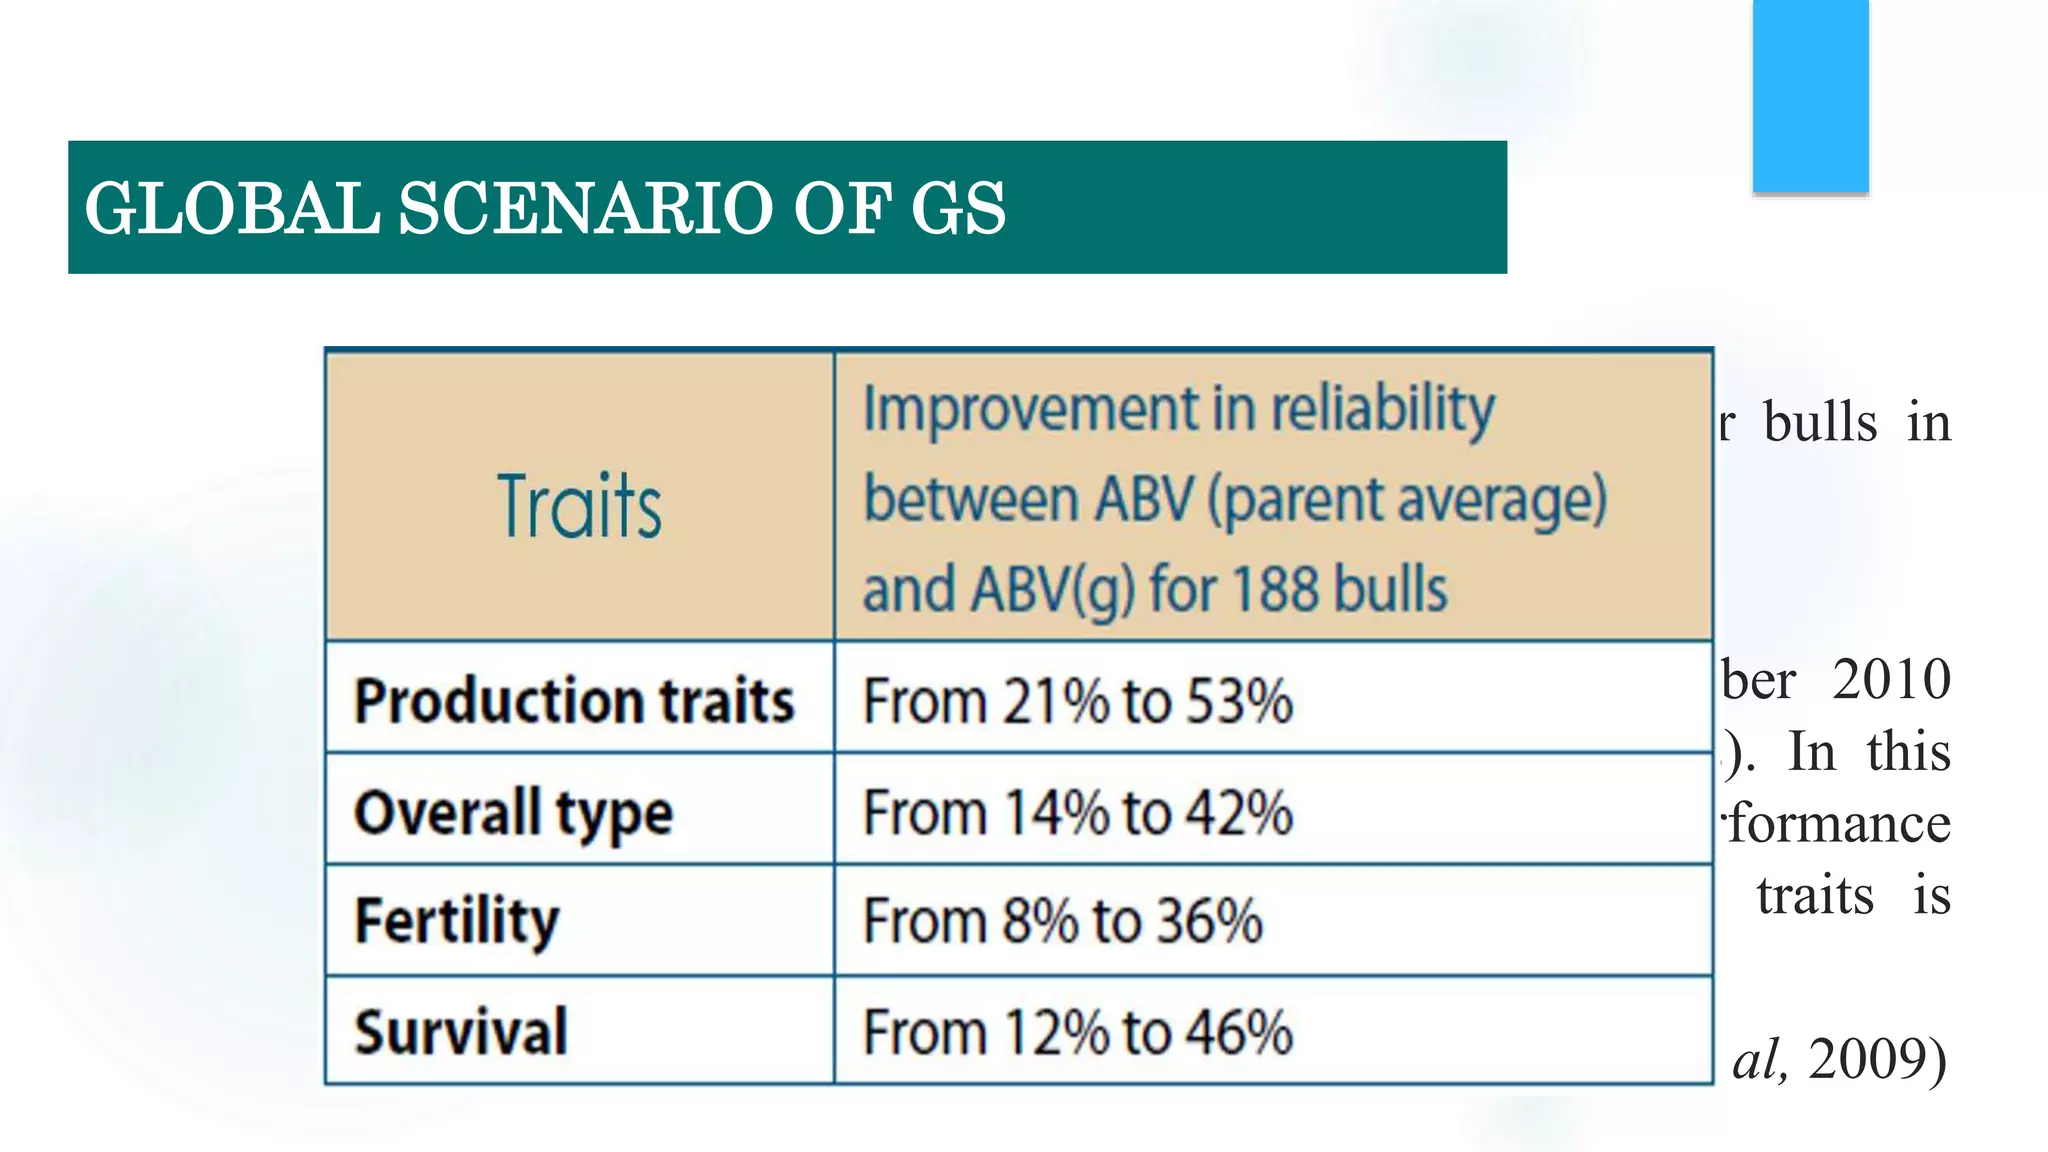
Potential for genomic selection in indigenous cattle breeds and results of GWAS in Gir dairy cattle of Gujrat by Dr.Pravin Kandhani and Dr. Vijay Trivedi KAMDHENU UNIVERSITY GANDHINAGAR
The present study was conducted with the aim of reducing the cost of implementing Genomic Selection(GS) by using Genotype imputation methodology in Gir cattle. Application of GS mainly depends upon the cost of genotyping and reduce its cost, imputation approaches have been used. Imputation strategies and GS have been comprehensively studied in several taurine dairy cattle populations but very limited information is available on indigenous populations. Factors that affect the efficiency of imputation and GS are population structure, linkage disequilibrium between markers and differing marker density between indigenous and taurine breeds. The objective of the study was to evaluate the performance of INDUSCHIP-1, a customized Illumina bovine microarray chip for indigenous cattle breeds, designed by National Dairy Development Board, Anand and design one (7-15K) LD panel, and evaluate the performance of two panels of INDUSCHIP-1, and a 13K subset of the same for its imputation accuracy to HD (777K or INDUSCHIP-1 level). Thus, the study was planned with the aim to design LD panel for genotype imputation to INDUSCHIP-1 level with the strategy to maximize the accuracy of imputation in Gir cattle.
Genomic selection changing Breeding programe around the world, talk consist of concept of Breeding, breeding value, Genomic breeding value, Genotype imputation, male calf procurement on basis of GEBV under SAG PT Project and 1000 bull genome project.
Genomic aided selection for crop improvementtanvic2
In last Several years novel genetic and genomics approaches are expended. Genetics and genomics have greatly enhanced our understanding of the structural and functional aspects of plant genomes.
Presentation delivered by Dr. Jesse Poland (Kansas State University, USA) at Borlaug Summit on Wheat for Food Security. March 25 - 28, 2014, Ciudad Obregon, Mexico.
http://www.borlaug100.org
Genomic selection in small holder systems: Challenges and opportunitiesILRI
Presented by Raphael Mrode, Julie Ojango and Okeyo Mwai at the Workshop on Animal Genetic Research for Africa (Biosciences for Farming in Africa), Nairobi, 10-11 September 2015
Introduction:
Proposed by Meuwissen et al. (2001)
GS is a specialized form of MAS, in which information from genotype data on marker alleles covering the entire genome forms the basis of selection.
The effects associated with all the marker loci, irrespective of whether the effects are significant or not, covering the entire genome are estimated.
The marker effect estimates are used to calculate the genomic estimated breeding values (GEBVs) of different individuals/lines, which form the basis of selection.
Why to go for genomic selection:
Marker-assisted selection (MAS) is well-suited for handling oligogenes and quantitative trait loci (QTLs) with large effects but not for minor QTLs.
MARS attempts to take into account small effect QTLs by combining trait phenotype data with marker genotype data into a combined selection index.
Based on markers showing significant association with the trait(s) and for this reason has been criticized as inefficient
The genomic selection (GS) scheme was to rectify the deficiency of MAS and MARS schemes. The GS scheme utilizes information from genome-wide marker data whether or not their associations with the concerned trait(s) are significant.
GEBV: GenomicEstimated Breeding Values-
The sum total of effects associated with all the marker alleles present in the individual and included in the GS model applied to the population under selection
Calculated on a single individual basis
Gene-assisted genomic selection:
A GS model that uses information about prior known QTLs, the targeted QTLs were accumulated in much higher frequencies than when the standard ridge regression was used
The sum total of effects associated with all the marker alleles present in the individual and included in the GS model applied to the population under selection
Calculated on a single individual basis
Population used:
Training population: used for training of the GS model and for obtaining estimates of the marker-associated effects needed for estimation of GEBVs of individuals/lines in the breeding population.
Breeding population: the population subjected to GS for achieving the desired improvement and isolation of superior lines for use as new varieties/parents of new improved hybrids.
Training population-
large enough: must be representative of the breeding population: max. trait variance with marker : by cluster analysis
should have either equal or comparable LD, LD decay rates with breeding populations
Updated by including individuals/lines from the breeding population
Training more than one generation
Low colinearity between markers is needed since high colinearity tends to reduce prediction accuracy of certain GS models. (colinearity disturbed by recombination)
GWAS of Resistance to Stem and Sheath Diseases of Uruguayan Advanced Rice Bre...CIAT
Speaker: Lic. JUAN ROSAS, (MSc.) Programa de Arroz INIA-Uruguay y estudiante de Doctorado en Ciencias Agrarias de la Universidad de la República de Uruguay
Improving the accuracy of genomic predictions in small holder crossed-bred da...ILRI
Presented by Raphael Mrode, Julie Ojango, John Gibson and Okeyo Mwai at the 7 All Africa Conference on Animal Agriculture (AACAA), Accra , Ghana 29 July– 2 August 2019
Rice breeding is both challenged and benefited by the fact that a successful varietal improvement program must embrace both the integration single genes that segregate in a simple Mendelian fashion as well as complex traits that are inherited in more quantitative ways. For decades the rice genetics community has produced a wealth of knowledge about these single genes and has developed markers that allow a breeder to track them in a population. However, marker assisted selection (MAS) alone is insufficient to drive the rates of genetic gain for more complex traits that are equally necessary. This presentation will describe the attempts made in the Favorable Environments Breeding program at IRRI to integrate the selection for single genes appropriate for MAS into a more complex population improvement strategy designed to improve quantitatively inherited traits.
Research Program Genetic Gains (RPGG) Review Meeting 2021: From Discovery to ...ICRISAT
A number of advances in genetics and genomics research of pigeonpea. These advances have enhanced our understanding of structural and functional aspects of genome and also provided us opportunities to deal with constraints impeding production of pigeonpea in precise and faster manner. Availability of the draft genome sequence and large-scale molecular markers has made it possible to map traits of interest in speedy manner. Although germplasm re-sequencing has already been started in pigeonpea, large-scale germplasm including elite breeding line, landraces and wild species is expected to be fully sequenced very soon.
Multiple inbred founder lines are inter-mated for several generations prior to creating inbred lines, resulting in a diverse population whose genomes are fine scale mosaics of contributions from all founders.
Resource use efficiency in livestock: Bridging the biotechnology-livestock pr...ExternalEvents
Resource use efficiency in livestock: Bridging the biotechnology-livestock productivity gap in East Africa presentation by Denis Mujibi, Nelson Mandela African Institute for Science and Technology, Arusha, Tanzania
Sequencing-based genotyping assays bring genotyping and genomics research to a crossroads. CD Genomics, as an advanced genomics service provider, has equipped sequencing-based genotyping technologies as well as SNP array services for our global customers. We deliver SNP and SNV discovery, genotype screening, and subsequent association analysis results, dedicated to facilitating research in pharmacogenomics, molecular breeding, genetics, and more. https://www.cd-genomics.com/snp-microarray.html
Association genetics‟ or ‟association studies,” or ‟linkage disequilibrium mapping”.
Tool to resolve complex trait variation down to the sequence level by exploiting historical and evolutionary recombination events at the population level.
Natural population surveyed to determine MTA using LD.
Genome to pangenome : A doorway into crops genome explorationKiranKm11
This seminar underpins the significance and need of formulating pan-genome oriented crop improvement strategies over single reference genome based studies. Pangenome graphs uncovers large repository of genetic variation which could we useful for planning and executing strategic crop improvement programmed
Mixed Models: How to Effectively Account for Inbreeding and Population Struct...Golden Helix Inc
Population structure and inbreeding can confound results from a standard genome-wide association test. Accounting for the random effect of relatedness can lead to lower false discovery rates and identify the causative markers without over-correcting and dampening the true signal.
This presentation will review four different methods of analyzing genotype data while accounting for random effects of relatedness. Methods include PCA analysis with Linear Regression, GBLUP, EMMAX, and MLMM. Comparisons will be made using data from the Sheep HapMap project and a simulated phenotype. After presenting the various methods, we will discuss how these results can be obtained using Golden Helix SNP & Variation Suite (SVS) software and how SVS can be used to compare and contrast the results.
Back to Basics: Using GWAS to Drive Discovery for Complex DiseasesGolden Helix Inc
Genome-wide association studies (GWAS) have been providing valuable insight to the genetics of common and complex diseases for nearly 10 years. Despite some assertions to the contrary, GWAS is not dead. GWAS is alive and well, and remains a viable technology for genetic discovery.
This webcast will cover:
GWAS data formats, usability, and data management techniques.
Imputation: Myths, facts, and when to use it.
Quality assurance: What questions should you be asking about your data?
Genotype association testing and statistics: Contingency tables, linear and logistic regression, Mixed Linear Models, and more.
Visualizations including Manhattan Plots, linkage disequilibrium plots, and genomic annotation sources.
Exploring public databases to investigate your results.
Tips for using exome chips and other targeted genotyping platforms.
Along the way, Dr. Christensen will highlight best practice approaches and common pitfalls to avoid. Golden Helix SNP & Variation Suite (SVS) software will be used to demonstrate many of these concepts.
Similar to Potential for Genomic Selection in indigenous breeds and results of GWAS in Gir dairy cattle of gujrat (20)
NVBDCP.pptx Nation vector borne disease control programSapna Thakur
NVBDCP was launched in 2003-2004 . Vector-Borne Disease: Disease that results from an infection transmitted to humans and other animals by blood-feeding arthropods, such as mosquitoes, ticks, and fleas. Examples of vector-borne diseases include Dengue fever, West Nile Virus, Lyme disease, and malaria.
- Video recording of this lecture in English language: https://youtu.be/kqbnxVAZs-0
- Video recording of this lecture in Arabic language: https://youtu.be/SINlygW1Mpc
- Link to download the book free: https://nephrotube.blogspot.com/p/nephrotube-nephrology-books.html
- Link to NephroTube website: www.NephroTube.com
- Link to NephroTube social media accounts: https://nephrotube.blogspot.com/p/join-nephrotube-on-social-media.html
Adv. biopharm. APPLICATION OF PHARMACOKINETICS : TARGETED DRUG DELIVERY SYSTEMSAkankshaAshtankar
MIP 201T & MPH 202T
ADVANCED BIOPHARMACEUTICS & PHARMACOKINETICS : UNIT 5
APPLICATION OF PHARMACOKINETICS : TARGETED DRUG DELIVERY SYSTEMS By - AKANKSHA ASHTANKAR
Title: Sense of Taste
Presenter: Dr. Faiza, Assistant Professor of Physiology
Qualifications:
MBBS (Best Graduate, AIMC Lahore)
FCPS Physiology
ICMT, CHPE, DHPE (STMU)
MPH (GC University, Faisalabad)
MBA (Virtual University of Pakistan)
Learning Objectives:
Describe the structure and function of taste buds.
Describe the relationship between the taste threshold and taste index of common substances.
Explain the chemical basis and signal transduction of taste perception for each type of primary taste sensation.
Recognize different abnormalities of taste perception and their causes.
Key Topics:
Significance of Taste Sensation:
Differentiation between pleasant and harmful food
Influence on behavior
Selection of food based on metabolic needs
Receptors of Taste:
Taste buds on the tongue
Influence of sense of smell, texture of food, and pain stimulation (e.g., by pepper)
Primary and Secondary Taste Sensations:
Primary taste sensations: Sweet, Sour, Salty, Bitter, Umami
Chemical basis and signal transduction mechanisms for each taste
Taste Threshold and Index:
Taste threshold values for Sweet (sucrose), Salty (NaCl), Sour (HCl), and Bitter (Quinine)
Taste index relationship: Inversely proportional to taste threshold
Taste Blindness:
Inability to taste certain substances, particularly thiourea compounds
Example: Phenylthiocarbamide
Structure and Function of Taste Buds:
Composition: Epithelial cells, Sustentacular/Supporting cells, Taste cells, Basal cells
Features: Taste pores, Taste hairs/microvilli, and Taste nerve fibers
Location of Taste Buds:
Found in papillae of the tongue (Fungiform, Circumvallate, Foliate)
Also present on the palate, tonsillar pillars, epiglottis, and proximal esophagus
Mechanism of Taste Stimulation:
Interaction of taste substances with receptors on microvilli
Signal transduction pathways for Umami, Sweet, Bitter, Sour, and Salty tastes
Taste Sensitivity and Adaptation:
Decrease in sensitivity with age
Rapid adaptation of taste sensation
Role of Saliva in Taste:
Dissolution of tastants to reach receptors
Washing away the stimulus
Taste Preferences and Aversions:
Mechanisms behind taste preference and aversion
Influence of receptors and neural pathways
Impact of Sensory Nerve Damage:
Degeneration of taste buds if the sensory nerve fiber is cut
Abnormalities of Taste Detection:
Conditions: Ageusia, Hypogeusia, Dysgeusia (parageusia)
Causes: Nerve damage, neurological disorders, infections, poor oral hygiene, adverse drug effects, deficiencies, aging, tobacco use, altered neurotransmitter levels
Neurotransmitters and Taste Threshold:
Effects of serotonin (5-HT) and norepinephrine (NE) on taste sensitivity
Supertasters:
25% of the population with heightened sensitivity to taste, especially bitterness
Increased number of fungiform papillae
Integrating Ayurveda into Parkinson’s Management: A Holistic ApproachAyurveda ForAll
Explore the benefits of combining Ayurveda with conventional Parkinson's treatments. Learn how a holistic approach can manage symptoms, enhance well-being, and balance body energies. Discover the steps to safely integrate Ayurvedic practices into your Parkinson’s care plan, including expert guidance on diet, herbal remedies, and lifestyle modifications.
Ozempic: Preoperative Management of Patients on GLP-1 Receptor Agonists Saeid Safari
Preoperative Management of Patients on GLP-1 Receptor Agonists like Ozempic and Semiglutide
ASA GUIDELINE
NYSORA Guideline
2 Case Reports of Gastric Ultrasound
Basavarajeeyam is a Sreshta Sangraha grantha (Compiled book ), written by Neelkanta kotturu Basavaraja Virachita. It contains 25 Prakaranas, First 24 Chapters related to Rogas& 25th to Rasadravyas.
Knee anatomy and clinical tests 2024.pdfvimalpl1234
This includes all relevant anatomy and clinical tests compiled from standard textbooks, Campbell,netter etc..It is comprehensive and best suited for orthopaedicians and orthopaedic residents.
Potential for Genomic Selection in indigenous breeds and results of GWAS in Gir dairy cattle of gujrat
1. Potential for Genomic Selection
in Indigenous Cattle Breeds
POSTGRADUATE INSTITUTE OF VET. EDU. & RESEARCH,
KAMDHENU UNIVERSITY, GANDHINAGAR, GUJRAT
Dr. P. H. Vataliya
Dr. Nilesh Nayee
Dr. Rajeshkumar Thakkar
2. FLOW OF PRESENTATION…..
Introduction
Pre Genomic Era
Genomic Selection
SNPs
Methodology of Genomic
Selection
Comparison of methods of
Genomic Selection
How does Genomic Selection
alter Selection ?
Factors affecting the Accuracy
of Genomic Selection
Impact of Genomic Selection in
Animal Breeding
Advantages of Genomic Selection
Limitations of Genomic Selection
Genomic Selection around the
world
Genomic Selection in INDIA
Conclusions
Future Prospects
3. The main goal in animal breeding is to select individuals having high
breeding values for traits of interest as parents to produce the next generation
as quickly as possible.
Most programs rely on statistical analysis of large databases with phenotypes
on breeding populations by linear mixed model to estimate breeding values.
Use of genetic markers to identify QTLs and their use in marker-assisted
selection.
The advent of high-density SNP genotyping, combined with novel statistical
methods for the use of data to estimate breeding values, has resulted in
application of genomic selection in dairy cattle.
INTRODUCTION
4. Selection
i. Differential rate of reproduction
ii. Choosing parents of Next Generation
A form of MAS using genetic marker covering whole
genome
genomic selection is not an exact science but it is a
powerful new tool for predicting results based on SNPs
INTRODUCTION
5. (Intensity of Selection • Accuracy of Selection •Genetic Standard Deviation )
∆G = ---------------------------------------------------------------------------------
Generation interval
∆G depends primarily upon the ability to recognize genotypes with superior
breeding values
Generation interval inversely related to genetic gain
Thus, assessment of breeding value of all individuals comprising a population
is required
INTRODUCTION
6. Individual’s breeding values assessed on the basis of
Own performance
Performance of collateral relatives
Pedigree information
Performance of progeny
The progeny testing has a HIGH ACCURACY OF
SELECTION, among the methods described above, but the
GENERATION INTERVAL is also HIGH
INTRODUCTION
7. Works well if:
– Heritability of traits is medium to high
– Progeny’s performance data is available
Less effective if:
– Heritability of traits is low or sex limited traits
– Animals are young (No progeny and thus no records are
available)
Traditional Breeding
8. MOLECULAR GENETICS: Studies the structure and function
of gene at a molecular level
QTL DETECTION AND MAPPING: Quantitative trait
loci(QTLs) are scattered genes over the genome and they are
responsible for inheritance of quantitative trait
MAS STRATEGIES: Marker assisted selection (MAS)
is indirect selection process where a trait of interest is
selected, not based on the trait itself, but on a marker linked to
it
GENOMICS: Study of genomes of individuals
GENOMIC ERA
9. MAS explains only a limited proportion of the total genetic
variance captured by the markers
An alternative to tracing a limited number of QTL with markers is
to trace all the QTL
This can be done by dividing the entire genome up into
Chromosomal Segments.
PRE GENOMIC ERA
10. Selection based on the prediction of breeding values from the
information of dense markers covering the whole genome
GS is MAS on a genome-wide scale
By using Genome Wide-dense markers : use Total Genetic
Variance (Vg)
Traditional MAS : ~10% of Total Genetic Variance (Vg)
(Meuwissen et al. 2001)
GENOMIC SELECTION
11. Genomic selection exploits linkage disequilibrium
The assumption is that the effects of the chromosome segments
will be the same across the population because the markers are in
LD with the QTL that they bracket
(Hastbacka et al., 1992)
Hence the marker density must be sufficiently high to ensure that
all QTL are in LD with a marker or haplotype of markers
Cont...
GENOMIC SELECTION
12. 1. A large number of progeny tested bulls (or recorded
females preferably with known pedigree) and their
DNA samples
2. Genotyping these samples for a large number of
Polymorphic SNPs
3. Appropriate statistical methods and models for estimating
GBVs
REQUIREMENT FOR GENOMIC SELECTION
13. There are different types of markers available for MAS, like
RFLP, AFLP, Microsatellite, Minisatellite and SNPs.
RFLP, AFLP, Microsatellite and Minisatellite are not evenly
spread over genome compare to SNPs
SNPs are single nucleotide variation in DNA sequence of
Genome differs between member of population.
SNPs
14. Now a days Genomic Selection is
based on DNA chip which are of
SNPs.
This kind of chips are called as SNP
chip or Snip chip.
Sequencing of livestock genomes
has discovered 100s of 1000s of
Single Nucleotide Polymorphism
(SNP) markers
Cont...
SNPs
15. Why SNPs ?
More frequent in the genome
Polymorphic
Low mutation rate
Work well across laboratories
Already available as part of genomic selection breeding
programs
SNPs
18. SNPs are most valuable for traits that are
Of low heritability
Difficult or expensive to measure (feed efficiency)
Unmeasurable until after selection has occurred (carcass data)
Currently not selected due to lack of available phenotypic data
(tenderness)
Sex limited traits (milk production)
(Van Eenennaam, 2011)
18
SNPs
19. Part of the population is genotyped using the dense SNP chip and
phenotyped for quantitative traits. This is referred as the
Reference Population
The establishment of an appropriate Reference Population is one
of the key aspects in Genomic Selection
METHODOLOGY OF GS
20. For dairy cattle Reference Populations, Saatchi et al, (2010)
recommended to use reliable (>90%) progeny tested sires from
recent generations rather than older bulls.
Size of the Reference Population is inversely proportional to the
heritability of the trait and directly proportional to the effective
population size (Goddard, 2009).
METHODOLOGY OF GS
21. The effect of all the SNPs is estimated in the Reference
Population by statistical models; where the association between
SNPs and phenotypes is calculated. For working out the
prediction equations
The rest of the population (other then Reference Population) is
genotyped using the same SNP chip and the total genetic value
(GEBV) of the animals is predicted by using the prediction
equations derived from Reference Population
(Meuwissen et al., 2001)
Cont..
METHODOLOGY OF GS
22. Methods for estimation of GEBV
Least Squares Analysis (LS)
Genome-wide Best Linear Unbiased Prediction (GW-BLUP)
Bayesian approach
Least Squares: Test all the genes one by one for their statistical
significance, and set the effects of the non-significant genes to zero,
while estimating the effects of the significant genes simultaneously
using LS.
(Meuwissen et al., 2001)
METHODOLOGY OF GS
23. Cont...
Best Linear Unbiased Prediction: Fit the allelic effects as
random effects instead of as fixed effects. The fitting of
random effects does not require degrees of freedom, and
thus all allelic effects can be estimated simultaneously.
Bayesian estimation: This is similar to BLUP, except that
the variance of the allelic effects is assumed different for
every gene, and is estimated by using a prior distribution
for this variance.
METHODOLOGY OF GS
24. Accuracy
Meuwissen et al., (2001) reported Accuracy of Genomic
Selection by using various statistical models.
Method Accuracy
LS .36
BLUP .74
Bayes .84
COMPARISON OF METHODS
25. On the basis of Marker density
Low – little differences between GW-BLUP and Bayesian
methods, accuracy low to moderate
High – saturation of efficiency of GW-BLUP, whereas Bayesian
approaches increase in accuracy
(Boichard, 1996)
COMPARISON OF METHODS
26. Reliabilities
Reliability GEBVs of Bayes only 1% higher than GW-BLUP
Reliability of Bayes is substantially higher for traits influenced
by large QTL
(Van Raden et al, 2008)
COMPARISON OF METHODS
27. Population structure/history
• Size of sib families
• Generation interval
Availability of dense marker maps
Availability of many genotyped individuals with records
USEFULNESS OF GS DEPENDS ON:
29. Based on marker approach
Comparing the accuracy of genomic selection with – Haplotypes (IBD
/ IBS approach)
IBD- Identical by descent i.e. two genes have originated from
replication of one single gene in a previous generation
IBS- Identical by state i.e. two genes may not have originated from
replication of same gene but still they have functional identity
(Falconer,1996)
ACCURACY OF GS
30. Calus et al. (2007) used simulated data
Based on marker approach
ACCURACY OF GS
31. Reliabilities of SNP markers of various densities were
reported by VanRaden (2010) as follows:
SNP density Reliabilities
3k 70% - 80%
50k 83%
700k 84%
Based on marker density
ACCURACY OF GS
32. Linkage disequilibrium between QTL and markers = density of
markers
In dairy cattle populations, an average r2 of 0.2 between
adjacent markers is only achieved when markers are spaced
every 100kb
Based on LD
ACCURACY OF GS
33. Number of records used to estimate chromosome
segment effects
Meuwissen et al. (2001) evaluated accuracy using LS,
BLUP, Bayes using 500, 1000 or 2000 records in the
reference population
No. of phenotypic records
500 1000 2000
Least squares 0.124 0.204 0.318
BLUP 0.579 0.659 0.732
Bayes 0.708 0.787 0.848
Based on No of records
ACCURACY OF GS
35. How often to re-estimate GEBVs?
Meuwissen et al. (2001) reported the correlation between Estimated
BV(EBV) and True BV(TBV) in generations 3rd -8th
Denser markers; require more generations between re-estimation of GEBV (Meuwissen
et al., 2001)
Generation
3rd 0.848
4th 0.804
5th 0.768
6th 0.758
7th 0.734
8th 0.718
RE-ESTIMATION OF GEBVs
36. Dairy Cattle 60-120% (Pryce et al., 2011)
Meat sheep 21% (Van der Werf, 2011)
Wool sheep 38% (Van der Werf, 2011)
Layers 40% (Dekkers et al., 2009)
Broilers 20% (Dekkers et al., 2009)
ESTIMATIED INCREASED ∆G From GS
37. Selection of young bulls (no progeny test)
Saves costs of progeny test: ~ 40,000 $/bull
Reduces generation interval by factor 2
Annual savings of $23 million (92%)
Condition: Updated marker information are available
(Schaeffer, 2006)
IMPACT OF GS ON DAIRY CATTLE BREEDING
38. Once marker effects are estimated they can be useful for a few
generations
Selection possible on novel traits, which otherwise require expensive
phenotyping
New breeding strategies can be implemented
Increased genetic gain
– By increasing accuracy of selection
– By reducing the generation interval due to early selection
Select animals before they are of productive and/or reproductive age
Eliminate the need for progeny testing
ADVANTAGE OF GS
39. Genotyping still costly
Marker estimates must be estimated in population that they will be used in
If generation intervals are shortened substantially then annual inbreeding
rates could be higher
Need to genotype a sufficiently large set of animals for accurate marker
estimates
For traits with lower heritability - more records needed
LIMITATION OF GS
40. ADHIS produced genomic based breeding values for bulls in
September and December 2010.
2,381 Holstein bulls were included in the September 2010
analysis (2,193 reference bulls and 188 young bulls). In this
group of 188 young bulls with almost no daughter performance
data, an improvement in reliability across all key traits is
evident.
(Hayes et al, 2009)
GLOBAL SCENARIO OF GS
41. GEBVs obtained by USDA in collaboration with Canada for
Holstein bulls have been released in public every year since 2008
A project at Guelph with 820 bulls was carried out with the
following results
Traits
Reliability –
Traditional
methods
Reliability –
Genomic
Selection
Protein yield 38 46
Fat yield 38 43
SCS 30 48
Conformation 39 47
(Pryce and Daetwyler, 2012)
GLOBAL SCENARIO OF GS- CANADA
43. CRV launched InSire bulls – Designated to GS selected bulls, since
2008, for Holstein and Jersey breeds
Increases in the reliability using GEBVs were also reported by CRV
as follows :
Traits Additional reliability
Protein production 17%
Overall Conformation 14%
SCS 11%
(Hayes et al, 2008)
GLOBAL SCENARIO OF GS- NATHERLAND(CRV)
44. LIC had the foresight to store DNA from every sire that was
progeny tested since 1980.
This enabled LIC to genotype sires that were the best, and the
worst too, of their progeny test cohort and thus evaluate markers
across the genetic range.
The degree of accuracy of GEBVs was measured by their
correlation with Progeny test BVs and were found to be ranging
from 0.45 to 0.60 for production traits in HF breed
(Hayes et al, 2008)
GLOBAL SCENARIO OF GS- NATHERLAND(LIC)
45. Nordic countries (VikingGenetics)
VikingGenetics got the first genomic indexes of Holstein, Jersey and
Red Breeds during the later parts of year 2007
They have genomic indexes every two months for purposes of
purchase of new bulls to their breeding programme
(Pryce and Daetwyler, 2012)
GLOBAL SCENARIO OF GS
46. Policy makers need to be convinced of the potential of effective
breeding programmes
Extensive validation of association between genotypes and
phenotypes needed
GS can be use if accurate performance records are available
Only genotyping without phenotyping and efficient data analysis
will be wasteful expenditure
GS IN INDIA
48. Genome Wide Association Study of udder type traits
and 305 day milk yield in Gir cattle
Total 559 animals were available for genotyping
Animals were genotyped using the customized Illumina Bovine HD microarray chip
assay INDUSCHIP 1
The 45,024 SNPs were distributed over all 29 Bos indicus autosomes
Certain chromosomes having large numbers of SNPs affecting a trait
9 udder type traits recommended by ICAR, investigated for genome wide association
study
A total of 838 genome-wise significant SNPs associated with 9 udder type traits (p-
value < 0.0001) were found
51. Fore udder attachment
A total 11 SNPs were found to be associated significantly (p-value <0.0001)
Maximum numbers of SNPs were located on chromosome No. 3 (2 SNPs) in this region
between base pair position 85.5MB to 100.8MB.
Genome Wide Association Study
52. Central ligament
A total 6 SNPs were found to be associated significantly (p-value <0.0001)
Maximum no. of SNPs were on chromosome No. 5 (2 SNPs: NDDB-BOVINEHD0500024877
and NDDB-BOVINEHD0500026042) in this region between base pair position 87.7MB to
91.8MB.
Genome Wide Association Study
53. Fore teat placement
A total 3 SNPs were found to be associated significantly (p-value <0.0001)
Maximum no. of SNPs were located on chromosome No. 6 (2 SNPs: BTB-01530236 and
NDDB-BOVINEHD0600006154) in this region between base pair position 22.30MB to
22.32MB
Genome Wide Association Study
54. Rear teat placement
A total 7 SNPs were found to be associated significantly (p-value <0.0001)
Maximum no. of SNPs were located on chromosome No. 4 (2 SNPs) in this region between
base pair position 1.57MB to 21.8MB
Genome Wide Association Study
55. Rear udder height
A total 7 SNPs were found to be associated significantly (p-value <0.0001)
Maximum no. of SNPs were located on chromosome No. 4 (2 SNPs) in this region between
base pair position 27.96MB to 109.04MB
Genome Wide Association Study
56. Rear udder width
A total 38 SNPs were found to be associated significantly (p-value <0.0001)
Maximum no. of SNPs were located on chromosome No. 14 (4 SNPs) in this region between
base pair position 3.08MB to 58.35MB
Genome Wide Association Study
57. Teat length
A total 166 SNPs were found to be associated significantly (p-value <0.0001)
Maximum no. of SNPs were located on chromosome No. 5 (31 SNPs) in this region between
base pair position 8.15MB to 116.9MB
Genome Wide Association Study
58. Udder depth
A total 14 SNPs were found to be associated significantly (p-value <0.0001)
Maximum no. of SNPs were located on chromosome No. 6 (5 SNPs) in this region between
base pair position 17.86MB to 61.52MB
Genome Wide Association Study
59. Teat thickness
A total 89 SNPs were found to be associated significantly (p-value <0.0001)
Maximum no. of SNPs were located on chromosome No. 5 (17 SNPs) in this region between
base pair position 14.81MB to 93.47MB
Genome Wide Association Study
60. 305day milk yield
A total 497 SNPs were found to be associated significantly (p-value <0.0001)
Maximum no. of SNPs were located on chromosome No. 5 (59 SNPs) in this region between
base pair position 3.49MB to 118.9MB
Genome Wide Association Study
61. The GWAS of these important traits with the SNP chip array i.e.
INDUSCHIP1 can be the footstep to be embark upon the option of
Genomic Selection in Gir cattle
The Genomic Selection thus incorporated into the Cattle Breeding
Programme would ensure rapid genetic progress of Gir, an important
indigenous dairy cattle of India
Genome Wide Association Study
63. • The 45024 SNPs included in the INDUSCHIP 1 SNP chip were distributed over all 29 Bos
indicus autosomes.
• Majority of SNPs were (26,007 out of 45,024) spread under MAF class 0.3-0.5, while, only
3883 SNPs were observed under MAF class 0.1-0.2.
• A total 2009 genome-wise significant SNPs associated with 10 conformation traits and
milk yield (p-value < 0.0001) were found by PLINK software
Genome Wide Association Study
65. Manhattans plot of Stature
• A total 632 SNPs were found to be genome wise significant (p-value < 0.0001) for stature in the present study
• The chromosome with the highest number of associated SNPs was chromosome 5 which had 64 significantly associated
SNPs in this region between base pair position 1 Mb to 155 Mb.
Genome Wide Association Study
66. Manhattans plot of Body depth
• A total 148 genome-wise significant SNPs associated with body depth (p-value < 0.0001) were found in the present study.
• The chromosome with the highest number of associated SNPs was chromosome 5 which had 23 significantly associated SNPs in this region
between base pair position 3 Mb to 130 Mb.
Genome Wide Association Study
67. Body length
• A total 209 SNPs were found to be genome wise significant (p-value < 0.0001) for body length in present study.
• The chromosome with the highest number of associated SNP was chromosome 6 which had 22 significantly associated SNPs in this region
between base pair position 1 Mb to 125 Mb.
Genome Wide Association Study
68. Manhattans plot of Heart girth
• A total of 451 genome-wise significant SNPs associated with heart girth (p-value < 0.0001) were found in present study
• The chromosome with the highest number of associated SNPs was chromosome 5 which had 46 significantly associated SNPs in
this region between base pair position 1 Mb to 155 Mb.
Genome Wide Association Study
69. Manhattans plot of Angularity
A total 11 SNPs were found to be genome wise significant (p-value < 0.0001) for angularity in
present study
Genome Wide Association Study
70. Manhattans plot of Rump angle
• A total of 14 genome-wise significant SNPs associated with rump angle (p-value < 0.0001) were found in
present study
• The highest number of 5 significantly associated SNPs were found with chromosome 1.
Genome Wide Association Study
71. Manhattans plot of Rump width
• A total 30 SNPs were found to be genome wise significant (p-value < 0.0001) for rump width in present study
• The chromosome with the highest number of associated SNPs was chromosome 9 which had 6 significantly associated
SNPs in this region between base pair position 1 Mb to 117 Mb.
Genome Wide Association Study
72. Manhattans plot of Rear leg side view
• Genome-wise 7 significant SNPs associated with rear leg set were found in present study
• The significant SNPs associated with rear leg were observed on chromosome 1, 3, 5 and 24.
Genome Wide Association Study
73. Manhattans plot of Rear leg rear view
• A total 5 SNPs were found to be genome wise significant (filter p-value < 0.0001) for rear leg rear view in present study
• The significant SNPs associated with rear leg rear view were observed on chromosome 1, 5, 15, 21 and 25
Genome Wide Association Study
74. Manhattans plot of Foot angle
• Genome-wise significant SNPs associated with foot angle were 5 in the present study
• The significant SNPs associated with foot angle were observed on chromosome 6, 8, 10 and 11.
Genome Wide Association Study
75. Manhattans plot of 305day Milk yield
• A total of 497 genome-wise significant SNPs associated with milk yield (with filter p-value < 0.0001)
were found by genome-wide association study
• The chromosome with the highest number of associated SNPs was chromosome 5 which had 59
significantly associated SNPs in this region between base pair position 1Mb to 118 Mb.
Genome Wide Association Study
76. CONCLUSIONS FROM GWAS
All the conformation traits in Gir animals were intermediate except rear leg rear view. Most of the
conformation traits were desirable, however, some traits showed the undesirable characteristics
viz. heart girth, body depth, body length, stature and foot angle. So, such traits needed to
improvement.
The body depth, heart girth, body length and stature were highly positively and significantly
correlated with 305day milk yield. This indicated that the deeper, longer and taller cows might
produce more milk than the narrower and shorter cows.
The phenotypic correlation of body depth and heart girth, body length, stature were highly
correlated and positive highly significant (p<0.01)
77. POSSIBILITIES IN INDIA
Large Non Descript animals need to be graded up with High
Genetic Merit Sires of known breeds.
Establishment of well organized breeding network,
performance recording system and reference population
Initially globally available 50k SNP chip may be tried in
indigenous breeds
INAPH recording system of NDDB is coming up which can
be used as performance records for Genomic Selection
78. CONCLUSIONS
Dairy industry uniquely suited for genomic selection
GS in dairy cattle is need of day for obtaining faster
genetic gain (High Accuracy)
Several countries are implementing genomic selection
Hybrid systems merging classic and genomic selection
are arising
Usefulness of GS depends on population structure,
availability of dense marker maps and large reference
population
79. FUTURE PROSPECTUS….
Genotyping of more SNP to get clearer ‘picture’ of
genetic variation
Genotyping and get records for more animals
Refinement and development of new estimation methods
Accurate performance recording and reliable record
keeping as well as precise genotyping initiatives will be
required for developing nations like India
All the selection processes and the breeding programs revolve around the central theme of genetic gain per year. Genetic Gain directly proportionate to Intensity of Selection, Accuracy of Selection and Standard deviation where it inversely proportionate to Generation interval
In population genetics LD is non random association of alleles at different loci. Loci are said to be in linkage disequilibrium when the freq. of association of their different allele is higher or lower than what would be expected if the loci were independent and associated randomly.
This SNP chips are of different kind..
Based on that Markers are distributed
SNPs have more value compare to these other markers. So SNPs are favourite for GS
HAPLOTYPES are A set of closely linked genetic markers present on one chromosome which tend to be inherited
together (not easily separable by recombination)
In dairy cattle high h2 trait selection, beef low h2
Fecundity of animal
Complex trait
Australian Dairy Herd Improvement Scheme
LIC=live Stock improvement coorporation
There is no evident literature on Genomic Selection in India.
After correction with least square constant and GWAS in PLINK these results were obtained.
Before carrying out GWAS, Remove fixed effects of lactation no. and stage of lactation with least square constants
The least square means conformation traits which were significantly affected by lactation stage and lactation number were corrected before GWAS
Initial available 50k snpchip globally, 50k snp chip available may be tried in indigenous breed