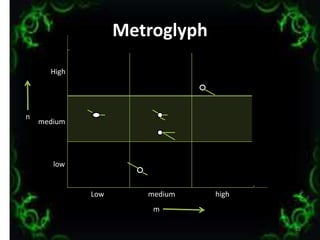
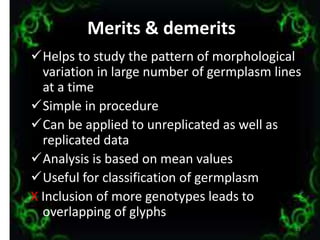
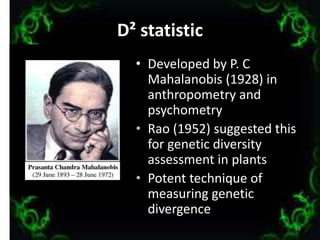
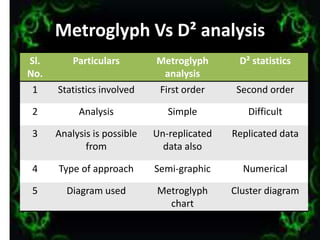
GENETIC DIVERSITY
ANALYSIS
Presenting to you by:
AKHISHA P. A.
BAM-15-57
17.02.2016 1
GGENETIC DIVERSITY ANALYSIS
 Variability and its sources
 Features of polygenic traits
 Types of polygenic variation
 Methods of assessment of variability
2
What is variability??
• Presence of differences among the
individuals of plant population
• Due to differences in genetic constitution
• Due to differences in environment
• Essential for resistance to biotic and abiotic
factors and adaptability
3
4
5
Sources of variability
• Spontaneous mutations
• Natural outcrossing
• Recombination
Measures of conservation
• Global gene pool
• Deliberate use of heterogeneous populations
• Use of multiline varieties
6
Features of polygenic traits
• Continuous variation
• Small and undetectable effect of individual
gene
• Several genes involved
• No possibility of grouping into distinct classes
• High effect of environment
• Analysed based on mean, variance and
covariance
• Possibility of metric measurements
• Low stability
7
Types of polygenic variation
1. Phenotypic variation:
• Observable; Genotypic + environmental;
Measured as phenotypic variance
2. Genotypic variation:
• Inherent; Unaltered by environment; Measured
as genotypic variance
3. Environmental variation:
• Non heritable; uncontrolled; measured as error
mean variance
8
Assessment of polygenic variation
• Requires metric measurements
• Observes several individuals and mean values
are used in studies
• Uses mean, variance, covariance etc. from
replications
9
Methods of
assessment of variability
i. Simple measures of variability
ii. Variance component analysis
iii. Metroglyph analysis
iv. D² statistic
10
i) Simple measures of variability
• Range, standard deviation, variance, standard
error, coefficient of variation
• ANOVA provides estimates of CV%
11
PCV=√VP/X̅ x 100
GCV=√VG/X̅ x 100
ECV=√VE/X̅ x 100
• GCV>PCV : little influence of environment,
selection will be rewarding
• PCV>GCV : apparent influence of
environment, selection may be misleading
• ECV>PCV&GCV : significant influence of
environment, selection will be ineffective
12
Variance component analysis
• Crossing of a number of genotypes in a
definite fashion
• Evaluation of progenies in replicated trials
• Diallel, partial diallel, line X tester, generation
mean analysis etc. are used.
13
Metroglyph analysis
• Semi-graphic method
• Assess pattern of morphological
variation in a large number of
germplasm lines taken at a time
• Developed by E Anderson in 1957
14
• Main features are:
Analysed based on first order statistics, hence
more reliable and robust
Simple analysis
Possible from replicated and non replicated
data
Depicts pattern of variability by glyph on the
graph
15
Main steps
1. Selection of genotypes: germplasm lines,
strains, varieties and hybrids; based on
phenotypic or geographical differences
2. Evaluation of material: in replicated trials;
observations on each trait are recorded;
mean values over replications for each trait
are worked out and tabulated
16
3. Assessment of variability: semi-graphic method
of Anderson; has the following steps:
i. Plotting glyph on the graph:
• Small circle representing position of genotype
on the graph is a glyph
• Two characters having high variability are
chosen
• One on X axis and other on Y axis based on their
means
• Each glyph occupies a definite position on the
graph
• Exotic or hybrids by solid glyph
• Indigenous or parents by open glyph
17
ii. Depiction of variation:
• Remaining characters displayed on glyph by rays
• Rays for same character have the same position
on glyph
• Length of ray depends on index value
iii. Construction of index score:
• Variation for each character is divided into three
groups viz., low, medium and high with index
score 1,2 and 3 respectively
• Sum of index values= worth of genotype
• Max and min scores are 3n and n (n is the total
number of characters)
18
iv. Analysis of variation:
• Genotypes are divided into various groups
• Max number of groups will be nine
• Within and between groups variances are
analysed
19
Example 1
• Take 5 genotypes A,B,C,D,E
• A,B are exotic and C,D,E are indigenous
• 5 characters are analysed viz., m, n, p, q and r
• Mean values are worked out for each
character and tabulated
20
Genotype m n p q r Total
A 25(2) 20 (1) 25(2) 35(3) 20(1) 9
B 35(3) 35(3) 35(3) 20(1) 20(1) 11
C 20(1) 30(2) 20(1) 25(2) 25(2) 8
D 30(2) 25(2) 35(3) 20(1) 35(3) 11
E 30(2) 30(2) 25(2) 30(2) 25(2) 10
21
Charact
ers
Range
of
means
Score 1 Score 2 Score 3
Value
less
than
sign Value
from -
to
sign Value
more
than
sign
p 20-35 25 25-35 35
q 20-35 25 25-35 35
r 20-35 25 25-35 35
Index scores
Metroglyph
22
Low medium high
High
medium
low
m
n
Merits & demerits
Helps to study the pattern of morphological
variation in large number of germplasm lines
at a time
Simple in procedure
Can be applied to unreplicated as well as
replicated data
Analysis is based on mean values
Useful for classification of germplasm
X Inclusion of more genotypes leads to
overlapping of glyphs
23
D² statistic
• Developed by P. C
Mahalanobis (1928) in
anthropometry and
psychometry
• Rao (1952) suggested this
for genetic diversity
assessment in plants
• Potent technique of
measuring genetic
divergence
24
Main features
• Numerical approach
• Estimates are based on 2nd order
statistics; less precision
• More difficult analysis
• Possible from replicated data only
• Cluster diagram depicts genetic
diversity
25
Main steps
1. Selection of genotypes: germplasm lines,
strains and varieties; based on phenotypic or
geographical differences
2. Evaluation of material: in replicated trials;
observations on each trait are recorded
3. Biometrical analysis: variances for characters
and covariance for their combinations are
estimated; D² analysis; has following steps:
26
• Computation of D² values and testing its
significance against χ² tab value for p degrees
of freedom (p= total number of characters)
• If D² calculated > χ² tab : significant
• Finding out the contribution of individual
characters towards total divergence
• Grouping genotypes into clusters
• Construction of cluster diagram
4. Interpretation: based on cluster diagram
27
Cluster diagram
• Square root of average intra and inter cluster D²
values are used
• Depicts genetic diversity in an easily
understandable manner
• Number of clusters represent number of groups
the population can be classified into
• Inter cluster distance is a measure of degree of
diversification
• Genotypes grouped in one cluster are less
divergent
• Tells about relationship between various clusters
28
Example 2
• 20 genotypes and 5 characters
• Genotypes are classified into 4 clusters
based on D² values
• Square root of D² values (D) are
calculated
29
Clusters I II III IV
I 4 (2) 16 (4) 36 (6) 49 (7)
II 9 (3) 49 (7) 81 (9)
III 4 (2) 9 (3)
IV 1 (1)
30
IV
I
III
II
7
3
4
7
6
9
Considerations in selection of parents
• Relative contribution of each character to
the total divergence
• Choice of clusters with maximum genetic
distance
• Selection of one or two genotypes from
such clusters
31
Merits
• Helps to select genetically divergent parents
• Measures degree of diversification
• Determines relative proportion of each
component character
• Forces of differentiation measured at inter
and intra cluster levels
• Large number of germplasm lines can be
evaluated at a time
32
Demerits
• Analysis is difficult because of variances
and covariances
• Estimates are not statistically very robust
• Analysis not possible from unreplicated
data
33
Metroglyph Vs D² analysis
Sl.
No.
Particulars Metroglyph
analysis
D² statistics
1 Statistics involved First order Second order
2 Analysis Simple Difficult
3 Analysis is possible
from
Un-replicated
data also
Replicated data
4 Type of approach Semi-graphic Numerical
5 Diagram used Metroglyph
chart
Cluster diagram
34
Conclusion
“ Metroglyph analysis and D² statistics
are extensively used for the assessment
of genetic diversity and phenotypic
variability as two-tier system. First the
germplasm is evaluated by metroglyph
analysis and then by D² statistics”
35
References
• Prof. R K Singh, Dr. B D Chaudhary,2010, Biometrical
methods in Quantitative Genetic Analysis, Kalyani
Publishers, New Delhi, pages:224-252
• Phundan Singh, S S Narayanan, Biometrical
techniques in Plant Breeding, pages:8-23
• Jawahar R Sharma, 2006, Statistical and Biometrical
Techniques in Plant Breeding, New Age
International Publishers, New Delhi, pages:51-68
36
37

Genetic diversity analysis

  • 1.
    GENETIC DIVERSITY ANALYSIS Presenting toyou by: AKHISHA P. A. BAM-15-57 17.02.2016 1
  • 2.
    GGENETIC DIVERSITY ANALYSIS Variability and its sources  Features of polygenic traits  Types of polygenic variation  Methods of assessment of variability 2
  • 3.
    What is variability?? •Presence of differences among the individuals of plant population • Due to differences in genetic constitution • Due to differences in environment • Essential for resistance to biotic and abiotic factors and adaptability 3
  • 4.
  • 5.
  • 6.
    Sources of variability •Spontaneous mutations • Natural outcrossing • Recombination Measures of conservation • Global gene pool • Deliberate use of heterogeneous populations • Use of multiline varieties 6
  • 7.
    Features of polygenictraits • Continuous variation • Small and undetectable effect of individual gene • Several genes involved • No possibility of grouping into distinct classes • High effect of environment • Analysed based on mean, variance and covariance • Possibility of metric measurements • Low stability 7
  • 8.
    Types of polygenicvariation 1. Phenotypic variation: • Observable; Genotypic + environmental; Measured as phenotypic variance 2. Genotypic variation: • Inherent; Unaltered by environment; Measured as genotypic variance 3. Environmental variation: • Non heritable; uncontrolled; measured as error mean variance 8
  • 9.
    Assessment of polygenicvariation • Requires metric measurements • Observes several individuals and mean values are used in studies • Uses mean, variance, covariance etc. from replications 9
  • 10.
    Methods of assessment ofvariability i. Simple measures of variability ii. Variance component analysis iii. Metroglyph analysis iv. D² statistic 10
  • 11.
    i) Simple measuresof variability • Range, standard deviation, variance, standard error, coefficient of variation • ANOVA provides estimates of CV% 11 PCV=√VP/X̅ x 100 GCV=√VG/X̅ x 100 ECV=√VE/X̅ x 100
  • 12.
    • GCV>PCV :little influence of environment, selection will be rewarding • PCV>GCV : apparent influence of environment, selection may be misleading • ECV>PCV&GCV : significant influence of environment, selection will be ineffective 12
  • 13.
    Variance component analysis •Crossing of a number of genotypes in a definite fashion • Evaluation of progenies in replicated trials • Diallel, partial diallel, line X tester, generation mean analysis etc. are used. 13
  • 14.
    Metroglyph analysis • Semi-graphicmethod • Assess pattern of morphological variation in a large number of germplasm lines taken at a time • Developed by E Anderson in 1957 14
  • 15.
    • Main featuresare: Analysed based on first order statistics, hence more reliable and robust Simple analysis Possible from replicated and non replicated data Depicts pattern of variability by glyph on the graph 15
  • 16.
    Main steps 1. Selectionof genotypes: germplasm lines, strains, varieties and hybrids; based on phenotypic or geographical differences 2. Evaluation of material: in replicated trials; observations on each trait are recorded; mean values over replications for each trait are worked out and tabulated 16
  • 17.
    3. Assessment ofvariability: semi-graphic method of Anderson; has the following steps: i. Plotting glyph on the graph: • Small circle representing position of genotype on the graph is a glyph • Two characters having high variability are chosen • One on X axis and other on Y axis based on their means • Each glyph occupies a definite position on the graph • Exotic or hybrids by solid glyph • Indigenous or parents by open glyph 17
  • 18.
    ii. Depiction ofvariation: • Remaining characters displayed on glyph by rays • Rays for same character have the same position on glyph • Length of ray depends on index value iii. Construction of index score: • Variation for each character is divided into three groups viz., low, medium and high with index score 1,2 and 3 respectively • Sum of index values= worth of genotype • Max and min scores are 3n and n (n is the total number of characters) 18
  • 19.
    iv. Analysis ofvariation: • Genotypes are divided into various groups • Max number of groups will be nine • Within and between groups variances are analysed 19
  • 20.
    Example 1 • Take5 genotypes A,B,C,D,E • A,B are exotic and C,D,E are indigenous • 5 characters are analysed viz., m, n, p, q and r • Mean values are worked out for each character and tabulated 20
  • 21.
    Genotype m np q r Total A 25(2) 20 (1) 25(2) 35(3) 20(1) 9 B 35(3) 35(3) 35(3) 20(1) 20(1) 11 C 20(1) 30(2) 20(1) 25(2) 25(2) 8 D 30(2) 25(2) 35(3) 20(1) 35(3) 11 E 30(2) 30(2) 25(2) 30(2) 25(2) 10 21 Charact ers Range of means Score 1 Score 2 Score 3 Value less than sign Value from - to sign Value more than sign p 20-35 25 25-35 35 q 20-35 25 25-35 35 r 20-35 25 25-35 35 Index scores
  • 22.
  • 23.
    Merits & demerits Helpsto study the pattern of morphological variation in large number of germplasm lines at a time Simple in procedure Can be applied to unreplicated as well as replicated data Analysis is based on mean values Useful for classification of germplasm X Inclusion of more genotypes leads to overlapping of glyphs 23
  • 24.
    D² statistic • Developedby P. C Mahalanobis (1928) in anthropometry and psychometry • Rao (1952) suggested this for genetic diversity assessment in plants • Potent technique of measuring genetic divergence 24
  • 25.
    Main features • Numericalapproach • Estimates are based on 2nd order statistics; less precision • More difficult analysis • Possible from replicated data only • Cluster diagram depicts genetic diversity 25
  • 26.
    Main steps 1. Selectionof genotypes: germplasm lines, strains and varieties; based on phenotypic or geographical differences 2. Evaluation of material: in replicated trials; observations on each trait are recorded 3. Biometrical analysis: variances for characters and covariance for their combinations are estimated; D² analysis; has following steps: 26
  • 27.
    • Computation ofD² values and testing its significance against χ² tab value for p degrees of freedom (p= total number of characters) • If D² calculated > χ² tab : significant • Finding out the contribution of individual characters towards total divergence • Grouping genotypes into clusters • Construction of cluster diagram 4. Interpretation: based on cluster diagram 27
  • 28.
    Cluster diagram • Squareroot of average intra and inter cluster D² values are used • Depicts genetic diversity in an easily understandable manner • Number of clusters represent number of groups the population can be classified into • Inter cluster distance is a measure of degree of diversification • Genotypes grouped in one cluster are less divergent • Tells about relationship between various clusters 28
  • 29.
    Example 2 • 20genotypes and 5 characters • Genotypes are classified into 4 clusters based on D² values • Square root of D² values (D) are calculated 29
  • 30.
    Clusters I IIIII IV I 4 (2) 16 (4) 36 (6) 49 (7) II 9 (3) 49 (7) 81 (9) III 4 (2) 9 (3) IV 1 (1) 30 IV I III II 7 3 4 7 6 9
  • 31.
    Considerations in selectionof parents • Relative contribution of each character to the total divergence • Choice of clusters with maximum genetic distance • Selection of one or two genotypes from such clusters 31
  • 32.
    Merits • Helps toselect genetically divergent parents • Measures degree of diversification • Determines relative proportion of each component character • Forces of differentiation measured at inter and intra cluster levels • Large number of germplasm lines can be evaluated at a time 32
  • 33.
    Demerits • Analysis isdifficult because of variances and covariances • Estimates are not statistically very robust • Analysis not possible from unreplicated data 33
  • 34.
    Metroglyph Vs D²analysis Sl. No. Particulars Metroglyph analysis D² statistics 1 Statistics involved First order Second order 2 Analysis Simple Difficult 3 Analysis is possible from Un-replicated data also Replicated data 4 Type of approach Semi-graphic Numerical 5 Diagram used Metroglyph chart Cluster diagram 34
  • 35.
    Conclusion “ Metroglyph analysisand D² statistics are extensively used for the assessment of genetic diversity and phenotypic variability as two-tier system. First the germplasm is evaluated by metroglyph analysis and then by D² statistics” 35
  • 36.
    References • Prof. RK Singh, Dr. B D Chaudhary,2010, Biometrical methods in Quantitative Genetic Analysis, Kalyani Publishers, New Delhi, pages:224-252 • Phundan Singh, S S Narayanan, Biometrical techniques in Plant Breeding, pages:8-23 • Jawahar R Sharma, 2006, Statistical and Biometrical Techniques in Plant Breeding, New Age International Publishers, New Delhi, pages:51-68 36
  • 37.