Download to read offline


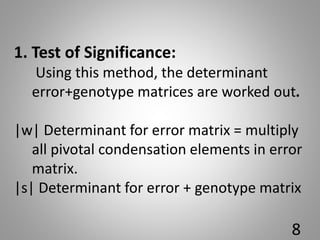
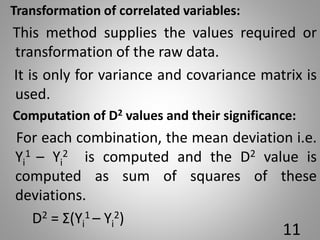
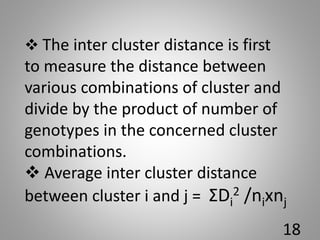
![6.Contributation of individual
charaters towards total divergence:
In all combination of genotypes, [n(n-1)/2],
each character is ranked on basic of values
(Yi
1 –Yi
2 ).
Rank 1 is given to the highest mean
difference and rank p to the lowest mean
difference, where p is the total number of
character.
22](https://image.slidesharecdn.com/m-200916072135/85/D-Square-statistic-22-320.jpg)
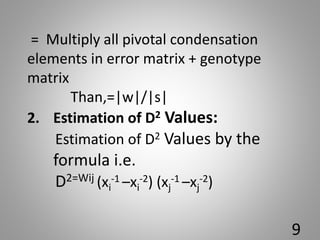
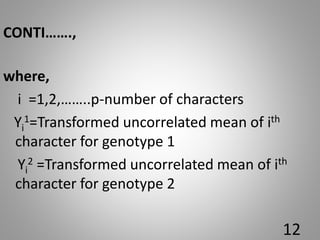
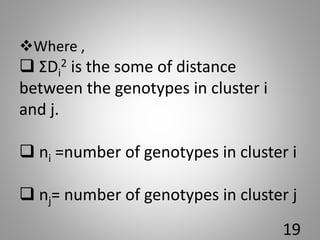
![Percent
contributation
by Xi
No. of times appearing
=first in ranking by X1 x100
[n(n-1)/2]
Xi….Xp are individual character
n is the no. of genotypes
23](https://image.slidesharecdn.com/m-200916072135/85/D-Square-statistic-23-320.jpg)


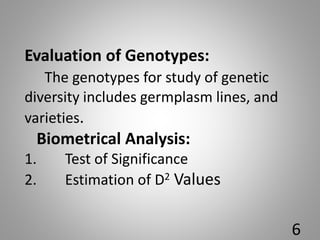
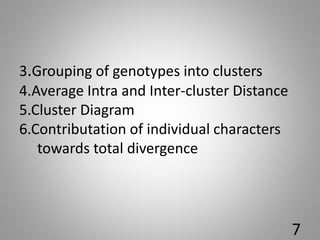
The document discusses the D-square statistic, a measure of group distance based on multiple characteristics, introduced by P.C. Mahalanobis in 1928 and utilized for assessing genetic diversity in plant breeding. It outlines the theory, evaluation of genotypes, biometrical analysis methods, and procedures for grouping genotypes into clusters based on D2 values, including calculations of intra and inter-cluster distances. The document concludes with the importance of individual character contributions to total divergence and references related literature.