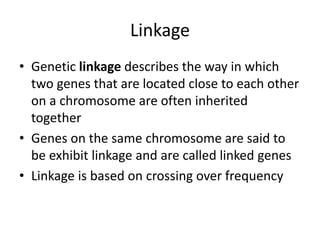
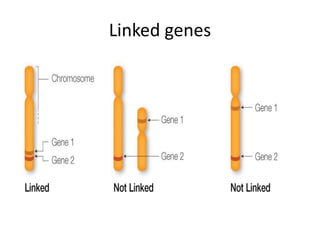
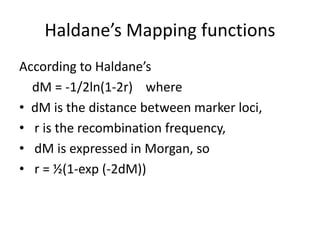
Genetic linkage analysis and genotyping techniques are used to map disease genes to their chromosome locations. Linkage describes how closely linked genes are inherited together on a chromosome. Complete linkage means genes do not cross over, while incomplete linkage means genes can separate during crossing over. Linkage analysis uses techniques like recombination fraction, LOD scores, and Haldane mapping functions to statistically map traits to chromosomes. Genotyping determines genetic differences by examining DNA sequences, and can analyze whole genomes, targeted regions, or custom panels of variants. It enables studying SNPs, CNVs, and structural variants.
What is Genome,Genome mapping,types of Genome mapping,linkage or genetic mapping,Physical mapping,Somatic cell hybridization
Radiation hybridization ,Fish( =fluorescence in - situ hybridization),Types of probes for FISH,applications,Molecular markers,Rflp(= Restriction fragment length polymorphism),RFLPs may have the following Applications;Advantages of rflp,disAdvantages of rflp, Rapd(=Random amplification of polymorphic DNA),Process of rapd, Difference between rflp &rapd
A physical map of a chromosome or a genome that shows the physical locations of genes and other DNA sequences of interest. Physical maps are used to help scientists identify and isolate genes by positional cloning.
According to the ICSM (Intergovernmental Committee on Surveying and Mapping), there are five different types of maps: General Reference, Topographical, Thematic, Navigation Charts and Cadastral Maps and Plans.
SNP (Single Nucleotide Polymorphic), SNP mapping, SNP profile, SNP types, SNP analysis by gel electropherosis and by mass spectrometry, SNP effects, single strand conformation polymorphism, SNP advantages and disadvantages and application of SNP profile in drug choice
It is the DNA located in the mitochondria.Mitochondrial DNA (mtDNA or mDNA) is the DNA located in the mitochondria.
They are double stranded circular DNA molecule.
It is only 16 kb in length – contains 16,600 bp.
It is haploid in nature.
It codes for 37 genes.
13 genes provide instructions for making enzymes involved in oxidative phosphorylation.
It is a process that uses oxygen and simple sugars to create ATP, the cells main energy source.
Introduction
History
Genetic mapping
DNA Markers
Physical mapping
Importance
Drawback
Conclusion
References
uses genetic techniques to construct maps showing the positions of genes and other sequence features on a genome.
Genetic techniques include cross-breeding experiments or, in the case of humans, the examination of family histories (pedigrees).
Gene mapping | Genetic map | Physical Map | DNA Data Analysis (upgraded)NARC, Islamabad
Genes are useful markers but not ideal.
Mapped feature that are not genes are called DNA markers.
DNA markers must have at least two alleles to be useful.
DNA sequence features that satisfy this requirement are-
– Restriction Fragment Length Polymorphism (RFLP)
Southern hybridization
PCR
– Simple Sequence Length Polymorphism (SSLP)
– Single Nucleotide Polymorphism (SNP)
Mapping- determining the location of elements with in a genome, with respect to identifiable land marks.
Gene mapping describes the methods used to identify the locus of a gene and the distances between genes.
In simple mapping of genes to specific locations on chromosomes.
Two types
Genetic map
Physical Map
They are useful in predicting results of dihybrid and trihybrid crosses.
It allows geneticists to understand the overall complexity and genetic organization of a particular species.
Identify genes responsible for diseases.
Identify genes responsible for traits.
genetic maps are useful from an evolutionary point of view.
Course: Bioinformatics for Biomedical Research (2014).
Session: 4.1- Introduction to RNA-seq and RNA-seq Data Analysis.
Statistics and Bioinformatisc Unit (UEB) & High Technology Unit (UAT) from Vall d'Hebron Research Institute (www.vhir.org), Barcelona.
Gene mapping / Genetic map vs Physical Map | determination of map distance a...NARC, Islamabad
Mapping- determining the location of elements with in a genome, with respect to identifiable land marks.
Gene mapping describes the methods used to identify the locus of a gene and the distances between genes.
In simple mapping of genes to specific locations on chromosomes.
Two types
Genetic map
Physical Map
Construction of a Linkage Map or Genetic Mapping
1. DNA MARKERS FOR GENETIC MAPPING
– Restriction Fragment Length Polymorphism (RFLP)
– Simple Sequence Length Polymorphism (SSLP)
– Single Nucleotide Polymorphism (SNP)
2. Determination of Linkage Groups(No. of Chromosomes)
Dihybrid cross
Trihybrid cross
3. Determination of Map Distance
Recombination fraction
4. Determination of Gene Order
5. Combining Map Segments
Journal club slides for "Detection of structural DNA variation from next generation sequencing data: a review of informatic approaches" and a description of the software pipeline digit
QTL MAPPING AND APPROACHES IN BIPARENTAL MAPPING POPULATIONS.pptxPABOLU TEJASREE
• The loci controlling quantitative traits are called quantitative trait loci or QTL.
• Term first coined by Gelderman in 1975.
Principles of QTL mapping
• Genes and markers segregate via chromosome recombination during meiosis, thus allowing their analysis in the progeny.
• The detection of association between phenotype and genotype of markers.
• QTL analysis depends on the linkage disequilibrium.
• QTL analysis is usually undertaken in segregating mapping populations.
Key steps for the QTL mapping
• Collection of parental strains that differ for traits of interest
• Selection of molecular markers such as RFLP, SSR and SNP that distinguish between the two parents
• Development of a mapping population
• Genotyping and phenotyping of the mapping population
• Detection of QTL using a suitable statistical method
• For practical purposes, in general recombination events considered to be less than 10 recombinations per 100 meiosis, or a map distance of less than 10 centi Morgans(cM).
Virulence gene typing and its Applications in Genetic EngineeringBita Rahmani
Short class presentation on Virulence gene typing and its Applications in Genetic Engineering. Gives an overview on the subjects and briefly points out and explains current well-known applications in field of gene typing.
November 17.
Genetic Markers and their importance in ForensicsMrinal Vashisth
A description of Genetic Markers and their applications with focus on Forensic Analysis. Complimentary methods such as RNA Profiling are also discussed.
Dr. S. MANIKANDAN, M.Sc., Ph.D
Lecturer in Botany
Thiruvalluvar University Model Constituent College,
Tittagudi 606 106, Tamil Nadu, India.
Email id: drgsmanikandan@gmail.com
Introduction:
Proposed by Meuwissen et al. (2001)
GS is a specialized form of MAS, in which information from genotype data on marker alleles covering the entire genome forms the basis of selection.
The effects associated with all the marker loci, irrespective of whether the effects are significant or not, covering the entire genome are estimated.
The marker effect estimates are used to calculate the genomic estimated breeding values (GEBVs) of different individuals/lines, which form the basis of selection.
Why to go for genomic selection:
Marker-assisted selection (MAS) is well-suited for handling oligogenes and quantitative trait loci (QTLs) with large effects but not for minor QTLs.
MARS attempts to take into account small effect QTLs by combining trait phenotype data with marker genotype data into a combined selection index.
Based on markers showing significant association with the trait(s) and for this reason has been criticized as inefficient
The genomic selection (GS) scheme was to rectify the deficiency of MAS and MARS schemes. The GS scheme utilizes information from genome-wide marker data whether or not their associations with the concerned trait(s) are significant.
GEBV: GenomicEstimated Breeding Values-
The sum total of effects associated with all the marker alleles present in the individual and included in the GS model applied to the population under selection
Calculated on a single individual basis
Gene-assisted genomic selection:
A GS model that uses information about prior known QTLs, the targeted QTLs were accumulated in much higher frequencies than when the standard ridge regression was used
The sum total of effects associated with all the marker alleles present in the individual and included in the GS model applied to the population under selection
Calculated on a single individual basis
Population used:
Training population: used for training of the GS model and for obtaining estimates of the marker-associated effects needed for estimation of GEBVs of individuals/lines in the breeding population.
Breeding population: the population subjected to GS for achieving the desired improvement and isolation of superior lines for use as new varieties/parents of new improved hybrids.
Training population-
large enough: must be representative of the breeding population: max. trait variance with marker : by cluster analysis
should have either equal or comparable LD, LD decay rates with breeding populations
Updated by including individuals/lines from the breeding population
Training more than one generation
Low colinearity between markers is needed since high colinearity tends to reduce prediction accuracy of certain GS models. (colinearity disturbed by recombination)
Palestine last event orientationfvgnh .pptxRaedMohamed3
An EFL lesson about the current events in Palestine. It is intended to be for intermediate students who wish to increase their listening skills through a short lesson in power point.
Biological screening of herbal drugs: Introduction and Need for
Phyto-Pharmacological Screening, New Strategies for evaluating
Natural Products, In vitro evaluation techniques for Antioxidants, Antimicrobial and Anticancer drugs. In vivo evaluation techniques
for Anti-inflammatory, Antiulcer, Anticancer, Wound healing, Antidiabetic, Hepatoprotective, Cardio protective, Diuretics and
Antifertility, Toxicity studies as per OECD guidelines
Read| The latest issue of The Challenger is here! We are thrilled to announce that our school paper has qualified for the NATIONAL SCHOOLS PRESS CONFERENCE (NSPC) 2024. Thank you for your unwavering support and trust. Dive into the stories that made us stand out!
Macroeconomics- Movie Location
This will be used as part of your Personal Professional Portfolio once graded.
Objective:
Prepare a presentation or a paper using research, basic comparative analysis, data organization and application of economic information. You will make an informed assessment of an economic climate outside of the United States to accomplish an entertainment industry objective.
Instructions for Submissions thorugh G- Classroom.pptxJheel Barad
This presentation provides a briefing on how to upload submissions and documents in Google Classroom. It was prepared as part of an orientation for new Sainik School in-service teacher trainees. As a training officer, my goal is to ensure that you are comfortable and proficient with this essential tool for managing assignments and fostering student engagement.
Unit 8 - Information and Communication Technology (Paper I).pdfThiyagu K
This slides describes the basic concepts of ICT, basics of Email, Emerging Technology and Digital Initiatives in Education. This presentations aligns with the UGC Paper I syllabus.
The Roman Empire A Historical Colossus.pdfkaushalkr1407
The Roman Empire, a vast and enduring power, stands as one of history's most remarkable civilizations, leaving an indelible imprint on the world. It emerged from the Roman Republic, transitioning into an imperial powerhouse under the leadership of Augustus Caesar in 27 BCE. This transformation marked the beginning of an era defined by unprecedented territorial expansion, architectural marvels, and profound cultural influence.
The empire's roots lie in the city of Rome, founded, according to legend, by Romulus in 753 BCE. Over centuries, Rome evolved from a small settlement to a formidable republic, characterized by a complex political system with elected officials and checks on power. However, internal strife, class conflicts, and military ambitions paved the way for the end of the Republic. Julius Caesar’s dictatorship and subsequent assassination in 44 BCE created a power vacuum, leading to a civil war. Octavian, later Augustus, emerged victorious, heralding the Roman Empire’s birth.
Under Augustus, the empire experienced the Pax Romana, a 200-year period of relative peace and stability. Augustus reformed the military, established efficient administrative systems, and initiated grand construction projects. The empire's borders expanded, encompassing territories from Britain to Egypt and from Spain to the Euphrates. Roman legions, renowned for their discipline and engineering prowess, secured and maintained these vast territories, building roads, fortifications, and cities that facilitated control and integration.
The Roman Empire’s society was hierarchical, with a rigid class system. At the top were the patricians, wealthy elites who held significant political power. Below them were the plebeians, free citizens with limited political influence, and the vast numbers of slaves who formed the backbone of the economy. The family unit was central, governed by the paterfamilias, the male head who held absolute authority.
Culturally, the Romans were eclectic, absorbing and adapting elements from the civilizations they encountered, particularly the Greeks. Roman art, literature, and philosophy reflected this synthesis, creating a rich cultural tapestry. Latin, the Roman language, became the lingua franca of the Western world, influencing numerous modern languages.
Roman architecture and engineering achievements were monumental. They perfected the arch, vault, and dome, constructing enduring structures like the Colosseum, Pantheon, and aqueducts. These engineering marvels not only showcased Roman ingenuity but also served practical purposes, from public entertainment to water supply.
Operation “Blue Star” is the only event in the history of Independent India where the state went into war with its own people. Even after about 40 years it is not clear if it was culmination of states anger over people of the region, a political game of power or start of dictatorial chapter in the democratic setup.
The people of Punjab felt alienated from main stream due to denial of their just demands during a long democratic struggle since independence. As it happen all over the word, it led to militant struggle with great loss of lives of military, police and civilian personnel. Killing of Indira Gandhi and massacre of innocent Sikhs in Delhi and other India cities was also associated with this movement.
1. Linkage Analysis and Genotyping
Analysis
Represented By – Usha
M.Sc. Bioinformatics
Submitted to – Dr. Nisha Singh
2. Linkage
• Genetic linkage describes the way in which
two genes that are located close to each other
on a chromosome are often inherited
together
• Genes on the same chromosome are said to
be exhibit linkage and are called linked genes
• Linkage is based on crossing over frequency
4. Types of linkage
On the basis of Crossing over
• Complete Linkage - The genes located on the
same chromosome do not separate and are
inherited together over the generations due to
the absence of crossing over
• Incomplete Linkage - Genes present in the same
chromosome have a tendency to separate due to
crossing over and hence produce recombinant
progeny besides the parental type
5. Linkage Analysis
• Genetic Linkage Analysis is a power tool to
detect the chromosomal locations of diseases
genes
• Statistical method for mapping heritable trait
genes to their chromosome locations
7. Recombination Fraction
• Probability of a marker and a susceptibility
locus segregating independently(may be
represented as θ)
• Ratio of the number of recombined gametes
to the total number of gametes produced
• If θ = 0.5 No linkage
• If θ < 0.5 Linkage
8. LOD scores
• Statistical measure of the likelihood of genetic
linkage between two loci
• Test to compare the likelihood that two loci
are linked, vs. the likelihood that the two loci
are unlinked
• LOD – logarithm of the odd
10. LOD score
• LOD calculations:
• LOD(Z) = log10 = probability of birth
sequences with a given linkage/probability of
birth sequences with no linkage
• A LOD score, higher than 3.0 is generally
accepted as evidence for linkage
• A LOD score lower than -2.0 is accepted as
evidence against linkage
11. Mapping functions
• Mapping functions are used to translate
recombination fractions into genetic distances
• A genetic map function M gives a relations i.e.
r = M(d), connecting recombination fraction r
and genetic map
12. Haldane’s Mapping functions
According to Haldane’s
dM = -1/2ln(1-2r) where
• dM is the distance between marker loci,
• r is the recombination frequency,
• dM is expressed in Morgan, so
• r = ½(1-exp (-2dM))
13. Tool for Linkage Analysis
• JoinMap
• Vitesse
• MAPMAKER
• HOMOG
• LOT
• LInkageMapView
14. Genotyping
• Process of determining differences between
genotype of individuals by examining DNA
sequences
• Genotyping enables researchers to explore
genetic variants such as single nucleotide
polymorphisms (SNPs) and large structural
changes in DNA
16. Whole genome Genotyping
• Whole-genome genotyping provides an
overview of the entire genome, enabling
genome-wide discoveries and associations
• Include high-throughput next-generation
sequencing (NGS) and microarray
technologies
17. Targeted Genotyping
• Allows researchers to focus time and expenses
on specific regions of interest
• Generates a smaller, more manageable data
set, thereby reducing data analysis burdens
• Offers a cost-effective solution with reduced
turnaround time compared to broader
approaches
18. Custom genotyping
• Allows researchers to focus on genes, variants,
and/or genomic regions of interest relevant to
certain diseases or traits of interest, but not
covered in pre-designed products
• Conserves resources by avoiding irrelevant
regions of the genome
19. CNV Analysis
• Copy number variations (CNVs) are genomic
alterations that result in an abnormal number
of copies of one or more genes
21. Approaches to visualize genetic
Alterations
• Enzymatic Approaches for Discriminations of
Allelic Variants
RFLP
AFLP
• Electrophoretic Discriminations of Allelic Variants
SSCP
High performance DNA sequencing
• Solid-Phase Determinations of allelic Variants
Oligonucleotide arrays
22. Approaches to visualize genetic
Alterations
• Chromatographic methods for discriminations of
Allelic Variants
DHPLC(Denaturing high performance liquid
chromatography)
• Physical methods for Discriminations of Allelic
Variants
Differential sequencing with mass spectrometry
Fluorescence exchange based methods
• In-Silico – Analyzing EST Data