Downloaded 198 times


![Supply Chain Insights LLC Copyright © 2015, p. 49
0
0
0
0
0
0
0
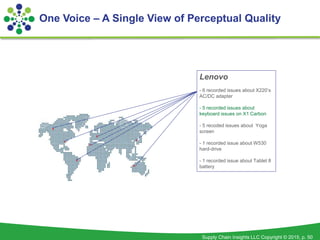
Canada
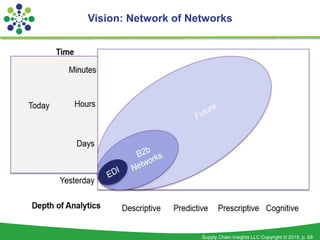
-Customer A calls about a blue screen on a Yoga
-Customer B posts on Facebook about his X220’s AC/DC adapter issues
Large Enterprise Client experiences 5 keyboard malfunctions in their latest
shipment. Complaints received through account executive
[Critical Situation]
Brazil
-Customer F submits a service from on
esupport.lenovo.com regarding
their W530 hard drive
Morocco
-Customers G & H comment on their
X220’s electrical issues on Twitter.com
-Customer I called about Yoga screen
issues
Australia
-Customer J write a review on
NewEgg.com about AC/DC adapter
issues on X220
-Customer K had an eChat with Lenovo
about Yoga screen issues
China
-Customer L wrote on Weibo about
Yoga screen issues
-Customer M calls about a Tablet 8
battery issues
Voice of Customer Comes in Many Forms
USA
-Customers C & D write X220 product
reviews on amazon.com and mention
issues with AC/DC adapters
-Customer E posts on
forums.lenovo.com that they are
experiencing blue screens on their Yoga](https://image.slidesharecdn.com/futureofsupplychaintechnologieseyeonpresentationrotterdamnovember7-151102165922-lva1-app6891/85/Future-of-Supply-Chain-Technologies-49-320.jpg)


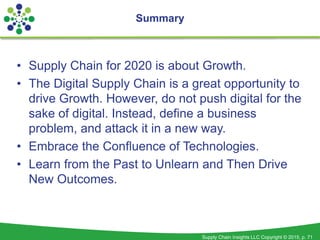


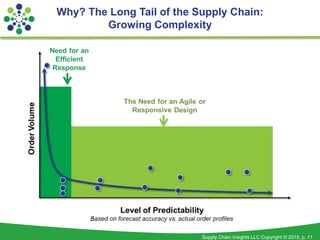
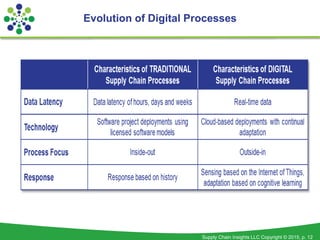
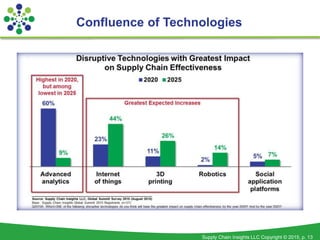
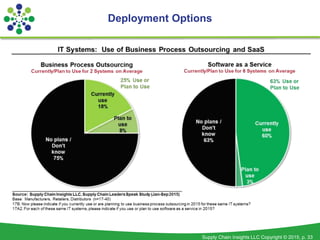
The document discusses predictions and trends for the future of supply chain technologies, emphasizing the importance of designing responsive systems that learn and adapt over time. It analyzes various industries' performance metrics from 2006 to 2013, highlighting the challenges and opportunities within supply chains, such as growing demand volatility and the integration of new digital processes. The text also underscores the necessity of addressing business problems with strategic digital solutions rather than adopting technology for its own sake.