Downloaded 173 times


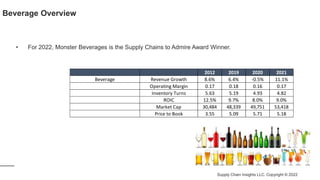
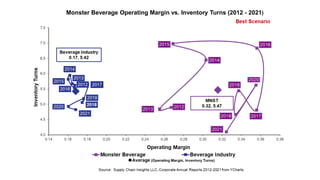
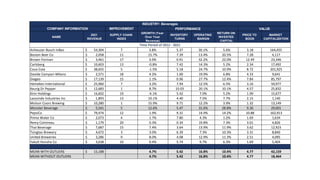

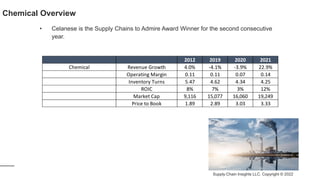


The document analyzes the Supply Chains to Admire Award, focusing on 460 publicly-traded companies across various industries from 2012 to 2021, identifying 25 companies that excelled in supply chain performance. It highlights the methodology for evaluating supply chain excellence, emphasizing improvements in growth, operating margins, inventory turns, and return on invested capital. The findings aim to provide objective benchmarking for supply chain leaders to enhance organizational performance and financial understanding.


![[Cello Plus_PT] Cello Introduction_Eng](https://cdn.slidesharecdn.com/ss_thumbnails/c0738428-171f-4b70-bb34-dc4f675d5222-150930090635-lva1-app6892-thumbnail.jpg?width=640&height=640&fit=bounds)