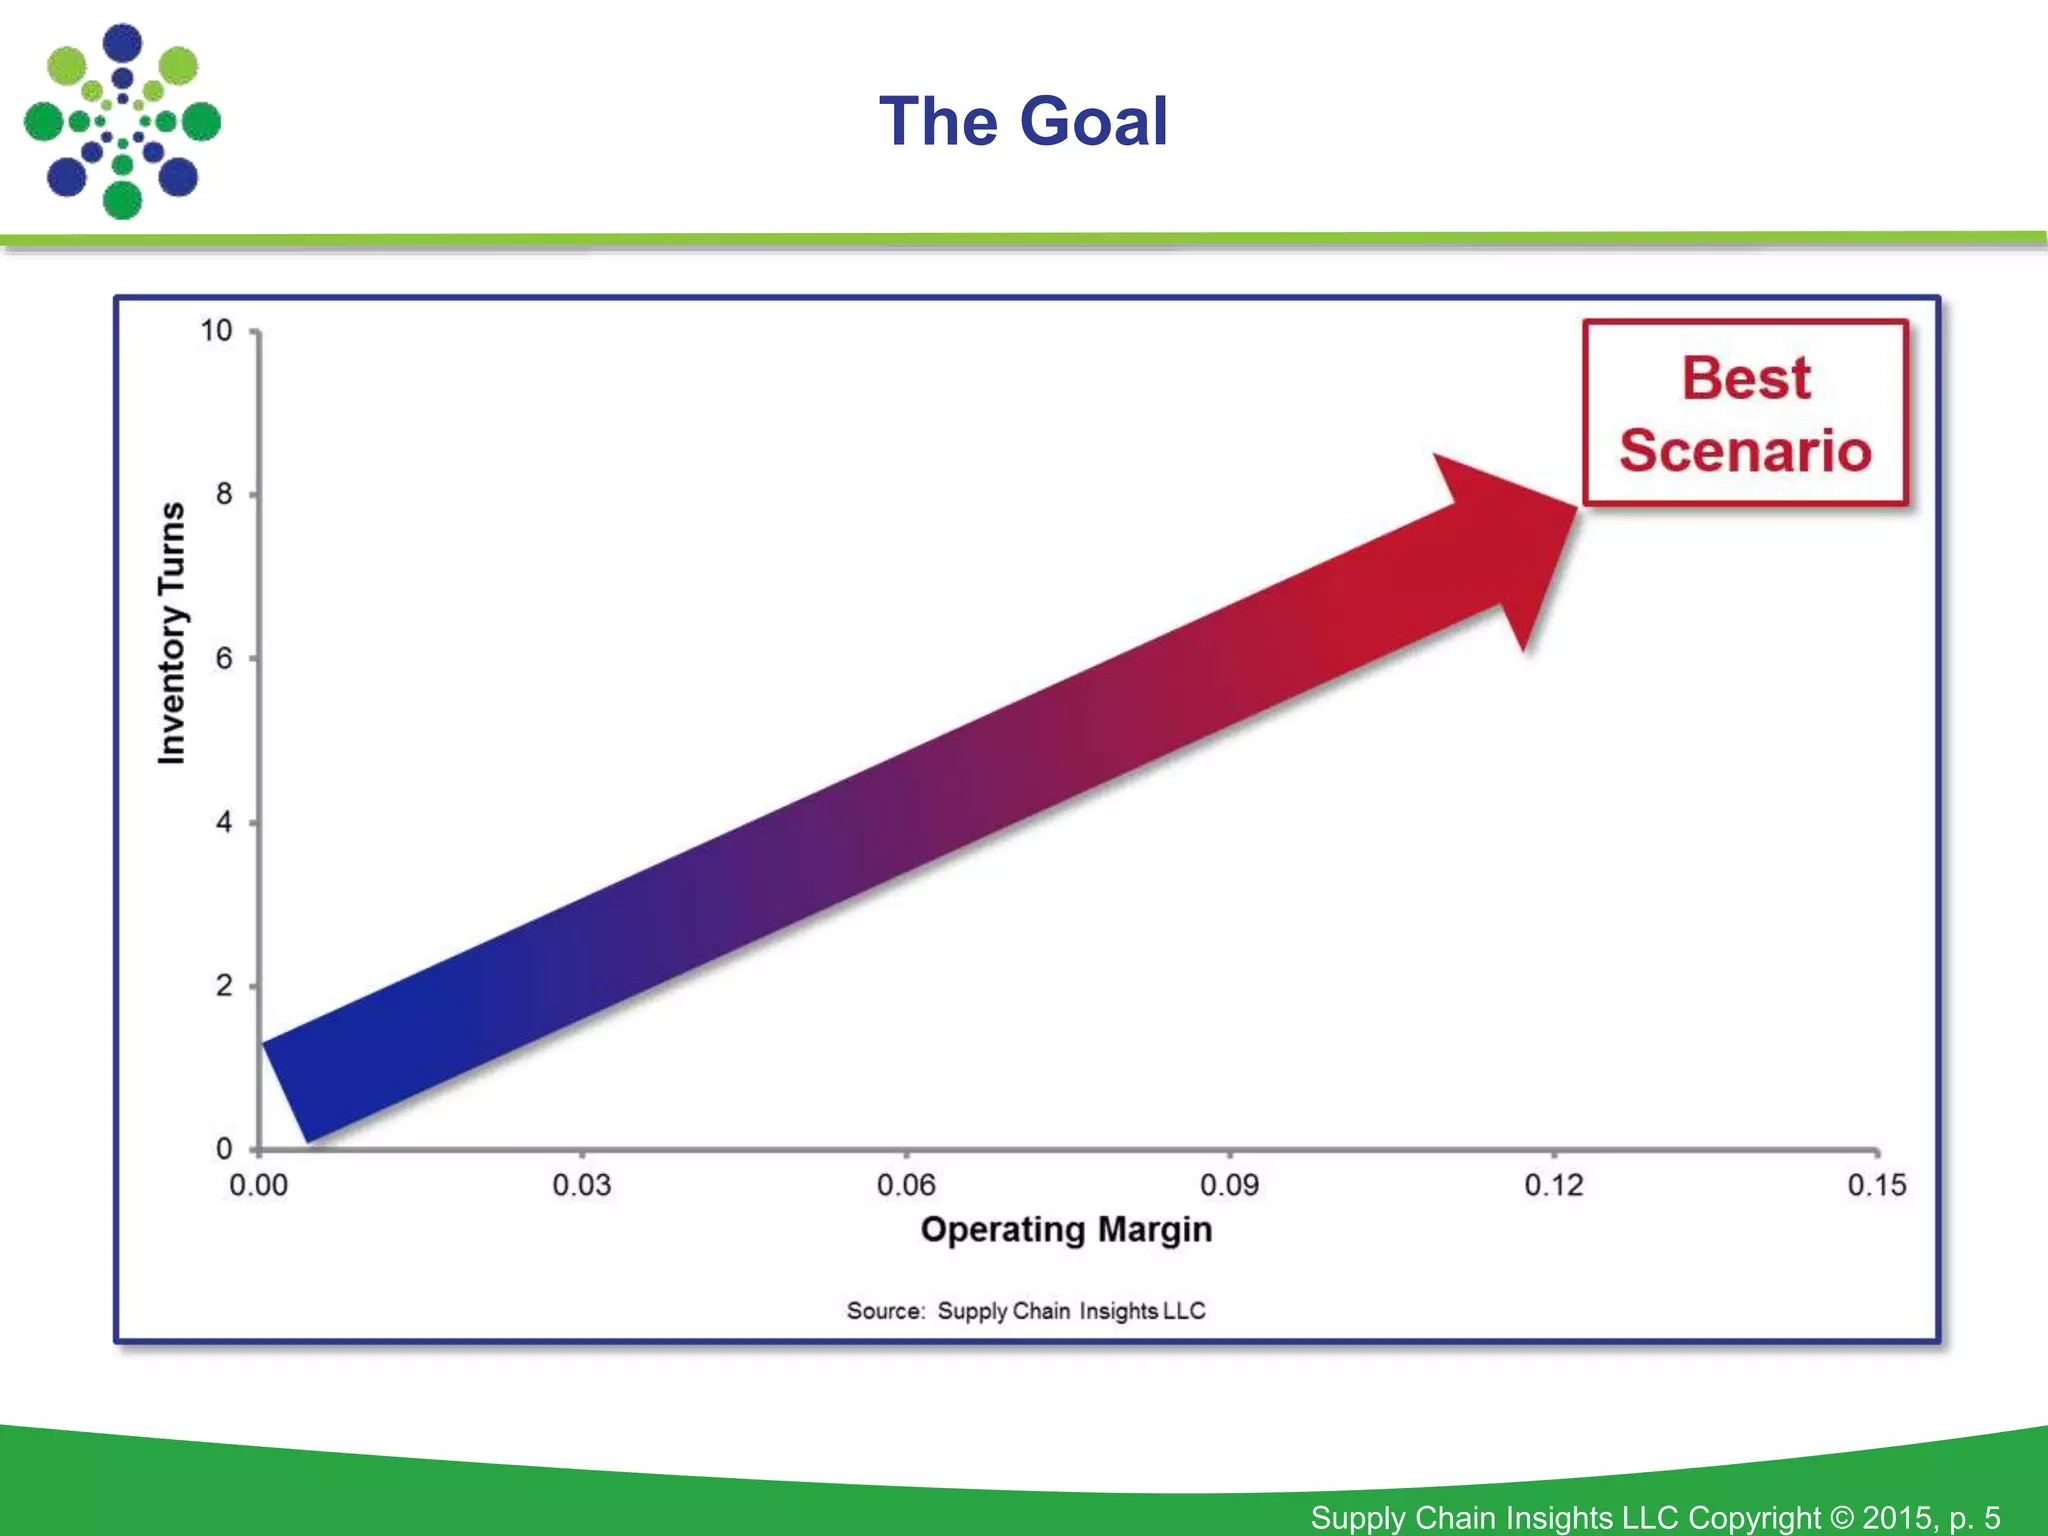
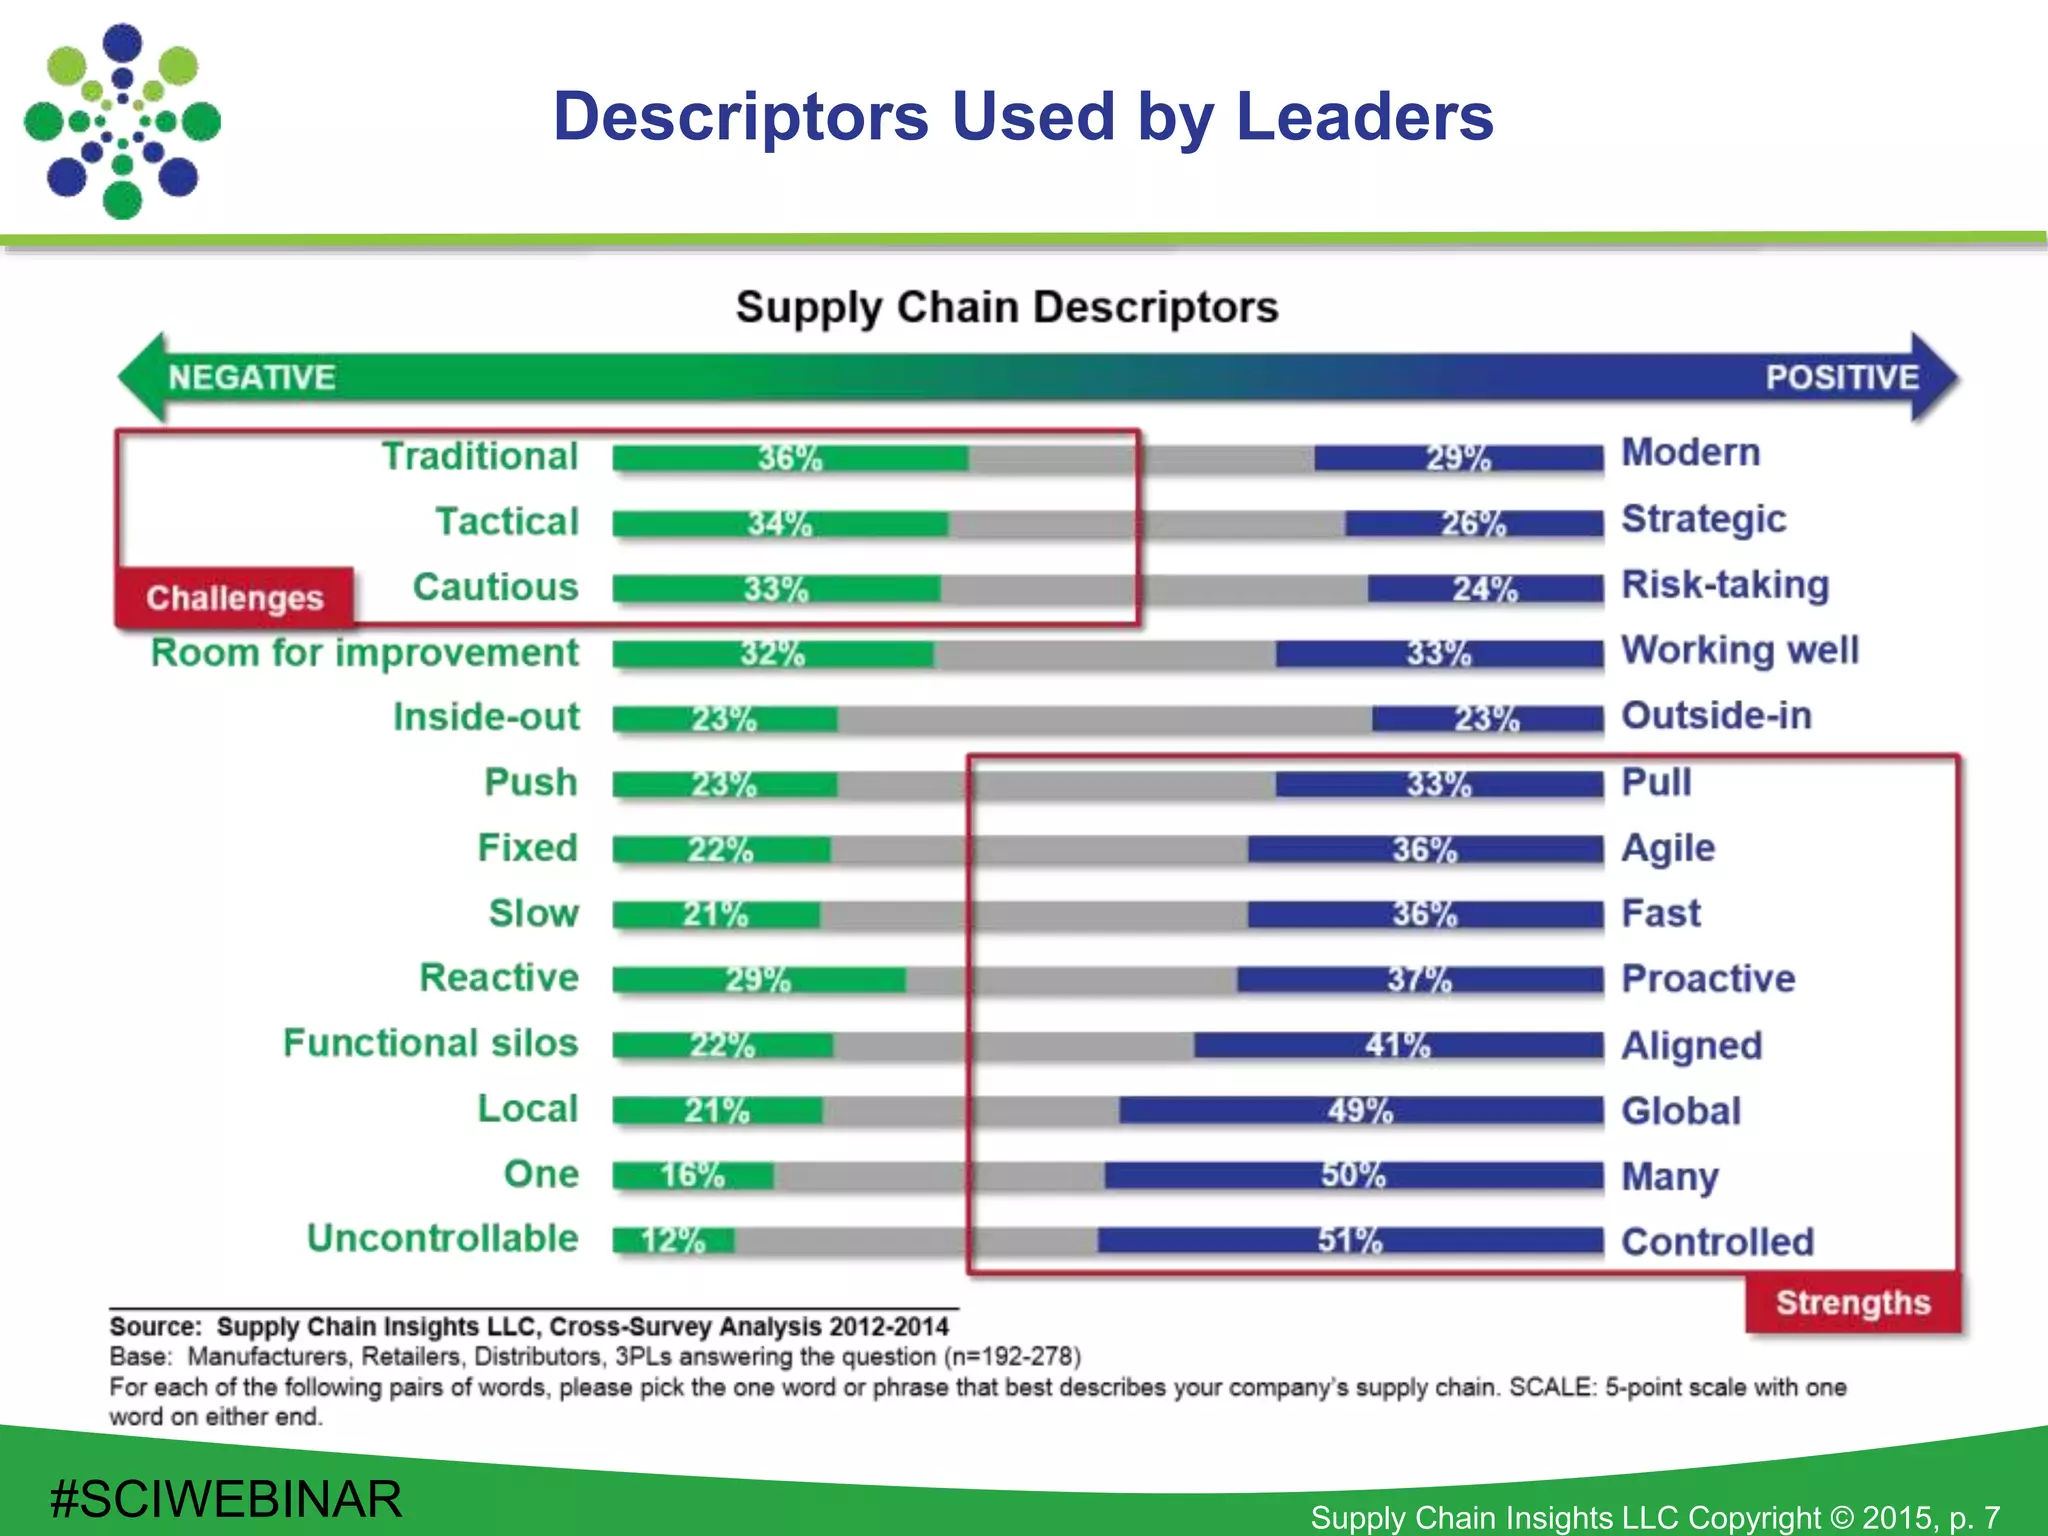
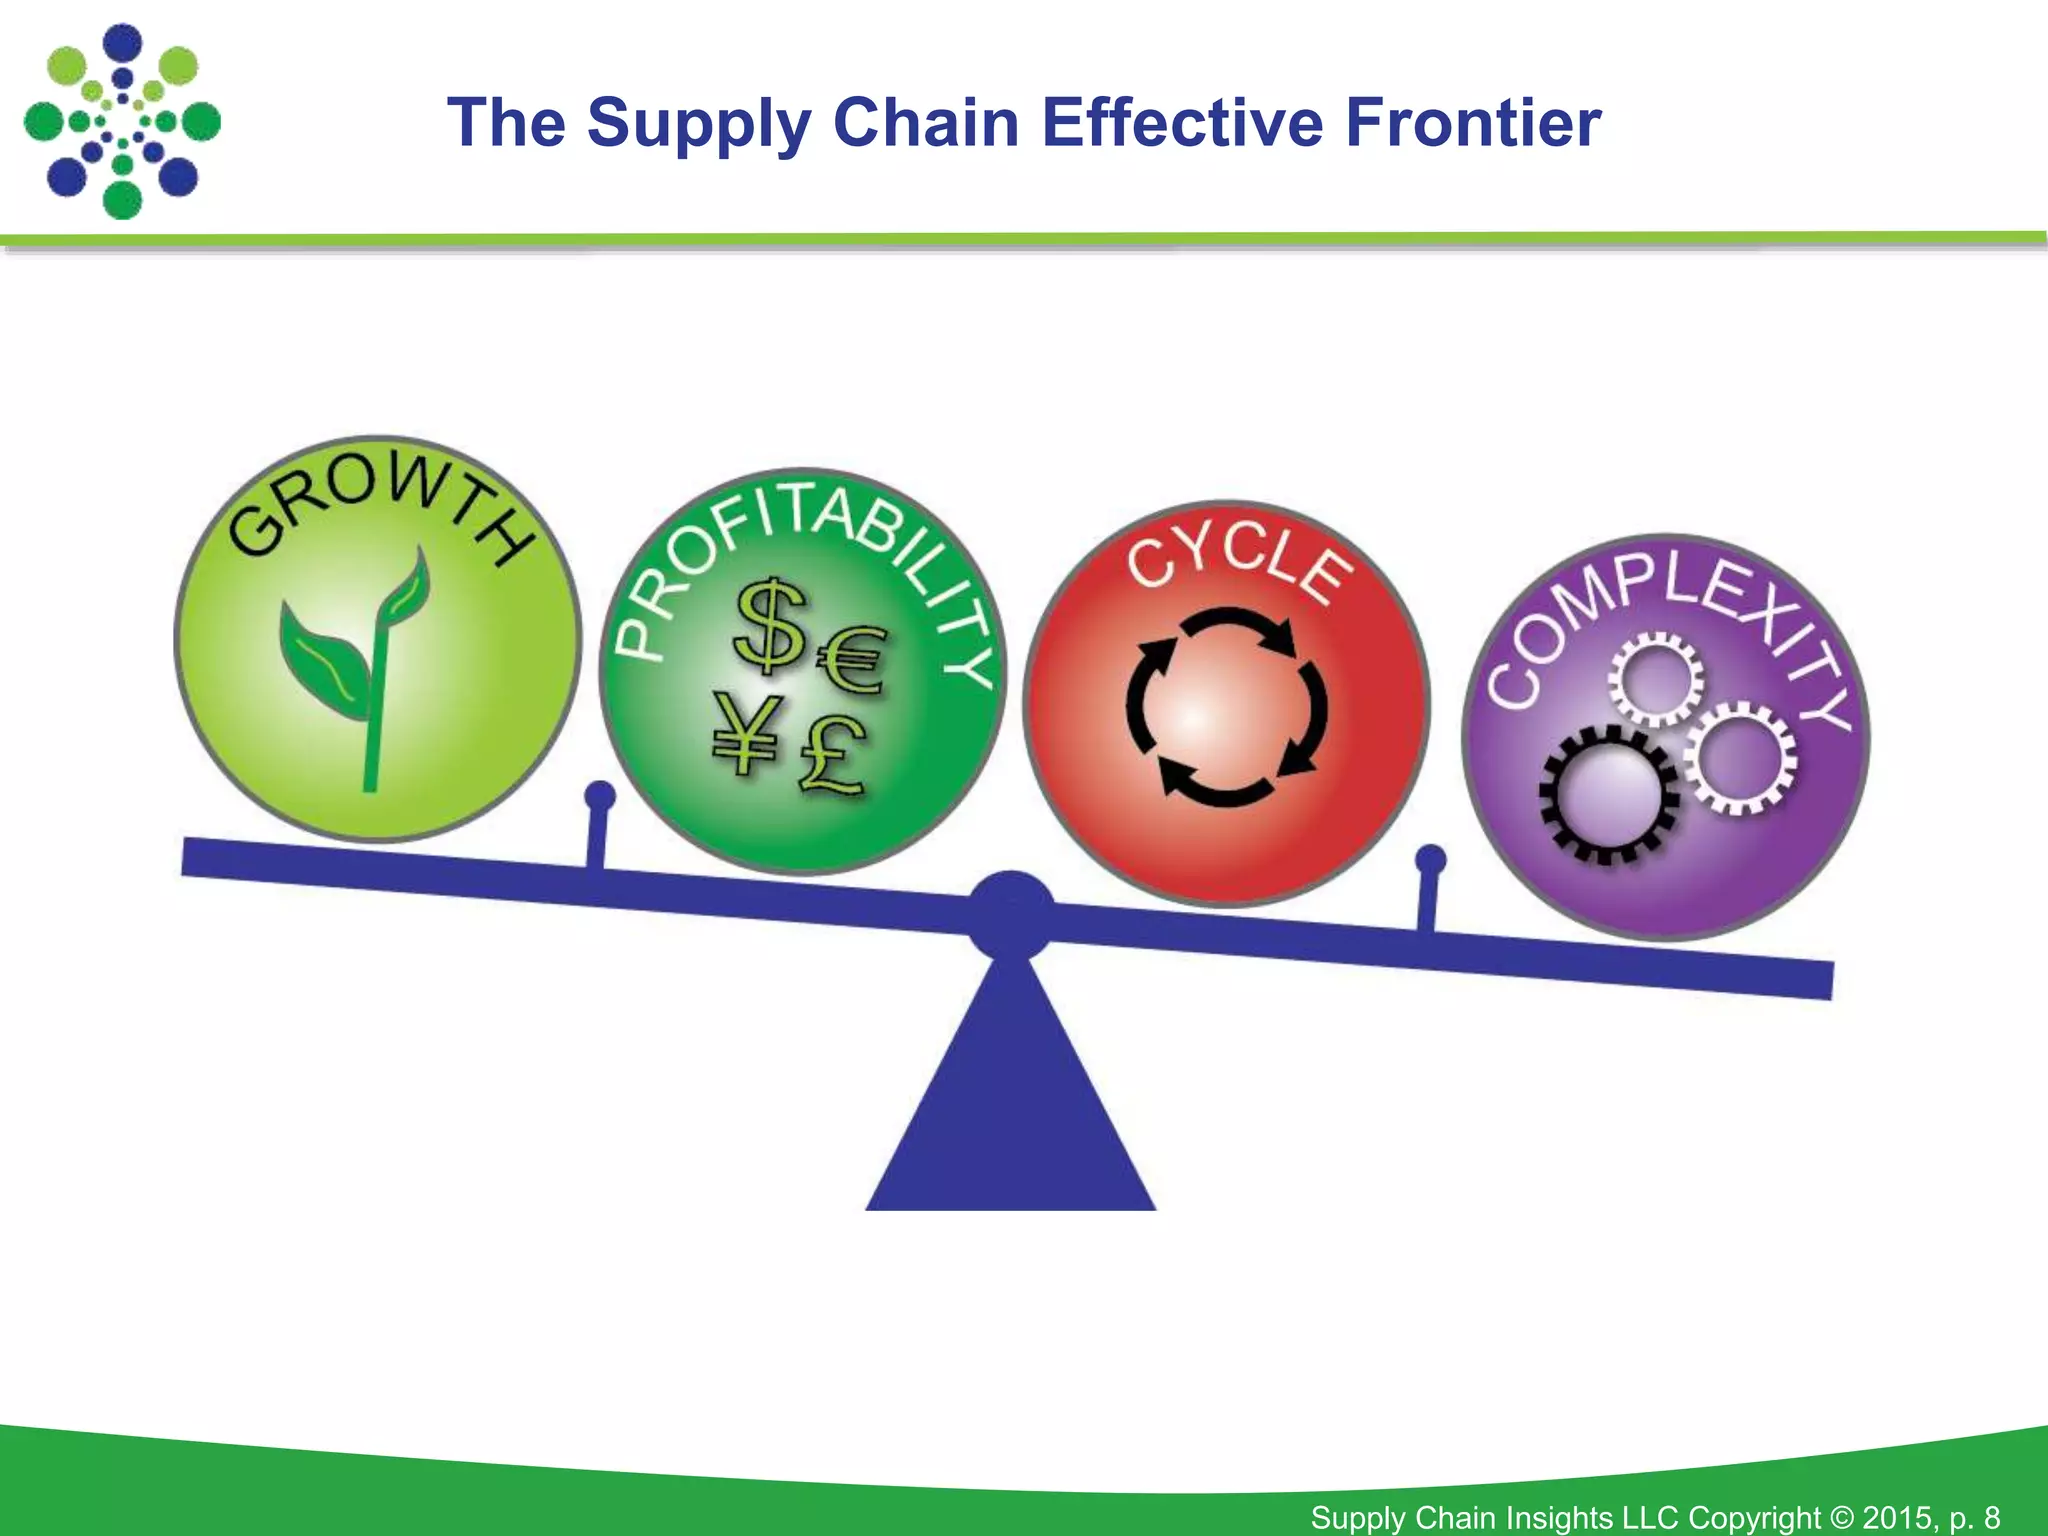
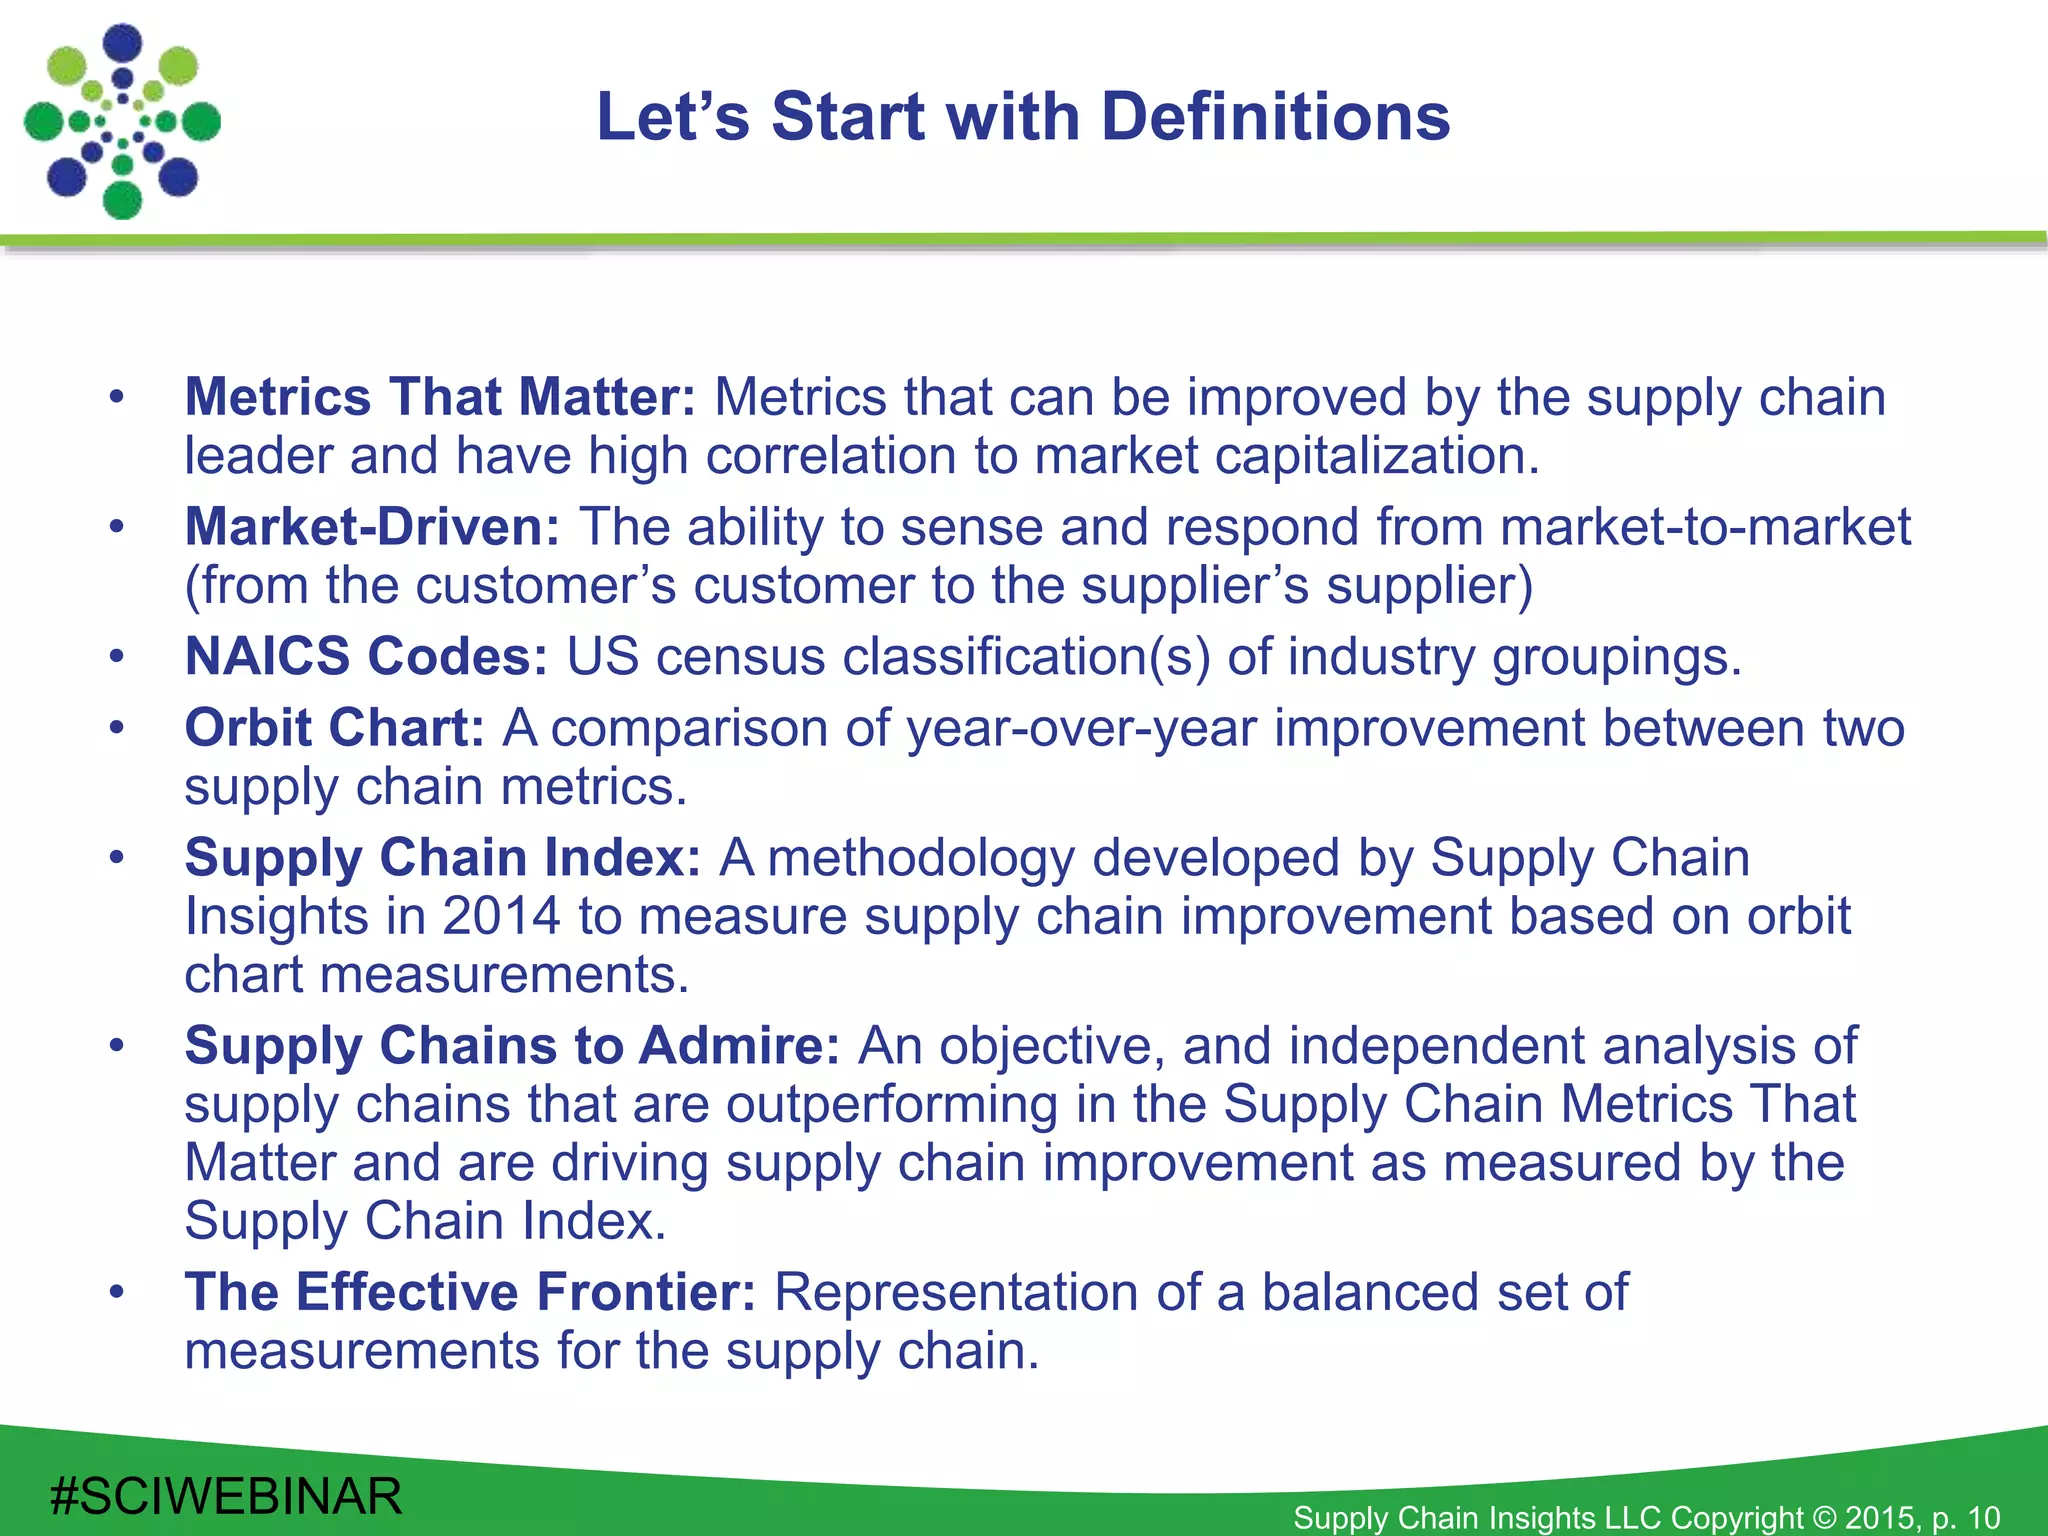
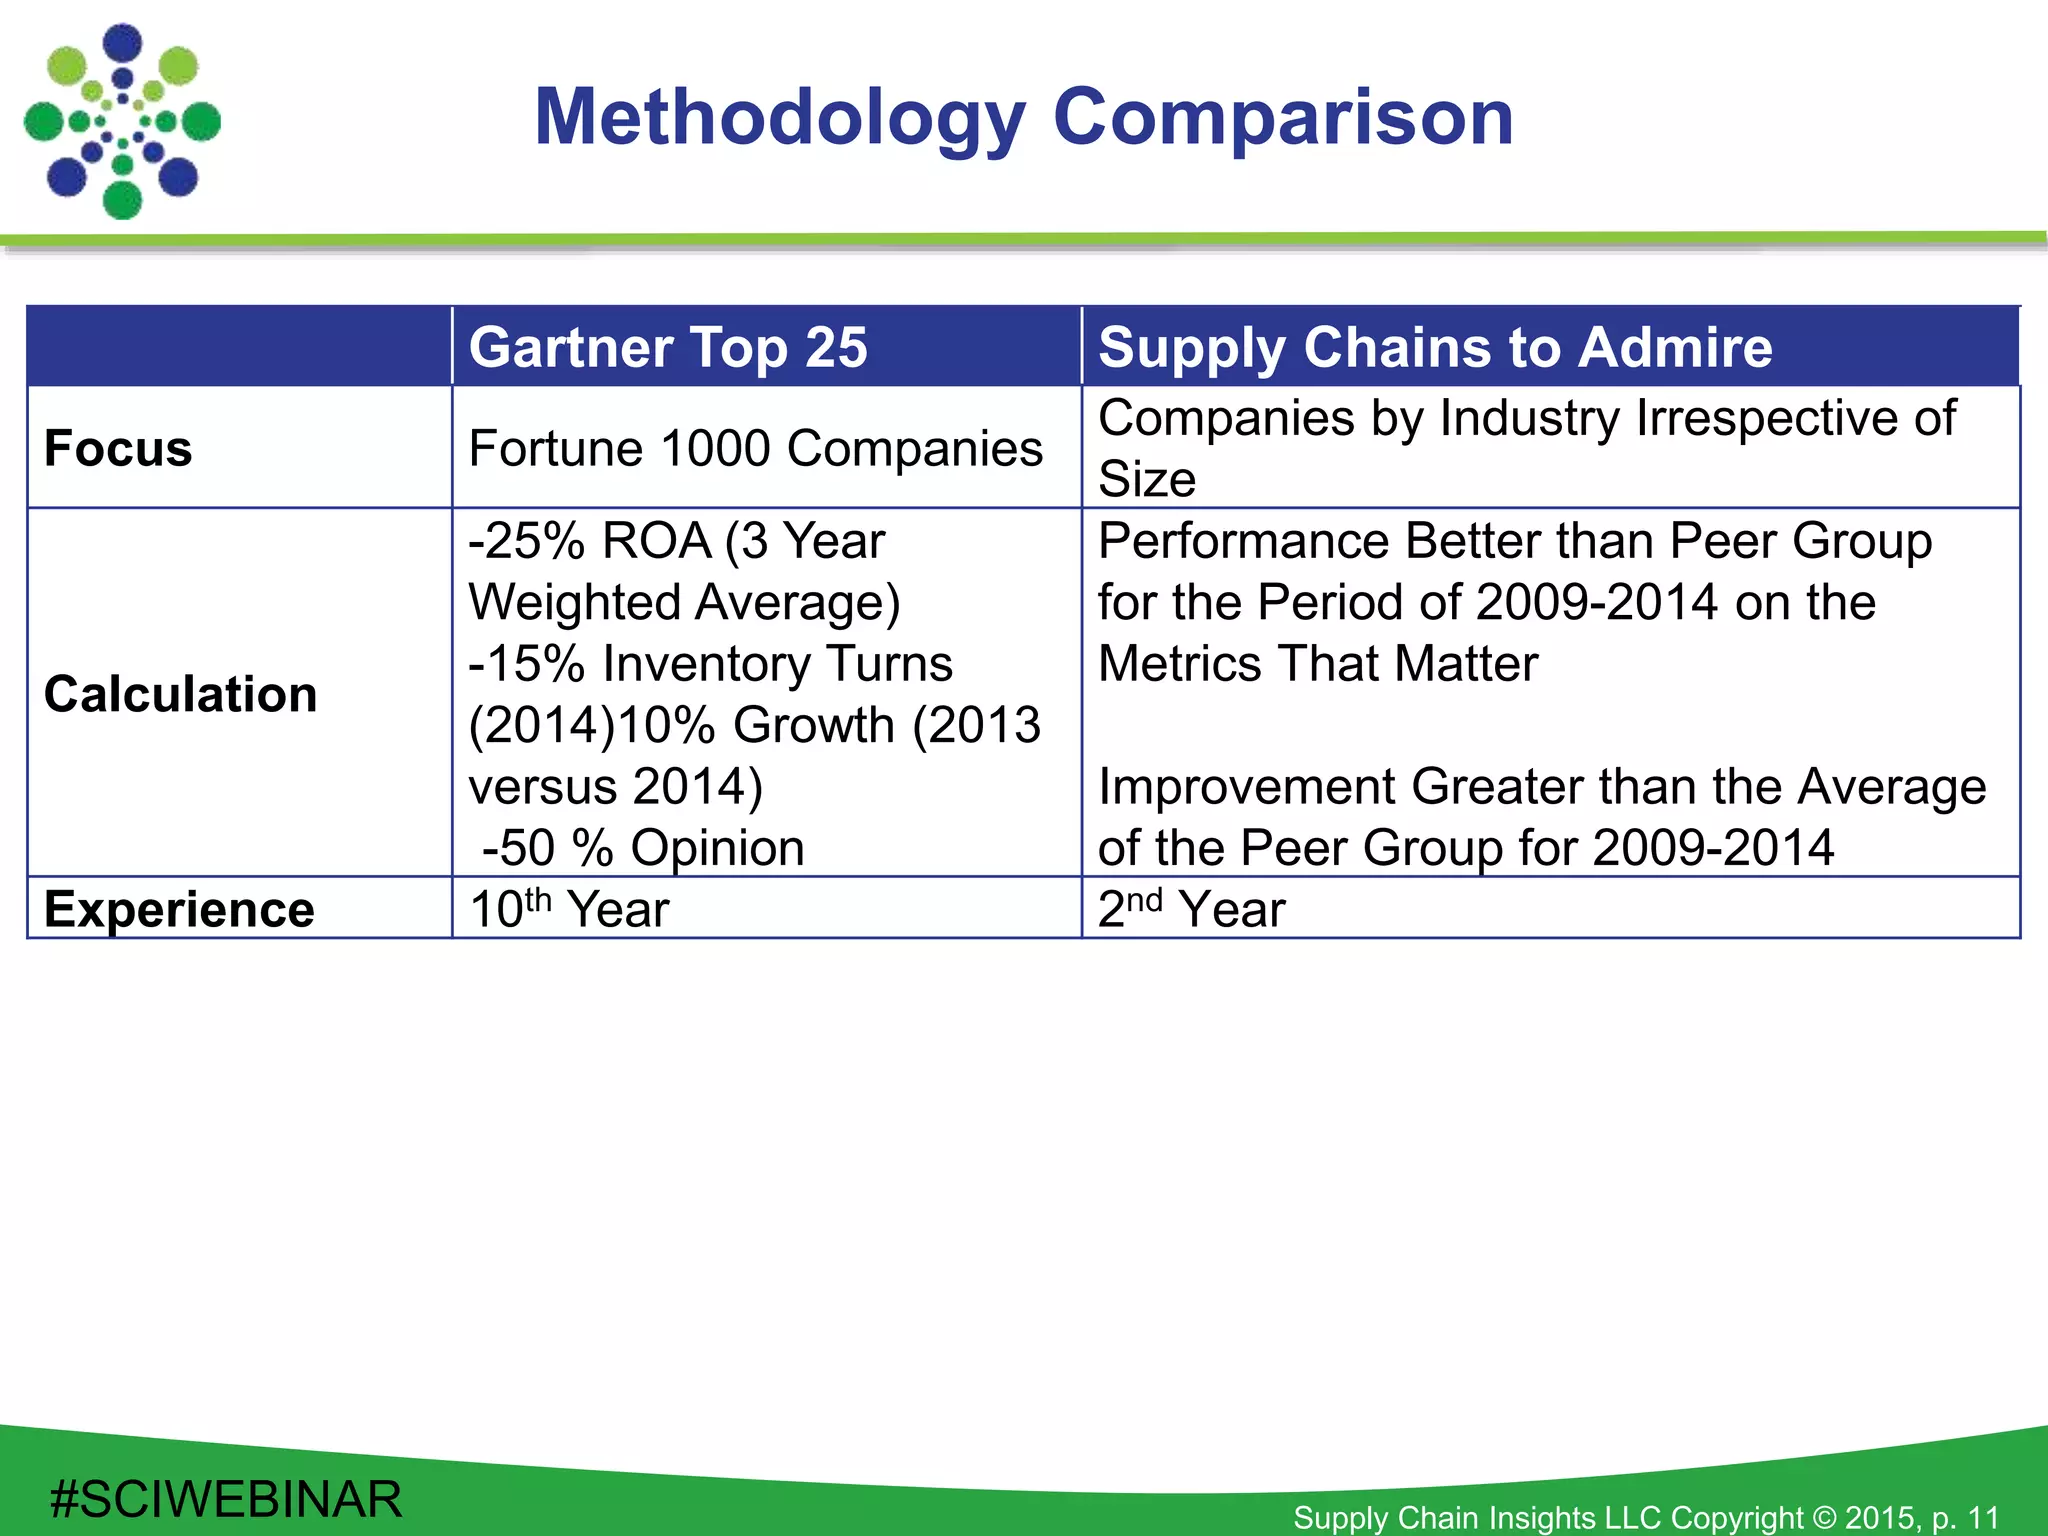
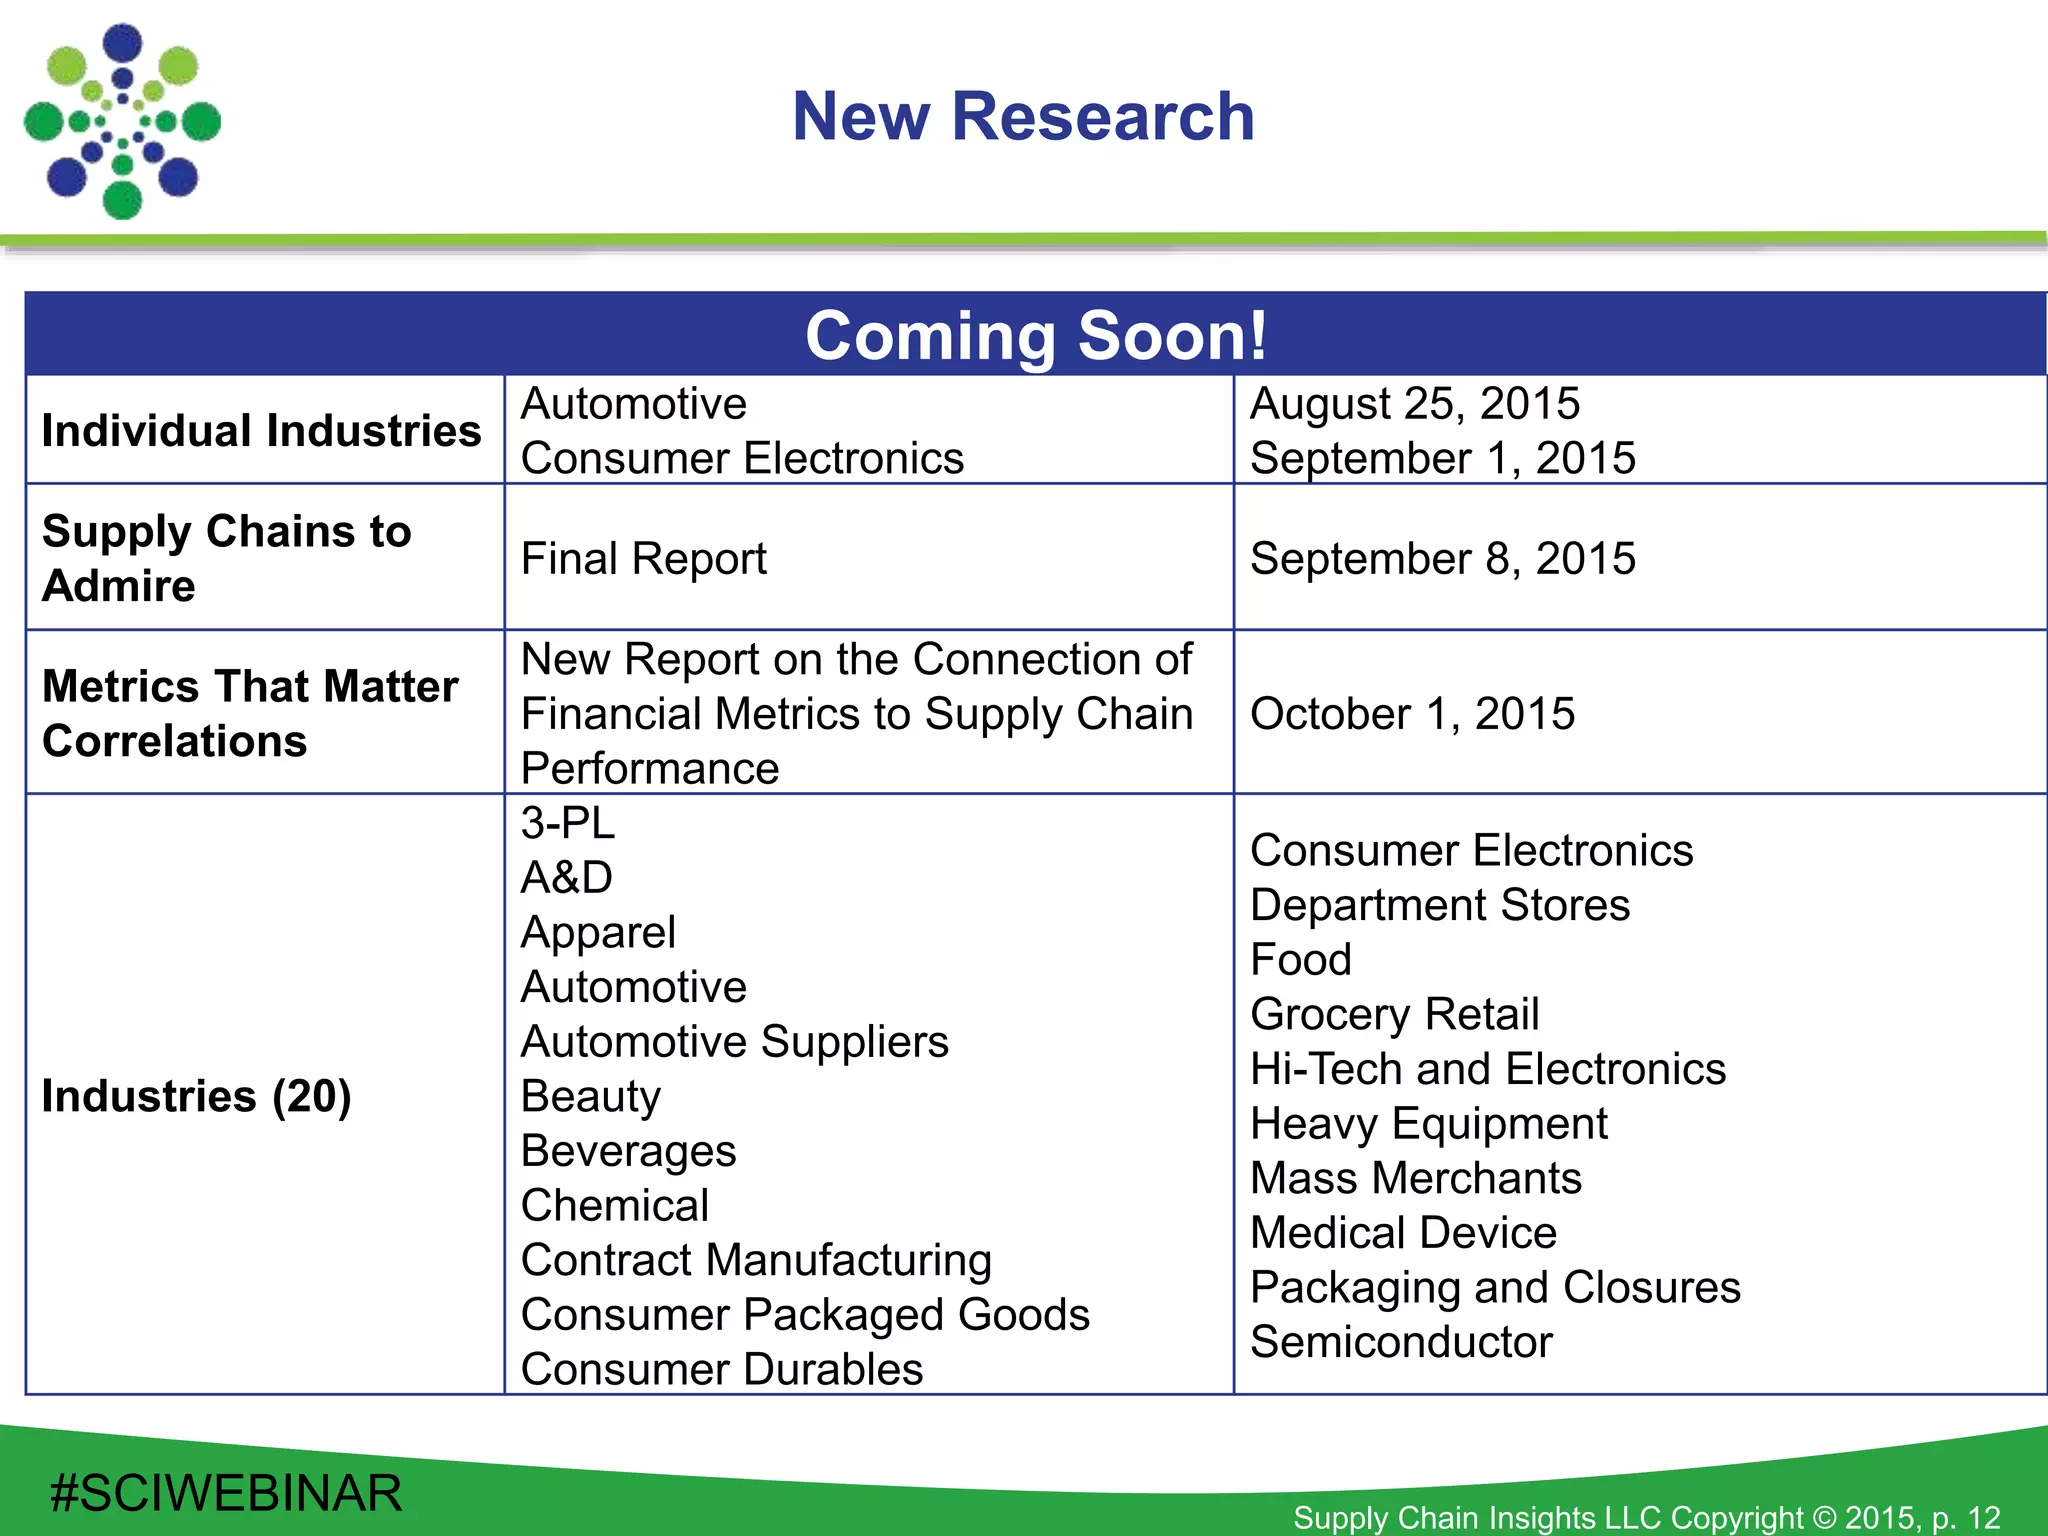
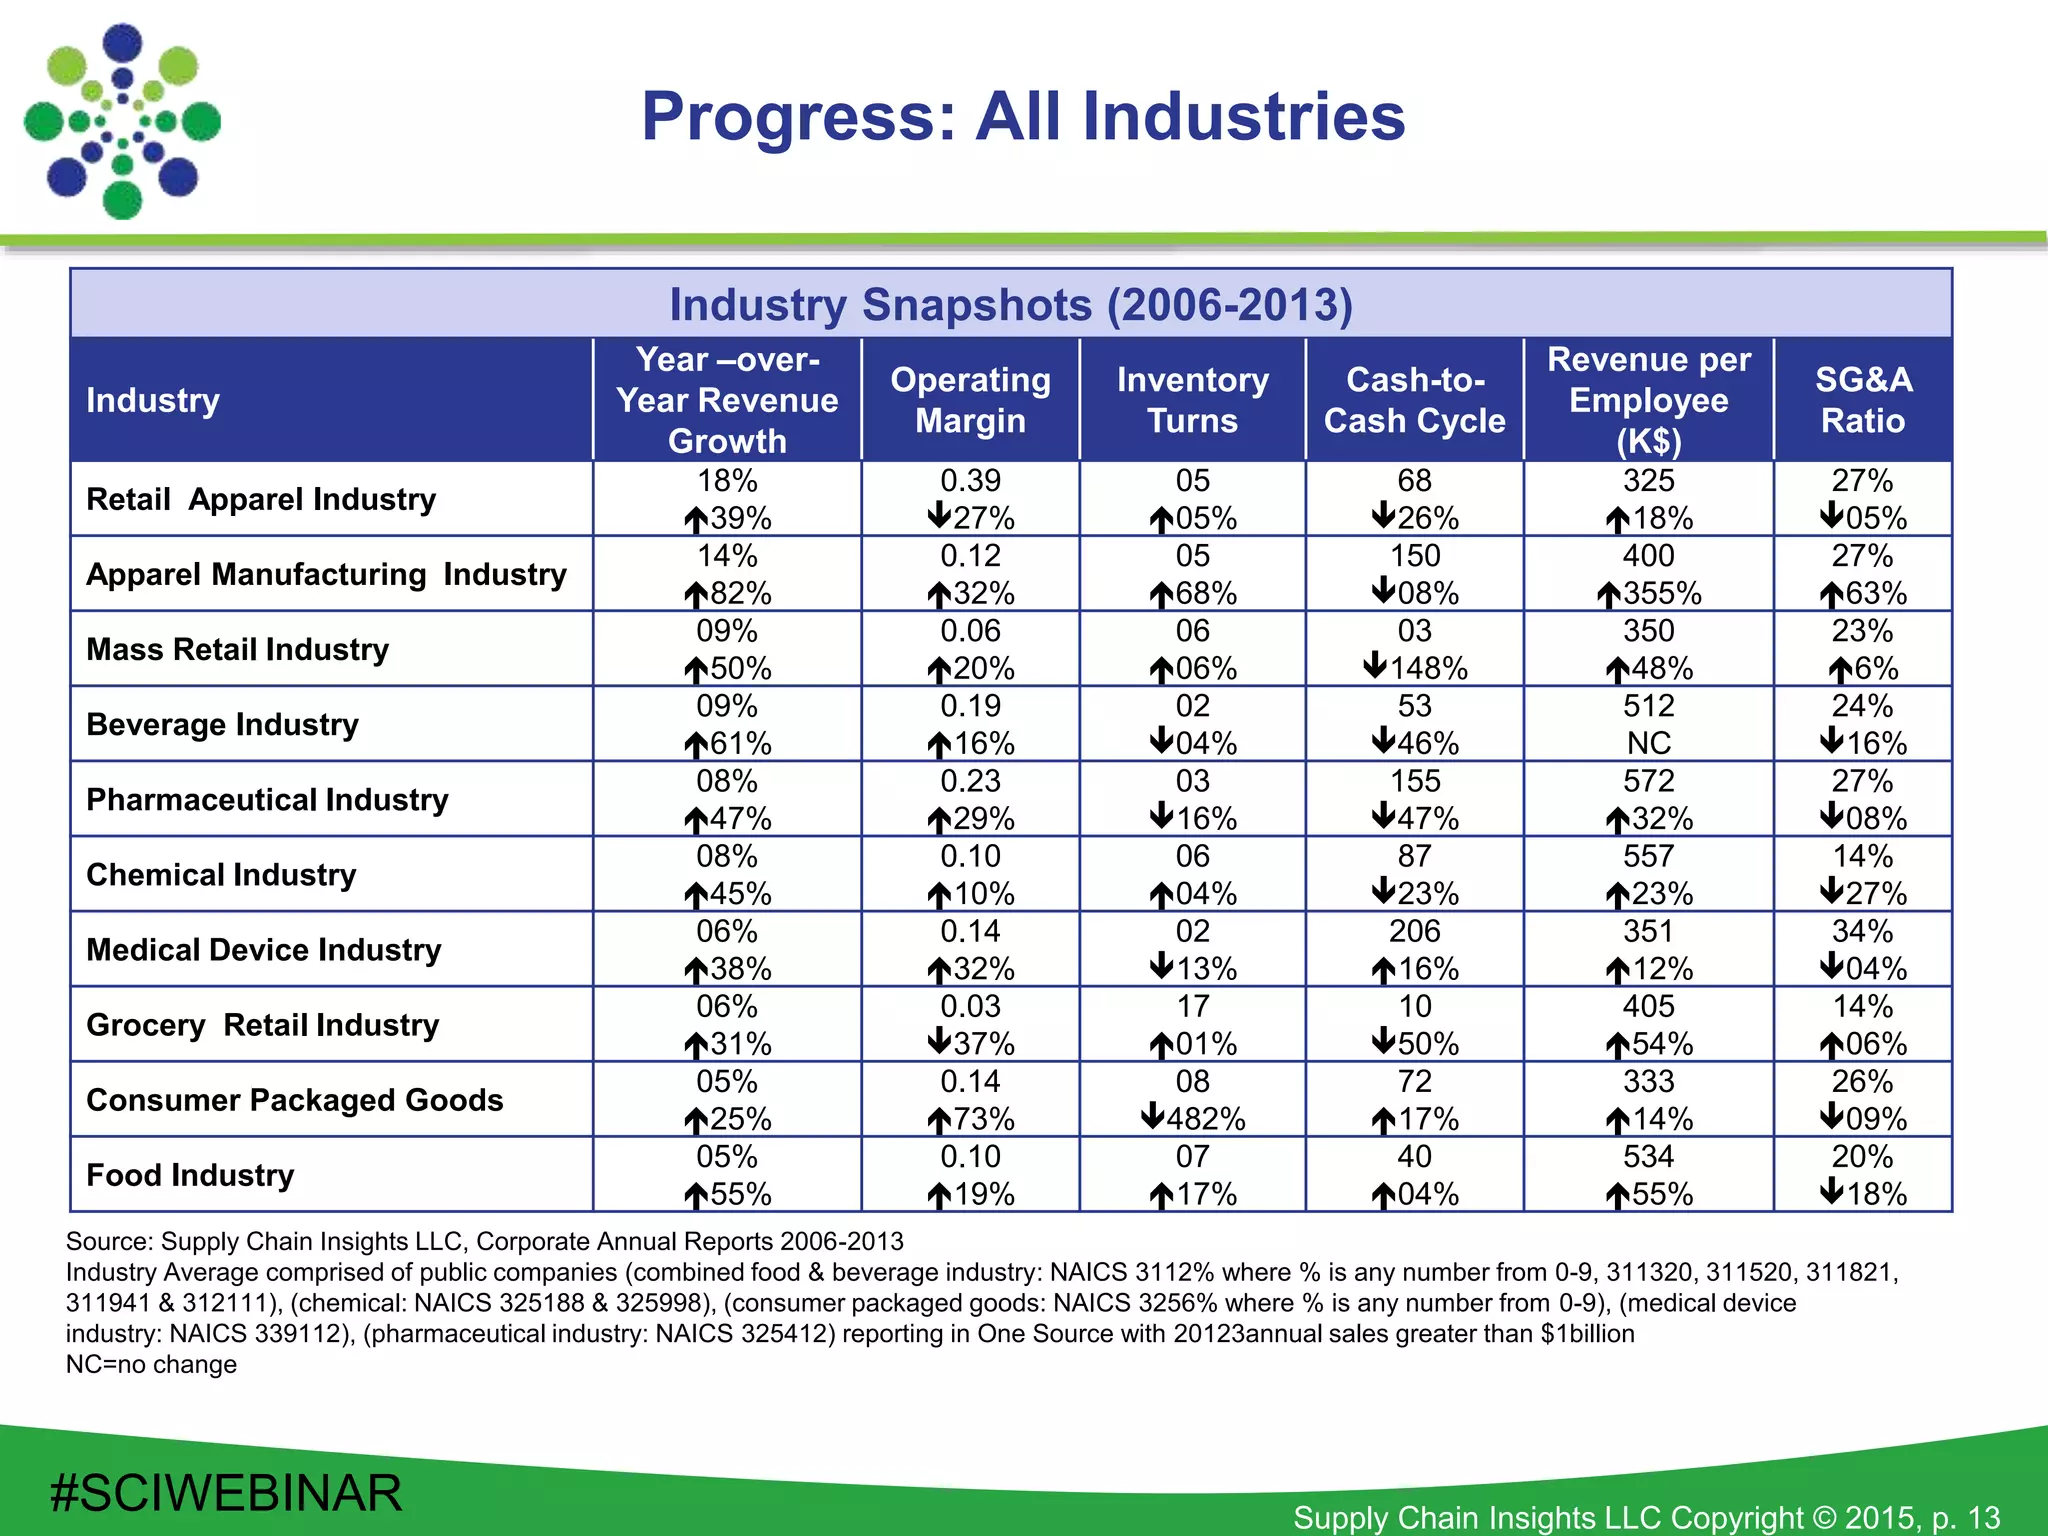
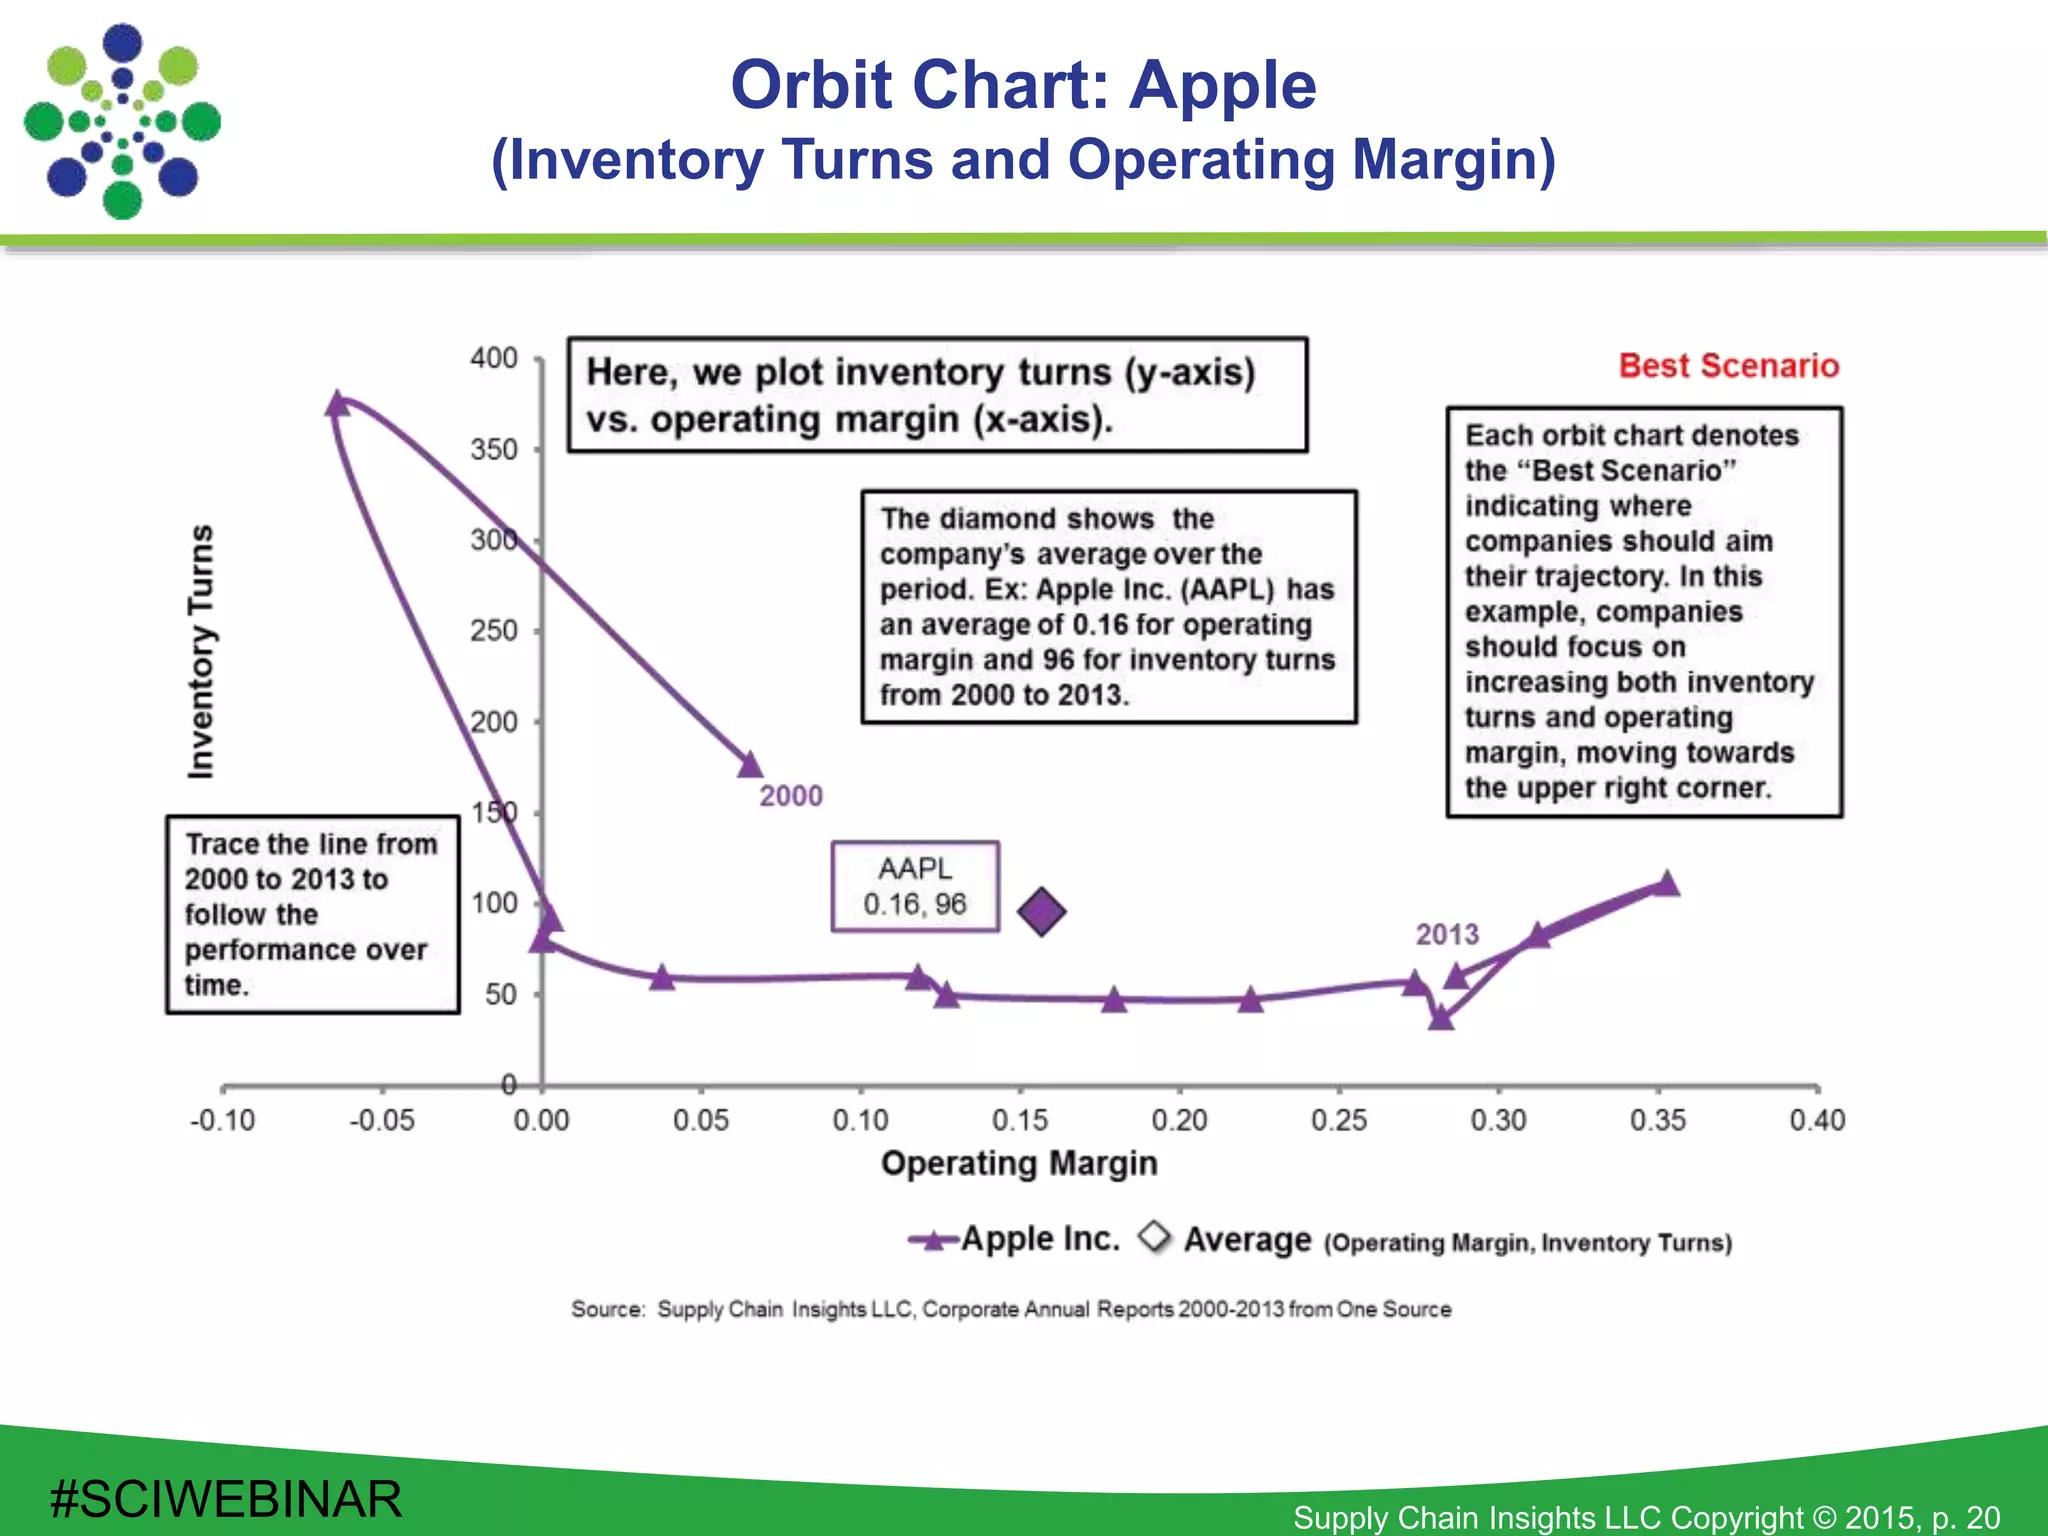
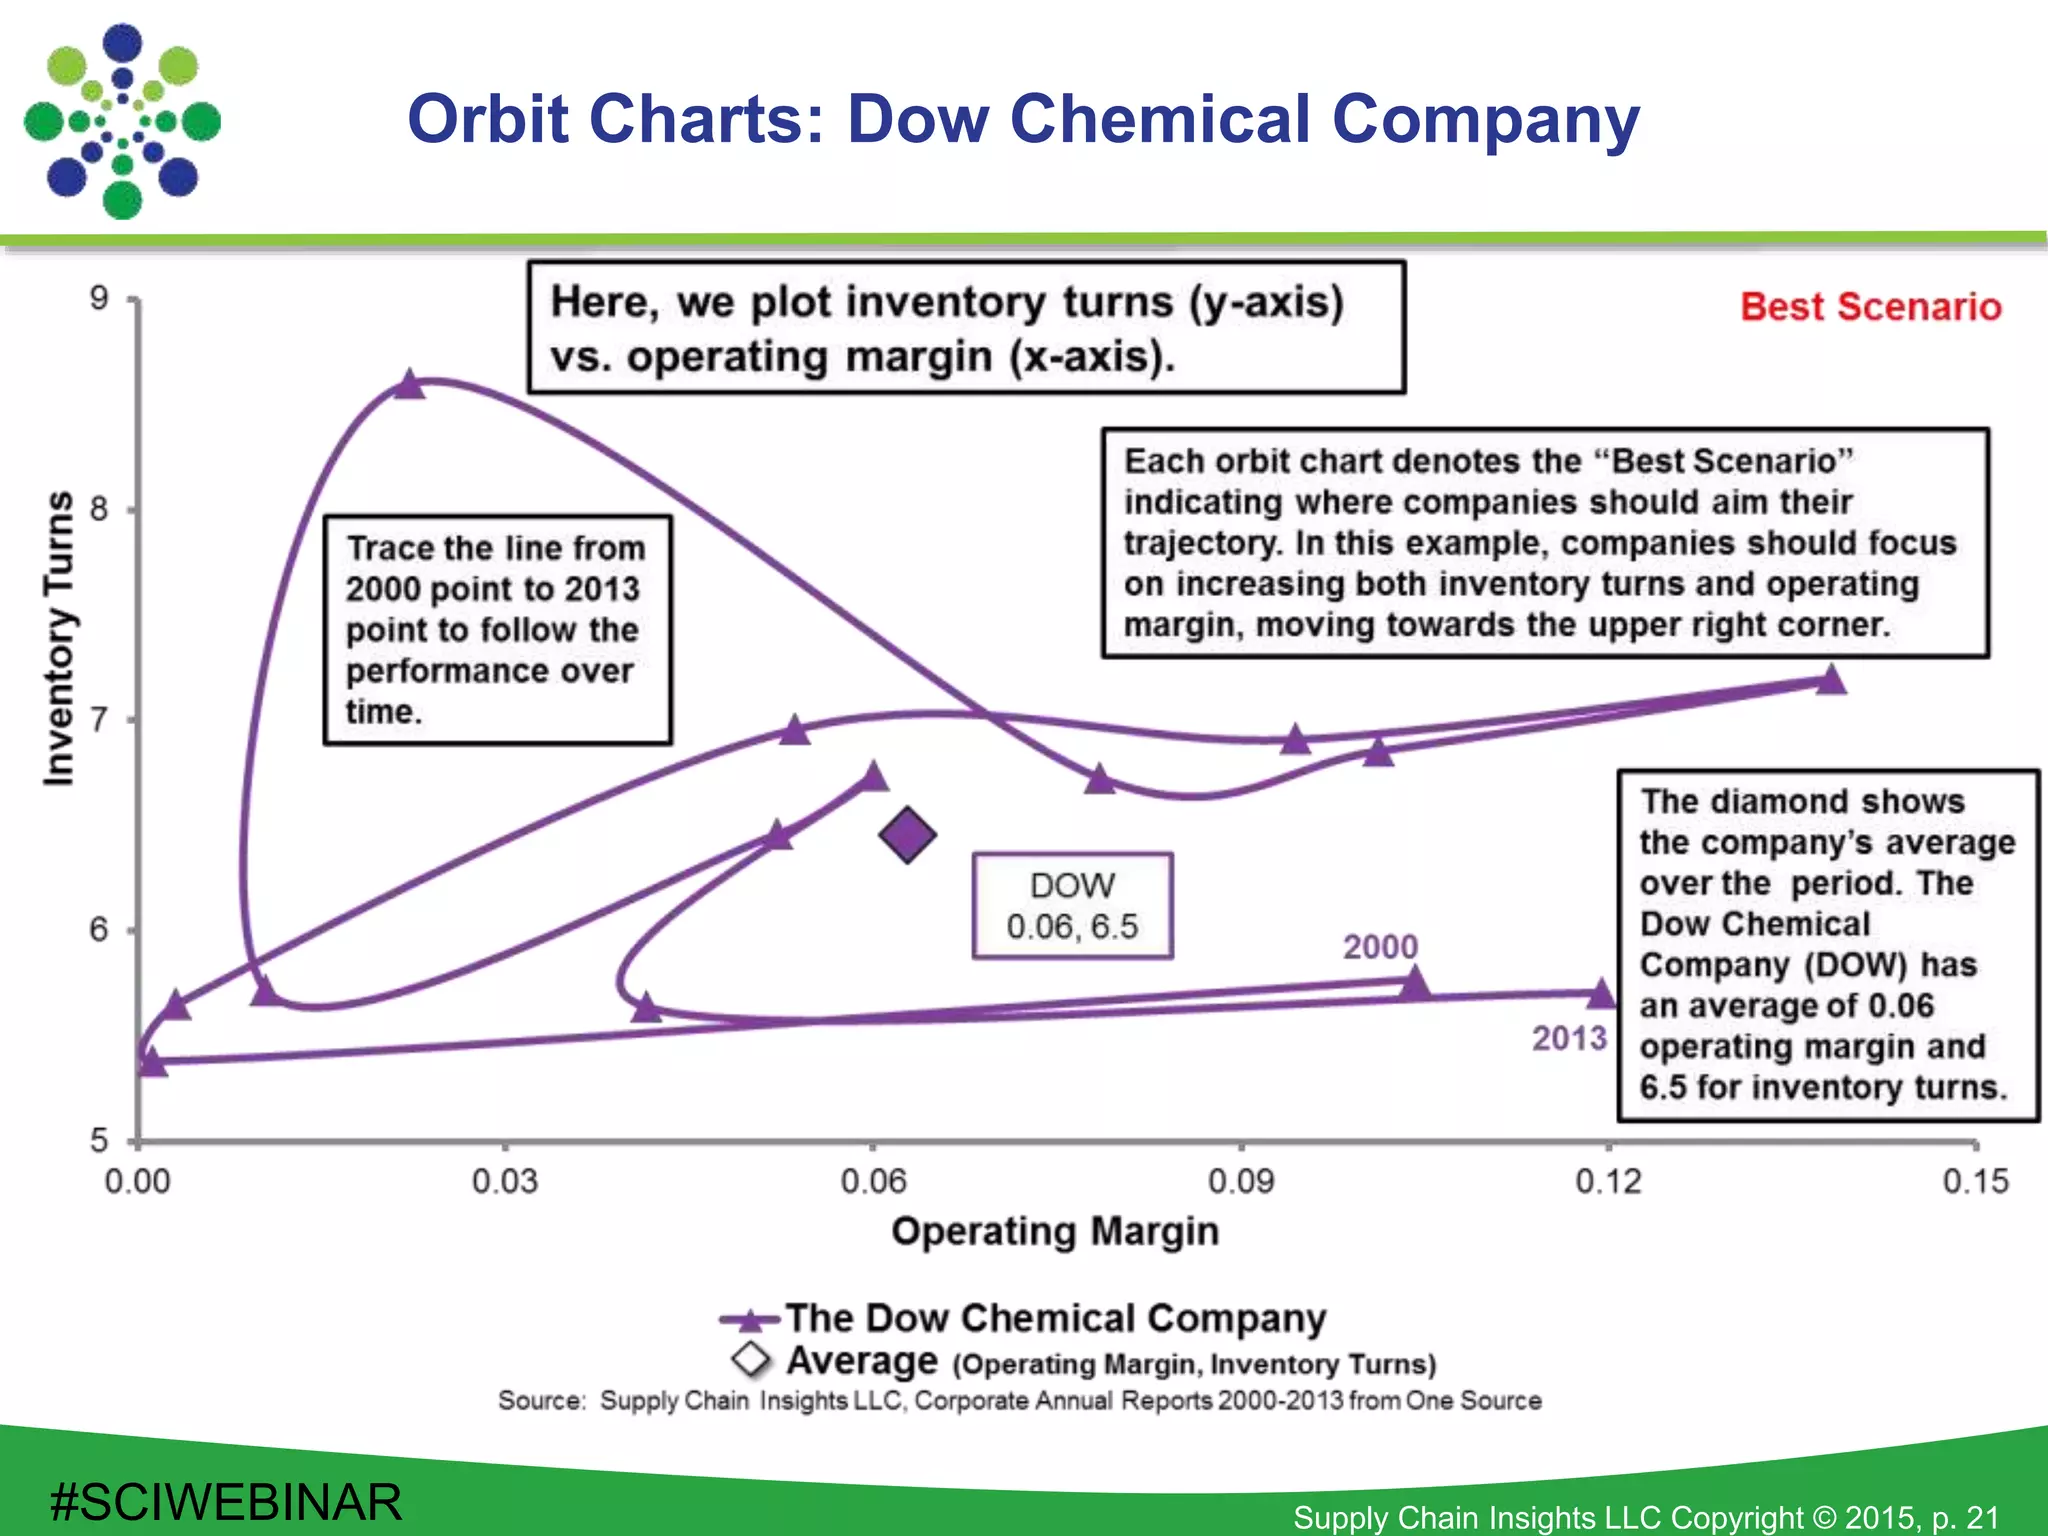
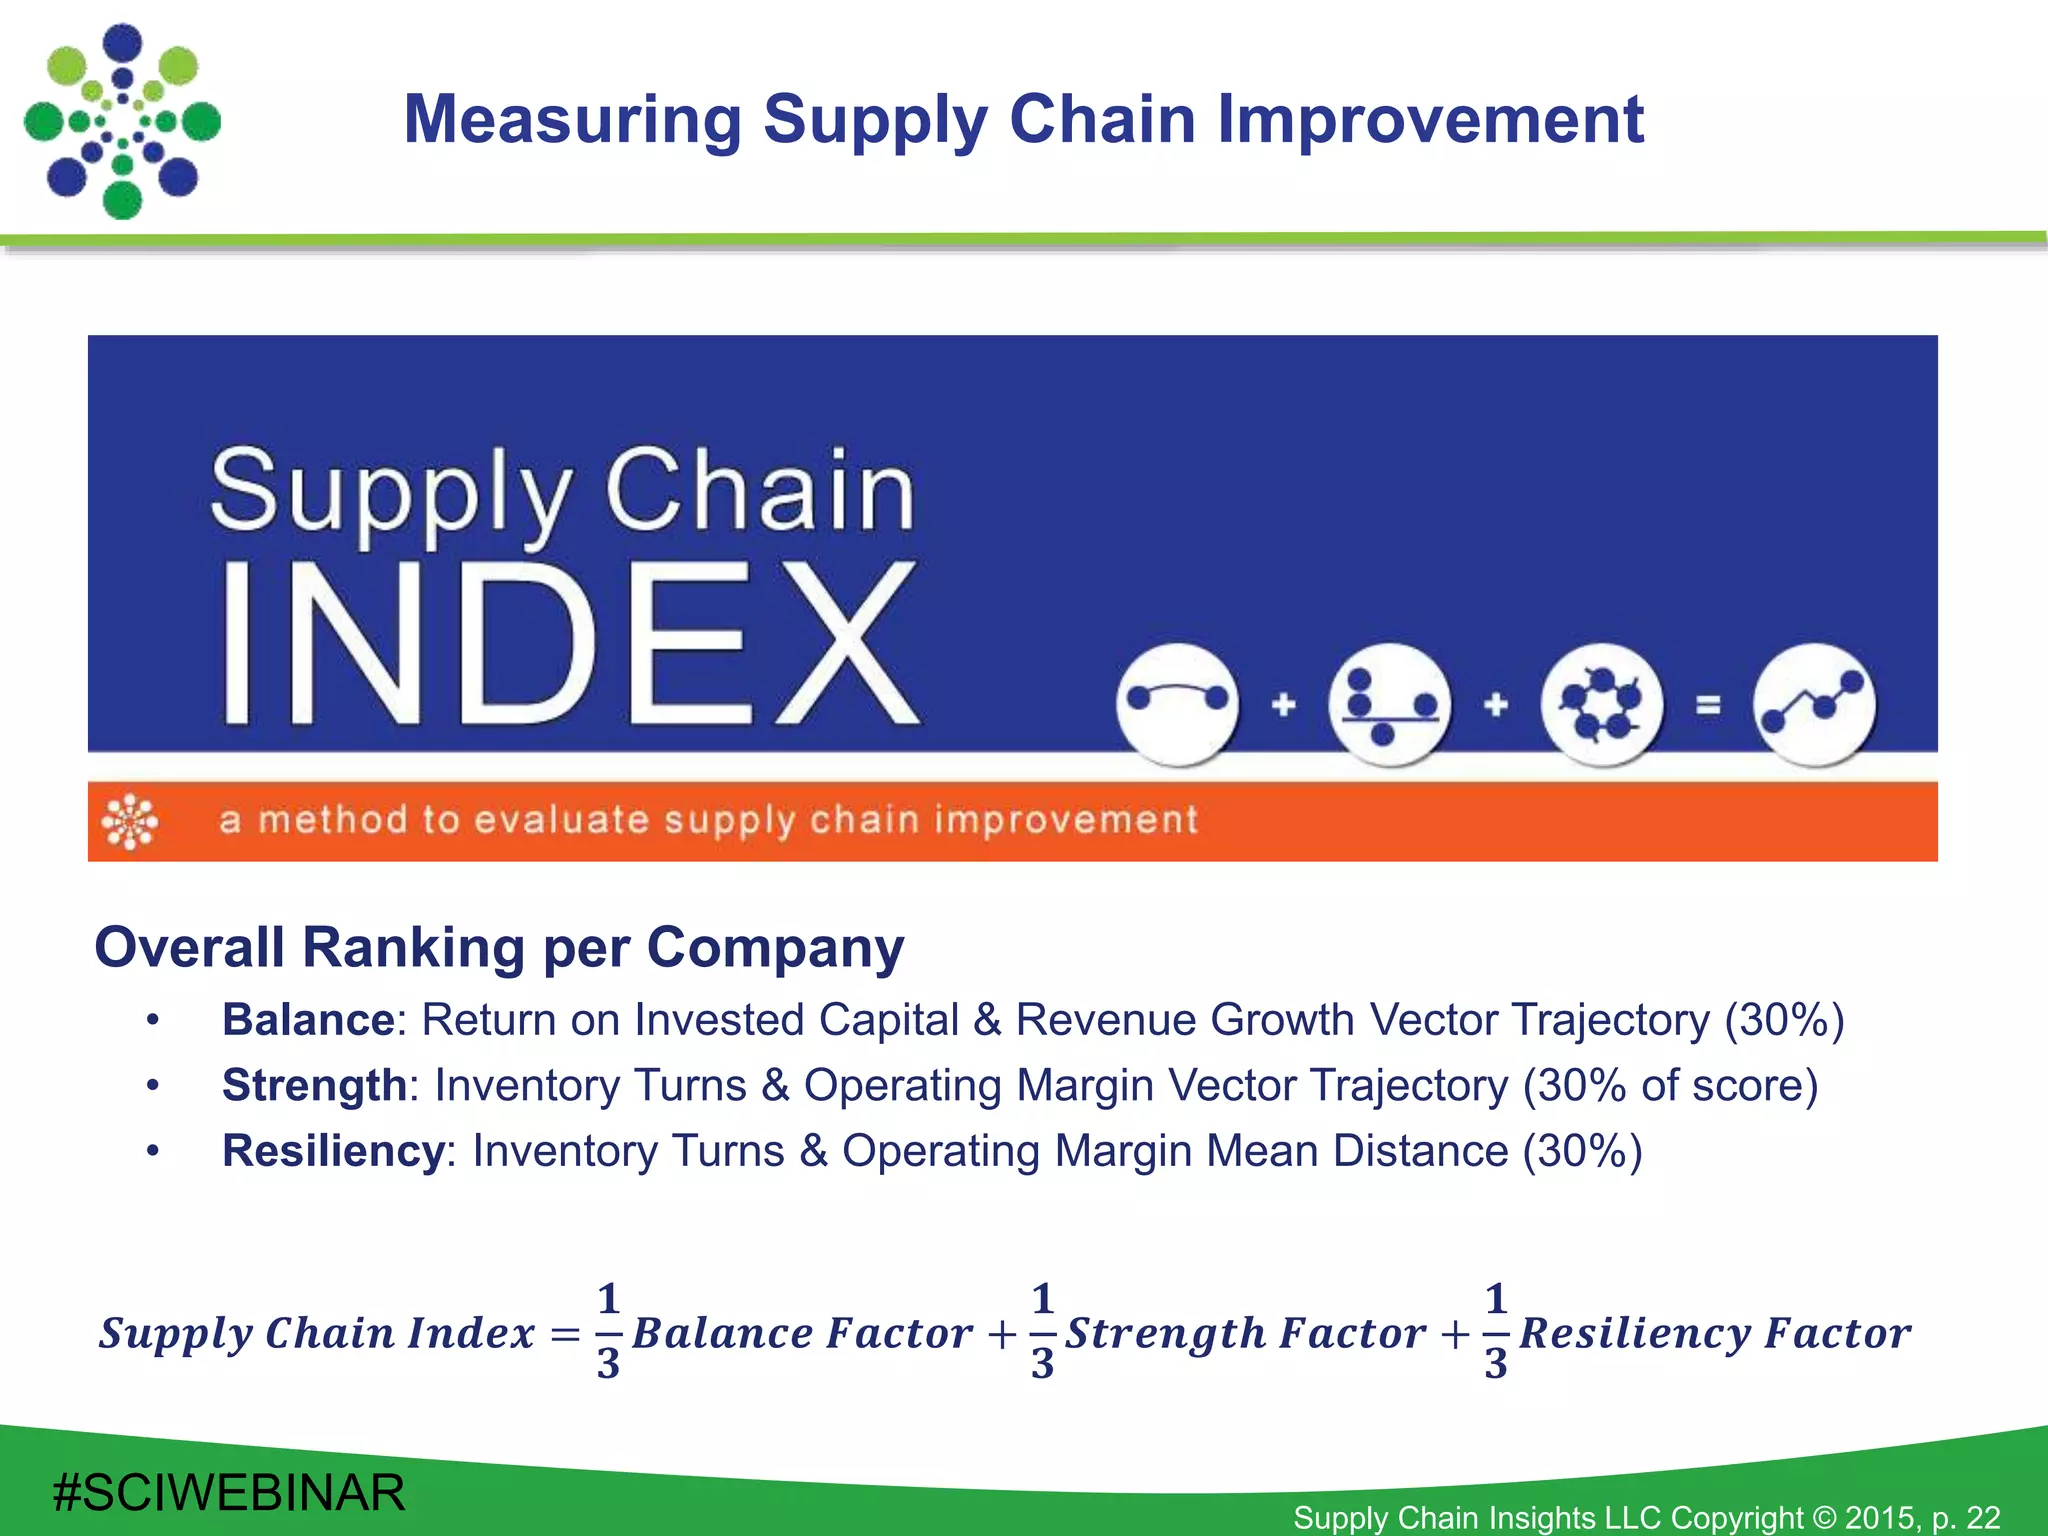
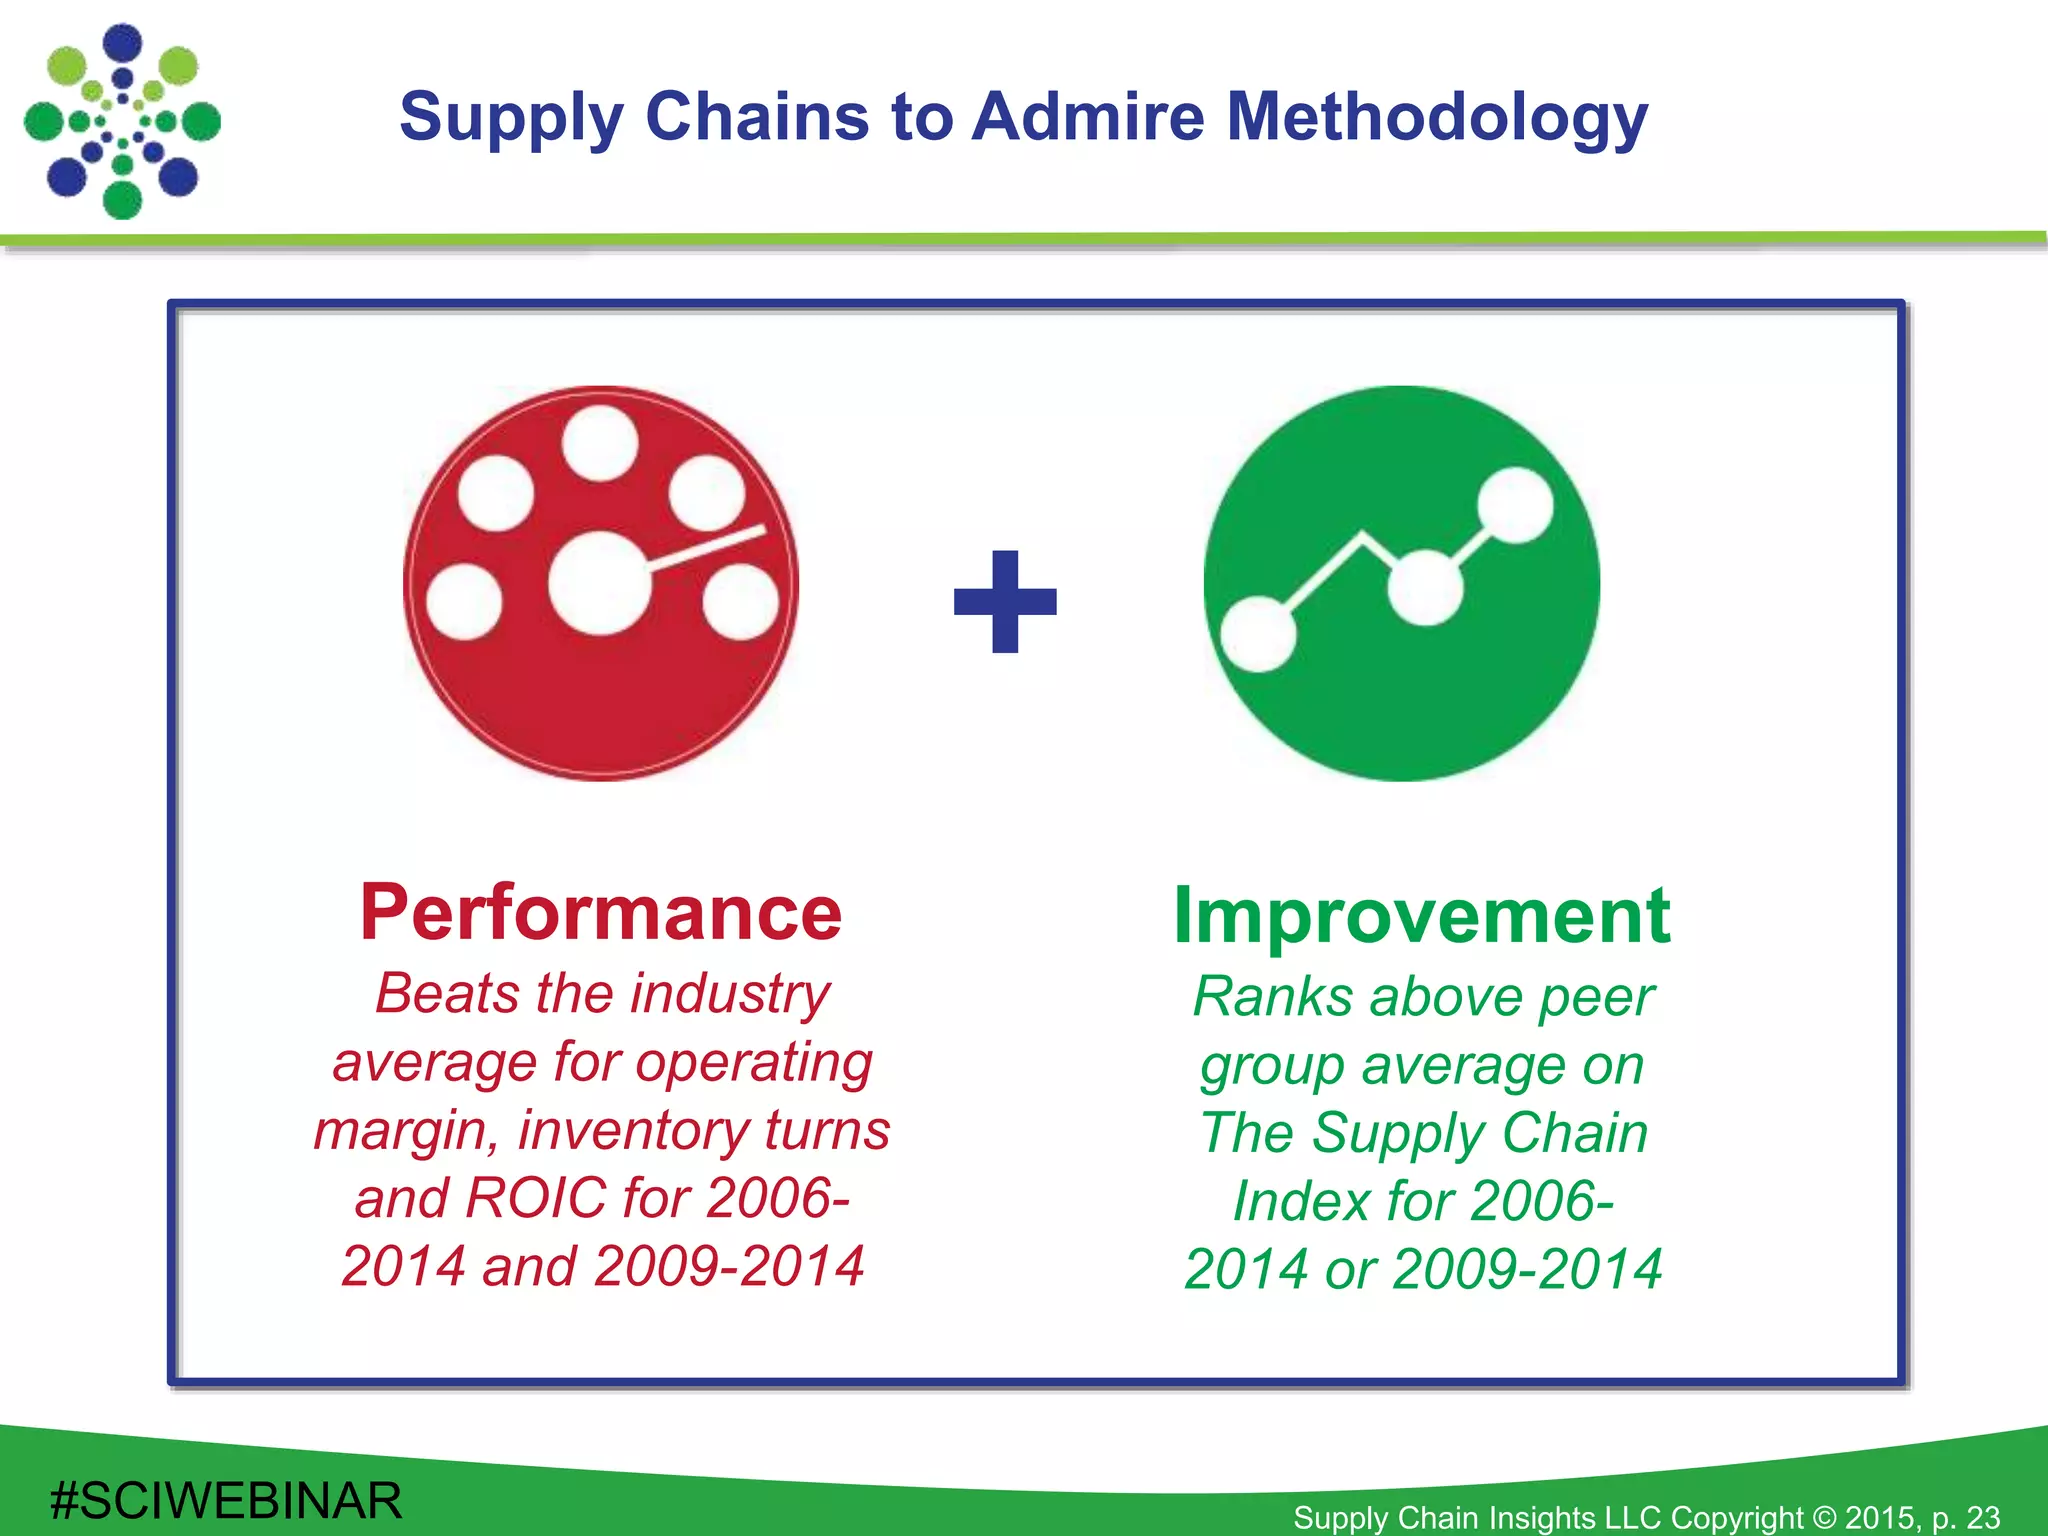
Supply Chain Insights LLC Copyright © 2015, p. 1
Understanding the Supply
Chain Index
August 2015
Supply Chain Insights LLC Copyright © 2015, p. 2
About Me
• Founder of Supply Chain Insights
• LinkedIn Influencer
• Guest Blogger for Forbes
• Author of three books: Bricks Matter (2012), The Shaman’s Journal (2014)
and Supply Chain Metrics That Matter (December 2014)
• Partner at Altimeter Group (leader in open research)
• Seven Years of Management Experience Leading Analyst Teams at Gartner
and AMR Research
• Eight Years Experience in Marketing and Selling Supply Chain Software at
Descartes Systems Group and Manugistics (now JDA)
• Fifteen Years Leading Teams in Manufacturing and Distribution Operations
for Clorox, Kraft/General Foods, Nestlé/Dreyer’s Grand Ice Cream and
Procter & Gamble
Contact Information:
• Email: lora.cecere@supplychaininsights.com
• Blog: www.supplychainshaman.com (10,000 page views/month)
• Forbes: www.forbes.com/sites/loracecere/
• Twitter: lcecere (6200 followers)
• LinkedIn: www.linkedin.com/in/loracecere (46,000 followers)
Supply Chain Insights LLC Copyright © 2015, p. 3
Our Goal Is to Help the Average Joe
Supply Chain Insights LLC Copyright © 2015, p. 4
Four Years of Work
Wiley
December 2012
Wiley
December 2014
Self-published
September 2014
Self-publishing
September 2015
Supply Chain Insights LLC Copyright © 2015, p. 5
The Goal
Supply Chain Insights LLC Copyright © 2015, p. 6
A Supply Chain
Is a Complex System
with Complex
Processes
with Increasing
Complexity
What We Learned….
Supply Chain Insights LLC Copyright © 2015, p. 7
Descriptors Used by Leaders
#SCIWEBINAR
Supply Chain Insights LLC Copyright © 2015, p. 8
The Supply Chain Effective Frontier
Supply Chain Insights LLC Copyright © 2015, p. 9
9 out of 10 Supply Chains are Stuck
Supply Chain Insights LLC Copyright © 2015, p. 10
• Metrics That Matter: Metrics that can be improved by the supply chain
leader and have high correlation to market capitalization.
• Market-Driven: The ability to sense and respond from market-to-market
(from the customer’s customer to the supplier’s supplier)
• NAICS Codes: US census classification(s) of industry groupings.
• Orbit Chart: A comparison of year-over-year improvement between two
supply chain metrics.
• Supply Chain Index: A methodology developed by Supply Chain
Insights in 2014 to measure supply chain improvement based on orbit
chart measurements.
• Supply Chains to Admire: An objective, and independent analysis of
supply chains that are outperforming in the Supply Chain Metrics That
Matter and are driving supply chain improvement as measured by the
Supply Chain Index.
• The Effective Frontier: Representation of a balanced set of
measurements for the supply chain.
Let’s Start with Definitions
#SCIWEBINAR
Supply Chain Insights LLC Copyright © 2015, p. 11
Methodology Comparison
Gartner Top 25 Supply Chains to Admire
Focus Fortune 1000 Companies
Companies by Industry Irrespective of
Size
Calculation
-25% ROA (3 Year
Weighted Average)
-15% Inventory Turns
(2014)10% Growth (2013
versus 2014)
-50 % Opinion
Performance Better than Peer Group
for the Period of 2009-2014 on the
Metrics That Matter
Improvement Greater than the Average
of the Peer Group for 2009-2014
Experience 10th Year 2nd Year
#SCIWEBINAR
Supply Chain Insights LLC Copyright © 2015, p. 12
New Research
Coming Soon!
Individual Industries
Automotive
Consumer Electronics
August 25, 2015
September 1, 2015
Supply Chains to
Admire
Final Report September 8, 2015
Metrics That Matter
Correlations
New Report on the Connection of
Financial Metrics to Supply Chain
Performance
October 1, 2015
Industries (20)
3-PL
A&D
Apparel
Automotive
Automotive Suppliers
Beauty
Beverages
Chemical
Contract Manufacturing
Consumer Packaged Goods
Consumer Durables
Consumer Electronics
Department Stores
Food
Grocery Retail
Hi-Tech and Electronics
Heavy Equipment
Mass Merchants
Medical Device
Packaging and Closures
Semiconductor
#SCIWEBINAR
Supply Chain Insights LLC Copyright © 2015, p. 13
Progress: All Industries
Industry Snapshots (2006-2013)
Industry
Year –over-
Year Revenue
Growth
Operating
Margin
Inventory
Turns
Cash-to-
Cash Cycle
Revenue per
Employee
(K$)
SG&A
Ratio
Retail Apparel Industry
18%
39%
0.39
27%
05
05%
68
26%
325
18%
27%
05%
Apparel Manufacturing Industry
14%
82%
0.12
32%
05
68%
150
08%
400
355%
27%
63%
Mass Retail Industry
09%
50%
0.06
20%
06
06%
03
148%
350
48%
23%
6%
Beverage Industry
09%
61%
0.19
16%
02
04%
53
46%
512
NC
24%
16%
Pharmaceutical Industry
08%
47%
0.23
29%
03
16%
155
47%
572
32%
27%
08%
Chemical Industry
08%
45%
0.10
10%
06
04%
87
23%
557
23%
14%
27%
Medical Device Industry
06%
38%
0.14
32%
02
13%
206
16%
351
12%
34%
04%
Grocery Retail Industry
06%
31%
0.03
37%
17
01%
10
50%
405
54%
14%
06%
Consumer Packaged Goods
05%
25%
0.14
73%
08
482%
72
17%
333
14%
26%
09%
Food Industry
05%
55%
0.10
19%
07
17%
40
04%
534
55%
20%
18%
Source: Supply Chain Insights LLC, Corporate Annual Reports 2006-2013
Industry Average comprised of public companies (combined food & beverage industry: NAICS 3112% where % is any number from 0-9, 311320, 311520, 311821,
311941 & 312111), (chemical: NAICS 325188 & 325998), (consumer packaged goods: NAICS 3256% where % is any number from 0-9), (medical device
industry: NAICS 339112), (pharmaceutical industry: NAICS 325412) reporting in One Source with 20123annual sales greater than $1billion
NC=no change
#SCIWEBINAR
Supply Chain Insights LLC Copyright © 2015, p. 14
Which Metrics Matter?
#SCIWEBINAR
Supply Chain Insights LLC Copyright © 2015, p. 15
Correlations to Market Capitalization
#SCIWEBINAR
Supply Chain Insights LLC Copyright © 2015, p. 16
What We Expected
#SCIWEBINAR
Supply Chain Insights LLC Copyright © 2015, p. 17
A Supply Chain
is a Complex System
with Complex
Processes
with Increasing
Complexity
What We Learned….
#SCIWEBINAR
Supply Chain Insights LLC Copyright © 2015, p. 18
The Supply Chain Effective Frontier
#SCIWEBINAR
Supply Chain Insights LLC Copyright © 2015, p. 19
Orbit Chart: Wal-Mart
(Inventory Turns and Operating Margin)
#SCIWEBINAR
Supply Chain Insights LLC Copyright © 2015, p. 20
Orbit Chart: Apple
(Inventory Turns and Operating Margin)
#SCIWEBINAR
Supply Chain Insights LLC Copyright © 2015, p. 21
Orbit Charts: Dow Chemical Company
#SCIWEBINAR
Supply Chain Insights LLC Copyright © 2015, p. 22
Measuring Supply Chain Improvement
Overall Ranking per Company
• Balance: Return on Invested Capital & Revenue Growth Vector Trajectory (30%)
• Strength: Inventory Turns & Operating Margin Vector Trajectory (30% of score)
• Resiliency: Inventory Turns & Operating Margin Mean Distance (30%)
𝑺𝒖𝒑𝒑𝒍𝒚 𝑪𝒉𝒂𝒊𝒏 𝑰𝒏𝒅𝒆𝒙 =
𝟏
𝟑
𝑩𝒂𝒍𝒂𝒏𝒄𝒆 𝑭𝒂𝒄𝒕𝒐𝒓 +
𝟏
𝟑
𝑺𝒕𝒓𝒆𝒏𝒈𝒕𝒉 𝑭𝒂𝒄𝒕𝒐𝒓 +
𝟏
𝟑
𝑹𝒆𝒔𝒊𝒍𝒊𝒆𝒏𝒄𝒚 𝑭𝒂𝒄𝒕𝒐𝒓
#SCIWEBINAR
Supply Chain Insights LLC Copyright © 2015, p. 23
Supply Chains to Admire Methodology
Performance
Beats the industry
average for operating
margin, inventory turns
and ROIC for 2006-
2014 and 2009-2014
Improvement
Ranks above peer
group average on
The Supply Chain
Index for 2006-
2014 or 2009-2014
+
#SCIWEBINAR
Supply Chain Insights LLC Copyright © 2015, p. 24
Annual Study: Supply Chains To Admire
Supply Chains to Admire 2015 to be Announced at the Supply
Chain Insights Global Summit on September 9th and 10th
#SCIWEBINAR
Supply Chain Insights LLC Copyright © 2015, p. 25
Consumer Products
#SCIWEBINAR
Supply Chain Insights LLC Copyright © 2015, p. 26
Consumer Packaged Goods
#SCIWEBINAR
Company
2006-
2014
2009-
2014
2011-
2014
2006-
2014
2009-
2014
2011-
2014
2006-
2014
2009-
2014
2011-
2014
2006-
2014
2009-
2014
Church & Dwight Co. Inc. 0.17 0.18 0.19 12.4 13.0 13.3 11% 13% 13% 4 2
Colgate-Palmolive 0.21 0.22 0.22 12.8 12.7 12.7 32% 33% 31% 7 8
The Clorox Company 0.17 0.17 0.16 14.9 14.5 14.4 21% 21% 22% 5 6
Kimberly Clark 0.13 0.13 0.13 8.7 8.9 9.0 16% 16% 16% 9 4
Newell Rubbermaid 0.09 0.10 0.09 7.7 8.0 8.2 7% 8% 9% 3 9
Procter & Gamble Co. 0.19 0.19 0.18 11.6 11.6 12.0 12% 12% 12% 6 5
Reckitt Benckiser Group 0.23 0.24 0.24 14.2 13.5 12.8 28% 26% 24% 8 7
Tupperware Brands Corp. 0.12 0.14 0.14 8.2 8.4 8.6 17% 20% 20% 1 1
Unilever plc 0.14 0.14 0.15 10.7 11.0 11.1 17% 17% 19% 2 3
Average 0.15 0.16 0.16 10.6 10.7 10.7 16% 17% 17%
Performance and Improvement
Operating Margin Inventory Turns Return on Invested Capital
Supply Chain Index
Rankings
Supply Chain Insights LLC Copyright © 2015, p. 27
9%
14%
19%
-0.07 -0.02 0.03 0.08 0.13 0.18
RevenueGrowth
Return on Invested Capital (ROIC)
Procter & Gamble
2000
2014
2001
2002
2003
2004
2005
2006
2007
2008
2009
2010
2011
20122013
P&G: Growth and ROIC
Source: Supply Chain Insights LLC, Corporate Annual Reports 2002-2012 from YCharts
Best Scenario
PG
0.06, 14%
Trace the line from 2000
point to 2014 point to
follow the performance
over time.
The diamond shows
the company’s average
over the period. Ex:
The Procter & Gamble
Co. (PG) has an
average of .06 for ROIC
and 14% for revenue
growth.
Ideally, companies are increasing
growth and Return on Invested
Capital (ROIC) moving towards the
upper right corner of the graph
over time.
Here, we Growth (y-axis) vs. ROIC (x-
axis).
Average (Return on Invested Capital, Revenue Growth)
#SCIWEBINAR
Supply Chain Insights LLC Copyright © 2015, p. 28
10.00
11.00
12.00
13.00
0.11 0.12 0.13 0.14 0.15 0.16 0.17 0.18 0.19 0.20 0.21
InventoryTurns
Operating Margin
Procter & Gamble
2000
2014
2001 2002
2003
2004
2005
2006
2007
2008
2009
2010
2011
2012
2013
P&G: Inventory Turns and Operating Margins
Source: Supply Chain Insights LLC, Corporate Annual Reports 2002-2012 from YCharts
Best Scenario
PG
0.18, 11.75
Trace the line from 2000
point to 2014 point to
follow the performance
over time.
The diamond shows
the company’s average
over the period. Ex:
The Procter & Gamble
Co. (PG) has an
average of .18 for
operating margin and
11.75 for inventory
turns.
Ideally, companies are increasing
inventory turns and operating
margins moving towards the upper
right corner of the graph over time.
Here, we plot inventory turns (y-axis)
vs. operating margins(x-axis).
Average (Operating Margin, Inventory Turns)
#SCIWEBINAR
Supply Chain Insights LLC Copyright © 2015, p. 29
10.00
11.00
12.00
13.00
14.00
15.00
0.17 0.18 0.19 0.20 0.21 0.22 0.23 0.24 0.25
InventoryTurns
Operating Margin
Colgate-Palmolive
2000 2014
2001
2002
2003
2004
2005
2006
2007
2008
2009
2010
2011
2012
2013
Colgate: Operating Margins and Inventory Turns
Source: Supply Chain Insights LLC, Corporate Annual Reports 2002-2012 from YCharts
Best Scenario
CL
0.21, 13.03
Trace the line from 2000
point to 2014 point to
follow performance over
time.
The diamond shows the company’s
average over the period. Ex: The
Colgate-Palmolive Co. (CL) has an
average of .21 for operating margin
and 13.03 for inventory turns.
Ideally,
companies are
increasing
inventory turns
and operating
margin, moving
towards the
upper right
corner of the
graph over time.
Here, we plot inventory turns (y-axis)
vs. operating margin (x-axis).
Average (Operating Margin, Inventory Turns)
#SCIWEBINAR
Supply Chain Insights LLC Copyright © 2015, p. 30
7.50
8.00
8.50
9.00
9.50
10.00
10.50
11.00
0.11 0.12 0.13 0.14 0.15 0.16 0.17 0.18 0.19
InventoryTurns
Operating Margin
Kimberly Clark
2000
2014
2001
2002
2003
2004
2005
2006
2007
2008
2009
2010
2011
2012
2013
Biggest Loser: Kimberly-Clark
Source: Supply Chain Insights LLC, Corporate Annual Reports 2002-2012 from YCharts
Best Scenario
KMB
0.15, 9.01
Trace the line from 2000
point to 2014 point to
follow the performance
over time.
The diamond shows the company’s
average over the period. Ex: The
Kimberly Clark Co. (KMB) has an
average of .15 for operating margin
and 9.01 for inventory turns.
Ideally,
companies are
increasing
inventory turns
and operating
margin moving
towards the
upper right
corner of the
graph over time.
Average (Operating Margin, Inventory Turns)
Here, we plot inventory turns (y-axis)
vs. operating margin (x-axis).
#SCIWEBINAR
Supply Chain Insights LLC Copyright © 2015, p. 31
4.00
5.00
6.00
7.00
8.00
9.00
10.00
11.00
12.00
0.05 0.06 0.07 0.08 0.09 0.10 0.11 0.12 0.13 0.14 0.15 0.16 0.17 0.18
InventoryTurns
Operating Margin
Unilever
2000
2014
2001
2002
2003
2004
2005
2006
2007
2008
2009
2010
2011
2012
2013
Unilever: Impressive Gains
Source: Supply Chain Insights LLC, Corporate Annual Reports 2002-2012 from One Source & YCharts
Best Scenario
UN
0.13, 8.66
Trace the line from 2000
point to 2014 point to
follow the performance
over time.
The diamond shows the company’s
average over the period. Ex: The
Unilever Co. (UN) has an average of
.13 for operating margin and 8.66 for
inventory turns.
Ideally, companies are increasing
inventory turns and operating
margin moving towards the upper
right corner of the graph over time.
Here, we plot inventory turns (y-axis)
vs. operating margin(x-axis).
Average (Operating Margin, Inventory Turns)
#SCIWEBINAR
Supply Chain Insights LLC Copyright © 2015, p. 32
9.00
10.00
11.00
12.00
13.00
0.12 0.13 0.14 0.15 0.16 0.17 0.18 0.19 0.20 0.21
InventoryTurns
Operating Margin
Procter & Gamble Unilever
2014
2006
2014
2006
Procter & Gamble and Unilever
Inventory Turns vs. Operating Margin
(2006 – 2014)
Source: Supply Chain Insights LLC, Corporate Annual Reports 2002-2012 from One Source & YCharts
Best Scenario
UN
0.14, 10.74
Average (Operating Margin, Inventory Turns)
PG
0.19, 11.59
#SCIWEBINAR
Supply Chain Insights LLC Copyright © 2015, p. 33
9.50
10.50
11.50
12.50
13.50
0.12 0.13 0.14 0.15 0.16 0.17 0.18 0.19 0.20 0.21 0.22 0.23
InventoryTurns
Operating Margin
Colgate Palmolive Unilever
2014
2006
2014
2006
Colgate and Unilever
Inventory Turns vs. Operating Margin
(2006 – 2014)
Source: Supply Chain Insights LLC, Corporate Annual Reports 2002-2012 from One Source & YCharts
Best Scenario
UN
0.14, 10.74
Average (Operating Margin, Inventory Turns)
CL
0.21, 12.77
#SCIWEBINAR
Supply Chain Insights LLC Copyright © 2015, p. 34
Procter & Gamble and Colgate
Inventory Turns vs. Operating Margin
(2006 – 2014)
#SCIWEBINAR
Supply Chain Insights LLC Copyright © 2015, p. 35
Pharmaceuticals
Webinar
August 4, 2015
#SCIWEBINAR
Supply Chain Insights LLC Copyright © 2015, p. 36
Pharmaceuticals
#SCIWEBINAR
Company 2006-2014 2009-2014 2011-2014 2006-2014 2009-2014 2011-2014 2006-2014 2009-2014 2011-2014 2006-2014 2009-2014
Abbott Laboratories 0.11 0.11 0.12 8.98 8.79 8.11 12% 11% 10% 3 6
AstraZeneca plc 0.27 0.27 0.22 14.96 15.79 14.28 22% 19% 15% 9 8
Bristol-Myers Squibb Co. 0.08 0.08 0.08 7.77 7.76 7.48 7% 6% 7% 4 4
Eli Lilly and Company 0.20 0.23 0.21 8.24 8.42 8.40 16% 21% 18% 7 7
Merck and Company 0.15 0.13 0.16 9.12 7.35 7.22 15% 13% 11% 8 2
Novo Nordisk A/S 0.36 0.35 0.37 6.47 7.31 8.16 42% 51% 60% 5 4
Novartis AG 0.21 0.21 0.20 8.09 8.32 8.44 13% 11% 11% 1 1
Pfizer, Inc. 0.50 0.23 0.26 8.13 7.83 8.10 12% 0.10 12% 7 5
Teva Pharmaceutical
Industries Limited 0.16 0.16 0.14 4.23 4.13 4.00 7% 8% 7% 2 3
Average 0.19 0.20 0.20 8.44 8.41 8.95 16% 18% 17%
Operating Margin Inventory Turns Return on Invested Capital Supply Chain Index
Performance and Improvement
Supply Chain Insights LLC Copyright © 2015, p. 37
9.00
10.00
11.00
12.00
13.00
14.00
0.21 0.22 0.23 0.24 0.25 0.26 0.27 0.28 0.29
InventoryTurns
Operating Margin
Johnson & Johnson
2000
2014
2001
2002
2003
2004
2005
2006
2007
2008 2009
2010
2011
2012
2013
Visualizing the Patterns
Source: Supply Chain Insights LLC, Corporate Annual Reports 2000-2014 from YCharts
Best Scenario
JNJ
0.25,11.36
Trace the line from 2000 point
to 2014 point to follow the
performance over time.
The diamond shows the company’s average over
the period. Ex: The Johnson & Johnson Co. (JNJ)
has an average of .25 for operating margin and
11.36 for inventory turns.
Ideally, companies
are increasing
inventory turns and
operating margin,
moving towards the
upper right corner
of the graph over
time.
Here, we plot inventory turns (y-axis)
vs. operating margin (x-axis).
Average (Operating Margin, Inventory Turns)
#SCIWEBINAR
Supply Chain Insights LLC Copyright © 2015, p. 38
Source: Supply Chain Insights LLC, Corporate Annual Reports 2006-2014
2006
4.0
5.0
6.0
7.0
8.0
9.0
10.0
-0.10 0.00 0.10 0.20 0.30 0.40 0.50 0.60
Operating Margin
Eli Lilly and Company Novo Nordisk
2014 NVO
0.31, 6.48
2014
2006
Best Scenario
LLY
0.24, 8.30
Average (Operating Margin, Inventory Turns)
InventoryTurns
Novo Nordisk Making Progress
#SCIWEBINAR
Supply Chain Insights LLC Copyright © 2015, p. 39
7.00
8.00
9.00
10.00
11.00
12.00
13.00
0.17 0.18 0.19 0.20 0.21 0.22 0.23 0.24 0.25 0.26 0.27 0.28 0.29
InventoryTurns
Operating Margin
Johnson & Johnson Novartis
2014
2006
2014
2006
Inventory Turns vs. Operating Margin
(2006 – 2014)
Source: Supply Chain Insights LLC, Corporate Annual Reports 2006-2014 from YCharts
Best Scenario
JNJ
0.25, 11.11
Average (Operating Margin, Inventory Turns)
NVS
0.21, 8.30
#SCIWEBINAR
Supply Chain Insights LLC Copyright © 2015, p. 40
5.00
6.00
7.00
8.00
9.00
10.00
11.00
12.00
13.00
0.14 0.16 0.18 0.20 0.22 0.24 0.26 0.28 0.30
InventoryTurns
Operating Margin
Johnson & Johnson Pfizer
2014
2006
2014 2006
Inventory Turns vs. Operating Margin
(2006 – 2014)
Source: Supply Chain Insights LLC, Corporate Annual Reports 2006-2014 from YCharts
Best Scenario
JNJ
0.25, 11.11
Average (Operating Margin, Inventory Turns)
PFE
0.21, 8.13
#SCIWEBINAR
Supply Chain Insights LLC Copyright © 2015, p. 41
Inventory Turns vs. Operating Margin
(2006 – 2014)
Source: Supply Chain Insights LLC, Corporate Annual Reports 2006-2014
TEVA
0.16, 4.28
Average (Operating Margin, Inventory Turns)
2006
3.0
3.5
4.0
4.5
5.0
5.5
6.0
6.5
7.0
0.00 0.10 0.20 0.30
Operating Margin
TEVA Pharmaceutical Industries Mylan N.V.
2014
MYL
0.16, 4.83
2014 2006
Best Scenario
InventoryTurns
#SCIWEBINAR
Supply Chain Insights LLC Copyright © 2015, p. 42
The Journey
#SCIWEBINAR
Supply Chain Insights LLC Copyright © 2015, p. 43
Metrics Maturity
#SCIWEBINAR
Supply Chain Insights LLC Copyright © 2015, p. 44
• Which metrics matter?
– Growth, operating margin, inventory turns, ROIC, customer
service (in the eyes of the customer)
• How do we get unstuck?
– Focus cross-functionally on a balanced portfolio. Bonus
employees against the portfolio.
– Augment with functional metrics focused on improving
RELIABILITY.
• What are the functional reliability metrics?
– Examples include: Forecasting, first pass yield, OEE, on-time
delivery, orders shipped complete, hands-free orders, schedule
attainment, safety metrics, employee turnover
Insights
#SCIWEBINAR
Supply Chain Insights LLC Copyright © 2015, p. 45
• Continuity of leadership
• Supply chain talent development
• Focus on a multi-year supply chain strategy
• Clear governance to guide cross-functional decision-making
• Strength in horizontal processes
• Excellence in supply chain planning, network design and inventory
management
What Drives Top Performance?
#SCIWEBINAR
Supply Chain Insights LLC Copyright © 2015, p. 46#SCIWEBINAR
Supply Chain Insights LLC Copyright © 2015, p. 47
#SCIWEBINAR
#SCIWEBINAR
Supply Chain Insights LLC Copyright © 2015, p. 50
About Me
• Founder of Supply Chain Insights
• LinkedIn Influencer
• Guest Blogger for Forbes
• Author of three books: Bricks Matter (2012), The Shaman’s Journal (2014)
and Supply Chain Metrics That Matter (December 2014)
• Partner at Altimeter Group (leader in open research)
• Seven Years of Management Experience Leading Analyst Teams at Gartner
and AMR Research
• Eight Years Experience in Marketing and Selling Supply Chain Software at
Descartes Systems Group and Manugistics (now JDA)
• Fifteen Years Leading Teams in Manufacturing and Distribution Operations
for Clorox, Kraft/General Foods, Nestlé/Dreyer’s Grand Ice Cream and
Procter & Gamble
Contact Information:
• Email: lora.cecere@supplychaininsights.com
• Blog: www.supplychainshaman.com (10,000 page views/month)
• Forbes: www.forbes.com/sites/loracecere/
• Twitter: lcecere (6200 followers)
• LinkedIn: www.linkedin.com/in/loracecere (46,000 followers)
Supply Chain Insights LLC Copyright © 2015, p. 51
Definition:
Metric Equations
Source: Supply Chain Insights LLC, Corporate Annual Reports (2000-2014)
Metric Equations
Cash-to-Cash Cycles = (Avg. Inventory/COGS + Avg. Accounts Receivable/Sales - Avg. Accounts
Payable/Purchases)*91.5
Days of Inventory = (Average Inventory/COGS)*91.5
Days of Payables = (Average Accounts Payables/Purchases)*91.5
Days of Receivables = (Average Accounts Receivable/Sales)*91.5
Inventory Turns = (Cost of Sales/Average Inventory)
Operating Margin = (Operating Income/Revenue)
Return on Invested Capital = (Net Income/Invested Capital)
Return on Net Assets = (Trailing 12 Month Net Income/Total Assets from the most recent quarter)
Revenue Growth = (Quarterly Revenuei/Quarterly Revenuei-4 -1)
Revenue per Employees = (Revenue/Average Annual Employee)
#SCIWEBINAR

Understanding the Supply Chain Index - 2015 - slide deck - 20 AUG 2015

  • 1.
    Supply Chain InsightsLLC Copyright © 2015, p. 1 Understanding the Supply Chain Index August 2015
  • 2.
    Supply Chain InsightsLLC Copyright © 2015, p. 2 About Me • Founder of Supply Chain Insights • LinkedIn Influencer • Guest Blogger for Forbes • Author of three books: Bricks Matter (2012), The Shaman’s Journal (2014) and Supply Chain Metrics That Matter (December 2014) • Partner at Altimeter Group (leader in open research) • Seven Years of Management Experience Leading Analyst Teams at Gartner and AMR Research • Eight Years Experience in Marketing and Selling Supply Chain Software at Descartes Systems Group and Manugistics (now JDA) • Fifteen Years Leading Teams in Manufacturing and Distribution Operations for Clorox, Kraft/General Foods, Nestlé/Dreyer’s Grand Ice Cream and Procter & Gamble Contact Information: • Email: lora.cecere@supplychaininsights.com • Blog: www.supplychainshaman.com (10,000 page views/month) • Forbes: www.forbes.com/sites/loracecere/ • Twitter: lcecere (6200 followers) • LinkedIn: www.linkedin.com/in/loracecere (46,000 followers)
  • 3.
    Supply Chain InsightsLLC Copyright © 2015, p. 3 Our Goal Is to Help the Average Joe
  • 4.
    Supply Chain InsightsLLC Copyright © 2015, p. 4 Four Years of Work Wiley December 2012 Wiley December 2014 Self-published September 2014 Self-publishing September 2015
  • 5.
    Supply Chain InsightsLLC Copyright © 2015, p. 5 The Goal
  • 6.
    Supply Chain InsightsLLC Copyright © 2015, p. 6 A Supply Chain Is a Complex System with Complex Processes with Increasing Complexity What We Learned….
  • 7.
    Supply Chain InsightsLLC Copyright © 2015, p. 7 Descriptors Used by Leaders #SCIWEBINAR
  • 8.
    Supply Chain InsightsLLC Copyright © 2015, p. 8 The Supply Chain Effective Frontier
  • 9.
    Supply Chain InsightsLLC Copyright © 2015, p. 9 9 out of 10 Supply Chains are Stuck
  • 10.
    Supply Chain InsightsLLC Copyright © 2015, p. 10 • Metrics That Matter: Metrics that can be improved by the supply chain leader and have high correlation to market capitalization. • Market-Driven: The ability to sense and respond from market-to-market (from the customer’s customer to the supplier’s supplier) • NAICS Codes: US census classification(s) of industry groupings. • Orbit Chart: A comparison of year-over-year improvement between two supply chain metrics. • Supply Chain Index: A methodology developed by Supply Chain Insights in 2014 to measure supply chain improvement based on orbit chart measurements. • Supply Chains to Admire: An objective, and independent analysis of supply chains that are outperforming in the Supply Chain Metrics That Matter and are driving supply chain improvement as measured by the Supply Chain Index. • The Effective Frontier: Representation of a balanced set of measurements for the supply chain. Let’s Start with Definitions #SCIWEBINAR
  • 11.
    Supply Chain InsightsLLC Copyright © 2015, p. 11 Methodology Comparison Gartner Top 25 Supply Chains to Admire Focus Fortune 1000 Companies Companies by Industry Irrespective of Size Calculation -25% ROA (3 Year Weighted Average) -15% Inventory Turns (2014)10% Growth (2013 versus 2014) -50 % Opinion Performance Better than Peer Group for the Period of 2009-2014 on the Metrics That Matter Improvement Greater than the Average of the Peer Group for 2009-2014 Experience 10th Year 2nd Year #SCIWEBINAR
  • 12.
    Supply Chain InsightsLLC Copyright © 2015, p. 12 New Research Coming Soon! Individual Industries Automotive Consumer Electronics August 25, 2015 September 1, 2015 Supply Chains to Admire Final Report September 8, 2015 Metrics That Matter Correlations New Report on the Connection of Financial Metrics to Supply Chain Performance October 1, 2015 Industries (20) 3-PL A&D Apparel Automotive Automotive Suppliers Beauty Beverages Chemical Contract Manufacturing Consumer Packaged Goods Consumer Durables Consumer Electronics Department Stores Food Grocery Retail Hi-Tech and Electronics Heavy Equipment Mass Merchants Medical Device Packaging and Closures Semiconductor #SCIWEBINAR
  • 13.
    Supply Chain InsightsLLC Copyright © 2015, p. 13 Progress: All Industries Industry Snapshots (2006-2013) Industry Year –over- Year Revenue Growth Operating Margin Inventory Turns Cash-to- Cash Cycle Revenue per Employee (K$) SG&A Ratio Retail Apparel Industry 18% 39% 0.39 27% 05 05% 68 26% 325 18% 27% 05% Apparel Manufacturing Industry 14% 82% 0.12 32% 05 68% 150 08% 400 355% 27% 63% Mass Retail Industry 09% 50% 0.06 20% 06 06% 03 148% 350 48% 23% 6% Beverage Industry 09% 61% 0.19 16% 02 04% 53 46% 512 NC 24% 16% Pharmaceutical Industry 08% 47% 0.23 29% 03 16% 155 47% 572 32% 27% 08% Chemical Industry 08% 45% 0.10 10% 06 04% 87 23% 557 23% 14% 27% Medical Device Industry 06% 38% 0.14 32% 02 13% 206 16% 351 12% 34% 04% Grocery Retail Industry 06% 31% 0.03 37% 17 01% 10 50% 405 54% 14% 06% Consumer Packaged Goods 05% 25% 0.14 73% 08 482% 72 17% 333 14% 26% 09% Food Industry 05% 55% 0.10 19% 07 17% 40 04% 534 55% 20% 18% Source: Supply Chain Insights LLC, Corporate Annual Reports 2006-2013 Industry Average comprised of public companies (combined food & beverage industry: NAICS 3112% where % is any number from 0-9, 311320, 311520, 311821, 311941 & 312111), (chemical: NAICS 325188 & 325998), (consumer packaged goods: NAICS 3256% where % is any number from 0-9), (medical device industry: NAICS 339112), (pharmaceutical industry: NAICS 325412) reporting in One Source with 20123annual sales greater than $1billion NC=no change #SCIWEBINAR
  • 14.
    Supply Chain InsightsLLC Copyright © 2015, p. 14 Which Metrics Matter? #SCIWEBINAR
  • 15.
    Supply Chain InsightsLLC Copyright © 2015, p. 15 Correlations to Market Capitalization #SCIWEBINAR
  • 16.
    Supply Chain InsightsLLC Copyright © 2015, p. 16 What We Expected #SCIWEBINAR
  • 17.
    Supply Chain InsightsLLC Copyright © 2015, p. 17 A Supply Chain is a Complex System with Complex Processes with Increasing Complexity What We Learned…. #SCIWEBINAR
  • 18.
    Supply Chain InsightsLLC Copyright © 2015, p. 18 The Supply Chain Effective Frontier #SCIWEBINAR
  • 19.
    Supply Chain InsightsLLC Copyright © 2015, p. 19 Orbit Chart: Wal-Mart (Inventory Turns and Operating Margin) #SCIWEBINAR
  • 20.
    Supply Chain InsightsLLC Copyright © 2015, p. 20 Orbit Chart: Apple (Inventory Turns and Operating Margin) #SCIWEBINAR
  • 21.
    Supply Chain InsightsLLC Copyright © 2015, p. 21 Orbit Charts: Dow Chemical Company #SCIWEBINAR
  • 22.
    Supply Chain InsightsLLC Copyright © 2015, p. 22 Measuring Supply Chain Improvement Overall Ranking per Company • Balance: Return on Invested Capital & Revenue Growth Vector Trajectory (30%) • Strength: Inventory Turns & Operating Margin Vector Trajectory (30% of score) • Resiliency: Inventory Turns & Operating Margin Mean Distance (30%) 𝑺𝒖𝒑𝒑𝒍𝒚 𝑪𝒉𝒂𝒊𝒏 𝑰𝒏𝒅𝒆𝒙 = 𝟏 𝟑 𝑩𝒂𝒍𝒂𝒏𝒄𝒆 𝑭𝒂𝒄𝒕𝒐𝒓 + 𝟏 𝟑 𝑺𝒕𝒓𝒆𝒏𝒈𝒕𝒉 𝑭𝒂𝒄𝒕𝒐𝒓 + 𝟏 𝟑 𝑹𝒆𝒔𝒊𝒍𝒊𝒆𝒏𝒄𝒚 𝑭𝒂𝒄𝒕𝒐𝒓 #SCIWEBINAR
  • 23.
    Supply Chain InsightsLLC Copyright © 2015, p. 23 Supply Chains to Admire Methodology Performance Beats the industry average for operating margin, inventory turns and ROIC for 2006- 2014 and 2009-2014 Improvement Ranks above peer group average on The Supply Chain Index for 2006- 2014 or 2009-2014 + #SCIWEBINAR
  • 24.
    Supply Chain InsightsLLC Copyright © 2015, p. 24 Annual Study: Supply Chains To Admire Supply Chains to Admire 2015 to be Announced at the Supply Chain Insights Global Summit on September 9th and 10th #SCIWEBINAR
  • 25.
    Supply Chain InsightsLLC Copyright © 2015, p. 25 Consumer Products #SCIWEBINAR
  • 26.
    Supply Chain InsightsLLC Copyright © 2015, p. 26 Consumer Packaged Goods #SCIWEBINAR Company 2006- 2014 2009- 2014 2011- 2014 2006- 2014 2009- 2014 2011- 2014 2006- 2014 2009- 2014 2011- 2014 2006- 2014 2009- 2014 Church & Dwight Co. Inc. 0.17 0.18 0.19 12.4 13.0 13.3 11% 13% 13% 4 2 Colgate-Palmolive 0.21 0.22 0.22 12.8 12.7 12.7 32% 33% 31% 7 8 The Clorox Company 0.17 0.17 0.16 14.9 14.5 14.4 21% 21% 22% 5 6 Kimberly Clark 0.13 0.13 0.13 8.7 8.9 9.0 16% 16% 16% 9 4 Newell Rubbermaid 0.09 0.10 0.09 7.7 8.0 8.2 7% 8% 9% 3 9 Procter & Gamble Co. 0.19 0.19 0.18 11.6 11.6 12.0 12% 12% 12% 6 5 Reckitt Benckiser Group 0.23 0.24 0.24 14.2 13.5 12.8 28% 26% 24% 8 7 Tupperware Brands Corp. 0.12 0.14 0.14 8.2 8.4 8.6 17% 20% 20% 1 1 Unilever plc 0.14 0.14 0.15 10.7 11.0 11.1 17% 17% 19% 2 3 Average 0.15 0.16 0.16 10.6 10.7 10.7 16% 17% 17% Performance and Improvement Operating Margin Inventory Turns Return on Invested Capital Supply Chain Index Rankings
  • 27.
    Supply Chain InsightsLLC Copyright © 2015, p. 27 9% 14% 19% -0.07 -0.02 0.03 0.08 0.13 0.18 RevenueGrowth Return on Invested Capital (ROIC) Procter & Gamble 2000 2014 2001 2002 2003 2004 2005 2006 2007 2008 2009 2010 2011 20122013 P&G: Growth and ROIC Source: Supply Chain Insights LLC, Corporate Annual Reports 2002-2012 from YCharts Best Scenario PG 0.06, 14% Trace the line from 2000 point to 2014 point to follow the performance over time. The diamond shows the company’s average over the period. Ex: The Procter & Gamble Co. (PG) has an average of .06 for ROIC and 14% for revenue growth. Ideally, companies are increasing growth and Return on Invested Capital (ROIC) moving towards the upper right corner of the graph over time. Here, we Growth (y-axis) vs. ROIC (x- axis). Average (Return on Invested Capital, Revenue Growth) #SCIWEBINAR
  • 28.
    Supply Chain InsightsLLC Copyright © 2015, p. 28 10.00 11.00 12.00 13.00 0.11 0.12 0.13 0.14 0.15 0.16 0.17 0.18 0.19 0.20 0.21 InventoryTurns Operating Margin Procter & Gamble 2000 2014 2001 2002 2003 2004 2005 2006 2007 2008 2009 2010 2011 2012 2013 P&G: Inventory Turns and Operating Margins Source: Supply Chain Insights LLC, Corporate Annual Reports 2002-2012 from YCharts Best Scenario PG 0.18, 11.75 Trace the line from 2000 point to 2014 point to follow the performance over time. The diamond shows the company’s average over the period. Ex: The Procter & Gamble Co. (PG) has an average of .18 for operating margin and 11.75 for inventory turns. Ideally, companies are increasing inventory turns and operating margins moving towards the upper right corner of the graph over time. Here, we plot inventory turns (y-axis) vs. operating margins(x-axis). Average (Operating Margin, Inventory Turns) #SCIWEBINAR
  • 29.
    Supply Chain InsightsLLC Copyright © 2015, p. 29 10.00 11.00 12.00 13.00 14.00 15.00 0.17 0.18 0.19 0.20 0.21 0.22 0.23 0.24 0.25 InventoryTurns Operating Margin Colgate-Palmolive 2000 2014 2001 2002 2003 2004 2005 2006 2007 2008 2009 2010 2011 2012 2013 Colgate: Operating Margins and Inventory Turns Source: Supply Chain Insights LLC, Corporate Annual Reports 2002-2012 from YCharts Best Scenario CL 0.21, 13.03 Trace the line from 2000 point to 2014 point to follow performance over time. The diamond shows the company’s average over the period. Ex: The Colgate-Palmolive Co. (CL) has an average of .21 for operating margin and 13.03 for inventory turns. Ideally, companies are increasing inventory turns and operating margin, moving towards the upper right corner of the graph over time. Here, we plot inventory turns (y-axis) vs. operating margin (x-axis). Average (Operating Margin, Inventory Turns) #SCIWEBINAR
  • 30.
    Supply Chain InsightsLLC Copyright © 2015, p. 30 7.50 8.00 8.50 9.00 9.50 10.00 10.50 11.00 0.11 0.12 0.13 0.14 0.15 0.16 0.17 0.18 0.19 InventoryTurns Operating Margin Kimberly Clark 2000 2014 2001 2002 2003 2004 2005 2006 2007 2008 2009 2010 2011 2012 2013 Biggest Loser: Kimberly-Clark Source: Supply Chain Insights LLC, Corporate Annual Reports 2002-2012 from YCharts Best Scenario KMB 0.15, 9.01 Trace the line from 2000 point to 2014 point to follow the performance over time. The diamond shows the company’s average over the period. Ex: The Kimberly Clark Co. (KMB) has an average of .15 for operating margin and 9.01 for inventory turns. Ideally, companies are increasing inventory turns and operating margin moving towards the upper right corner of the graph over time. Average (Operating Margin, Inventory Turns) Here, we plot inventory turns (y-axis) vs. operating margin (x-axis). #SCIWEBINAR
  • 31.
    Supply Chain InsightsLLC Copyright © 2015, p. 31 4.00 5.00 6.00 7.00 8.00 9.00 10.00 11.00 12.00 0.05 0.06 0.07 0.08 0.09 0.10 0.11 0.12 0.13 0.14 0.15 0.16 0.17 0.18 InventoryTurns Operating Margin Unilever 2000 2014 2001 2002 2003 2004 2005 2006 2007 2008 2009 2010 2011 2012 2013 Unilever: Impressive Gains Source: Supply Chain Insights LLC, Corporate Annual Reports 2002-2012 from One Source & YCharts Best Scenario UN 0.13, 8.66 Trace the line from 2000 point to 2014 point to follow the performance over time. The diamond shows the company’s average over the period. Ex: The Unilever Co. (UN) has an average of .13 for operating margin and 8.66 for inventory turns. Ideally, companies are increasing inventory turns and operating margin moving towards the upper right corner of the graph over time. Here, we plot inventory turns (y-axis) vs. operating margin(x-axis). Average (Operating Margin, Inventory Turns) #SCIWEBINAR
  • 32.
    Supply Chain InsightsLLC Copyright © 2015, p. 32 9.00 10.00 11.00 12.00 13.00 0.12 0.13 0.14 0.15 0.16 0.17 0.18 0.19 0.20 0.21 InventoryTurns Operating Margin Procter & Gamble Unilever 2014 2006 2014 2006 Procter & Gamble and Unilever Inventory Turns vs. Operating Margin (2006 – 2014) Source: Supply Chain Insights LLC, Corporate Annual Reports 2002-2012 from One Source & YCharts Best Scenario UN 0.14, 10.74 Average (Operating Margin, Inventory Turns) PG 0.19, 11.59 #SCIWEBINAR
  • 33.
    Supply Chain InsightsLLC Copyright © 2015, p. 33 9.50 10.50 11.50 12.50 13.50 0.12 0.13 0.14 0.15 0.16 0.17 0.18 0.19 0.20 0.21 0.22 0.23 InventoryTurns Operating Margin Colgate Palmolive Unilever 2014 2006 2014 2006 Colgate and Unilever Inventory Turns vs. Operating Margin (2006 – 2014) Source: Supply Chain Insights LLC, Corporate Annual Reports 2002-2012 from One Source & YCharts Best Scenario UN 0.14, 10.74 Average (Operating Margin, Inventory Turns) CL 0.21, 12.77 #SCIWEBINAR
  • 34.
    Supply Chain InsightsLLC Copyright © 2015, p. 34 Procter & Gamble and Colgate Inventory Turns vs. Operating Margin (2006 – 2014) #SCIWEBINAR
  • 35.
    Supply Chain InsightsLLC Copyright © 2015, p. 35 Pharmaceuticals Webinar August 4, 2015 #SCIWEBINAR
  • 36.
    Supply Chain InsightsLLC Copyright © 2015, p. 36 Pharmaceuticals #SCIWEBINAR Company 2006-2014 2009-2014 2011-2014 2006-2014 2009-2014 2011-2014 2006-2014 2009-2014 2011-2014 2006-2014 2009-2014 Abbott Laboratories 0.11 0.11 0.12 8.98 8.79 8.11 12% 11% 10% 3 6 AstraZeneca plc 0.27 0.27 0.22 14.96 15.79 14.28 22% 19% 15% 9 8 Bristol-Myers Squibb Co. 0.08 0.08 0.08 7.77 7.76 7.48 7% 6% 7% 4 4 Eli Lilly and Company 0.20 0.23 0.21 8.24 8.42 8.40 16% 21% 18% 7 7 Merck and Company 0.15 0.13 0.16 9.12 7.35 7.22 15% 13% 11% 8 2 Novo Nordisk A/S 0.36 0.35 0.37 6.47 7.31 8.16 42% 51% 60% 5 4 Novartis AG 0.21 0.21 0.20 8.09 8.32 8.44 13% 11% 11% 1 1 Pfizer, Inc. 0.50 0.23 0.26 8.13 7.83 8.10 12% 0.10 12% 7 5 Teva Pharmaceutical Industries Limited 0.16 0.16 0.14 4.23 4.13 4.00 7% 8% 7% 2 3 Average 0.19 0.20 0.20 8.44 8.41 8.95 16% 18% 17% Operating Margin Inventory Turns Return on Invested Capital Supply Chain Index Performance and Improvement
  • 37.
    Supply Chain InsightsLLC Copyright © 2015, p. 37 9.00 10.00 11.00 12.00 13.00 14.00 0.21 0.22 0.23 0.24 0.25 0.26 0.27 0.28 0.29 InventoryTurns Operating Margin Johnson & Johnson 2000 2014 2001 2002 2003 2004 2005 2006 2007 2008 2009 2010 2011 2012 2013 Visualizing the Patterns Source: Supply Chain Insights LLC, Corporate Annual Reports 2000-2014 from YCharts Best Scenario JNJ 0.25,11.36 Trace the line from 2000 point to 2014 point to follow the performance over time. The diamond shows the company’s average over the period. Ex: The Johnson & Johnson Co. (JNJ) has an average of .25 for operating margin and 11.36 for inventory turns. Ideally, companies are increasing inventory turns and operating margin, moving towards the upper right corner of the graph over time. Here, we plot inventory turns (y-axis) vs. operating margin (x-axis). Average (Operating Margin, Inventory Turns) #SCIWEBINAR
  • 38.
    Supply Chain InsightsLLC Copyright © 2015, p. 38 Source: Supply Chain Insights LLC, Corporate Annual Reports 2006-2014 2006 4.0 5.0 6.0 7.0 8.0 9.0 10.0 -0.10 0.00 0.10 0.20 0.30 0.40 0.50 0.60 Operating Margin Eli Lilly and Company Novo Nordisk 2014 NVO 0.31, 6.48 2014 2006 Best Scenario LLY 0.24, 8.30 Average (Operating Margin, Inventory Turns) InventoryTurns Novo Nordisk Making Progress #SCIWEBINAR
  • 39.
    Supply Chain InsightsLLC Copyright © 2015, p. 39 7.00 8.00 9.00 10.00 11.00 12.00 13.00 0.17 0.18 0.19 0.20 0.21 0.22 0.23 0.24 0.25 0.26 0.27 0.28 0.29 InventoryTurns Operating Margin Johnson & Johnson Novartis 2014 2006 2014 2006 Inventory Turns vs. Operating Margin (2006 – 2014) Source: Supply Chain Insights LLC, Corporate Annual Reports 2006-2014 from YCharts Best Scenario JNJ 0.25, 11.11 Average (Operating Margin, Inventory Turns) NVS 0.21, 8.30 #SCIWEBINAR
  • 40.
    Supply Chain InsightsLLC Copyright © 2015, p. 40 5.00 6.00 7.00 8.00 9.00 10.00 11.00 12.00 13.00 0.14 0.16 0.18 0.20 0.22 0.24 0.26 0.28 0.30 InventoryTurns Operating Margin Johnson & Johnson Pfizer 2014 2006 2014 2006 Inventory Turns vs. Operating Margin (2006 – 2014) Source: Supply Chain Insights LLC, Corporate Annual Reports 2006-2014 from YCharts Best Scenario JNJ 0.25, 11.11 Average (Operating Margin, Inventory Turns) PFE 0.21, 8.13 #SCIWEBINAR
  • 41.
    Supply Chain InsightsLLC Copyright © 2015, p. 41 Inventory Turns vs. Operating Margin (2006 – 2014) Source: Supply Chain Insights LLC, Corporate Annual Reports 2006-2014 TEVA 0.16, 4.28 Average (Operating Margin, Inventory Turns) 2006 3.0 3.5 4.0 4.5 5.0 5.5 6.0 6.5 7.0 0.00 0.10 0.20 0.30 Operating Margin TEVA Pharmaceutical Industries Mylan N.V. 2014 MYL 0.16, 4.83 2014 2006 Best Scenario InventoryTurns #SCIWEBINAR
  • 42.
    Supply Chain InsightsLLC Copyright © 2015, p. 42 The Journey #SCIWEBINAR
  • 43.
    Supply Chain InsightsLLC Copyright © 2015, p. 43 Metrics Maturity #SCIWEBINAR
  • 44.
    Supply Chain InsightsLLC Copyright © 2015, p. 44 • Which metrics matter? – Growth, operating margin, inventory turns, ROIC, customer service (in the eyes of the customer) • How do we get unstuck? – Focus cross-functionally on a balanced portfolio. Bonus employees against the portfolio. – Augment with functional metrics focused on improving RELIABILITY. • What are the functional reliability metrics? – Examples include: Forecasting, first pass yield, OEE, on-time delivery, orders shipped complete, hands-free orders, schedule attainment, safety metrics, employee turnover Insights #SCIWEBINAR
  • 45.
    Supply Chain InsightsLLC Copyright © 2015, p. 45 • Continuity of leadership • Supply chain talent development • Focus on a multi-year supply chain strategy • Clear governance to guide cross-functional decision-making • Strength in horizontal processes • Excellence in supply chain planning, network design and inventory management What Drives Top Performance? #SCIWEBINAR
  • 46.
    Supply Chain InsightsLLC Copyright © 2015, p. 46#SCIWEBINAR
  • 47.
    Supply Chain InsightsLLC Copyright © 2015, p. 47 #SCIWEBINAR
  • 48.
  • 50.
    Supply Chain InsightsLLC Copyright © 2015, p. 50 About Me • Founder of Supply Chain Insights • LinkedIn Influencer • Guest Blogger for Forbes • Author of three books: Bricks Matter (2012), The Shaman’s Journal (2014) and Supply Chain Metrics That Matter (December 2014) • Partner at Altimeter Group (leader in open research) • Seven Years of Management Experience Leading Analyst Teams at Gartner and AMR Research • Eight Years Experience in Marketing and Selling Supply Chain Software at Descartes Systems Group and Manugistics (now JDA) • Fifteen Years Leading Teams in Manufacturing and Distribution Operations for Clorox, Kraft/General Foods, Nestlé/Dreyer’s Grand Ice Cream and Procter & Gamble Contact Information: • Email: lora.cecere@supplychaininsights.com • Blog: www.supplychainshaman.com (10,000 page views/month) • Forbes: www.forbes.com/sites/loracecere/ • Twitter: lcecere (6200 followers) • LinkedIn: www.linkedin.com/in/loracecere (46,000 followers)
  • 51.
    Supply Chain InsightsLLC Copyright © 2015, p. 51 Definition: Metric Equations Source: Supply Chain Insights LLC, Corporate Annual Reports (2000-2014) Metric Equations Cash-to-Cash Cycles = (Avg. Inventory/COGS + Avg. Accounts Receivable/Sales - Avg. Accounts Payable/Purchases)*91.5 Days of Inventory = (Average Inventory/COGS)*91.5 Days of Payables = (Average Accounts Payables/Purchases)*91.5 Days of Receivables = (Average Accounts Receivable/Sales)*91.5 Inventory Turns = (Cost of Sales/Average Inventory) Operating Margin = (Operating Income/Revenue) Return on Invested Capital = (Net Income/Invested Capital) Return on Net Assets = (Trailing 12 Month Net Income/Total Assets from the most recent quarter) Revenue Growth = (Quarterly Revenuei/Quarterly Revenuei-4 -1) Revenue per Employees = (Revenue/Average Annual Employee) #SCIWEBINAR