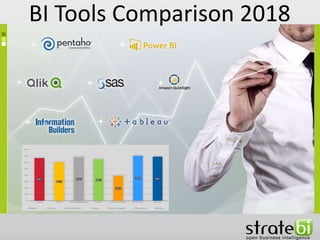
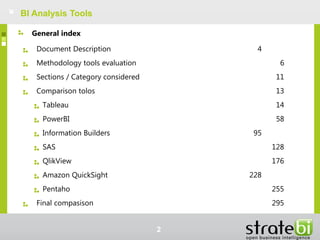
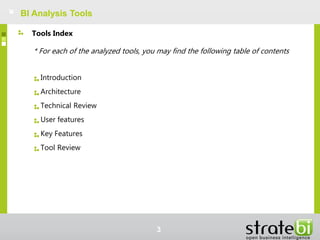
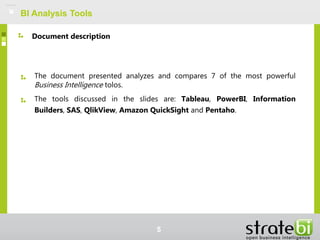
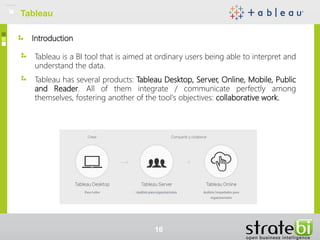
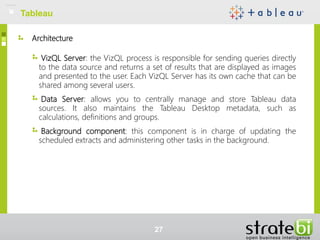
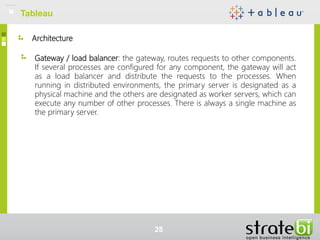
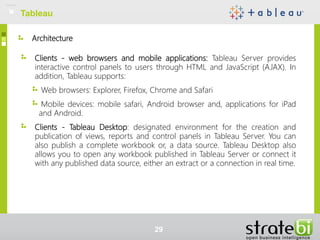
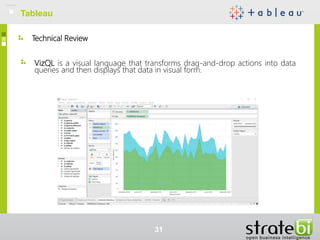
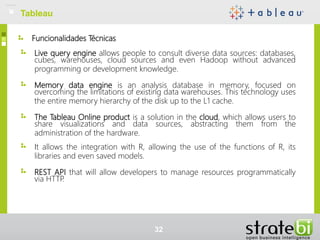
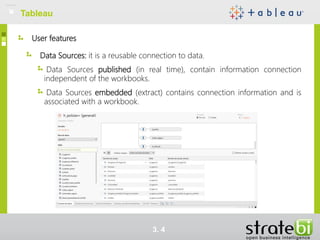
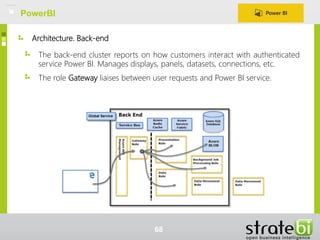
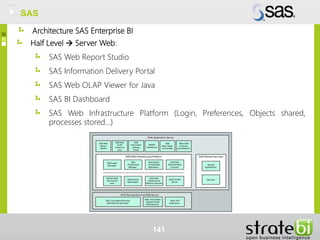
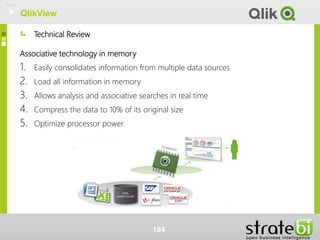
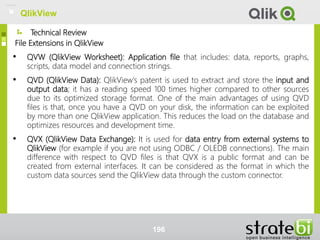
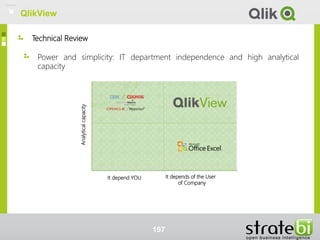
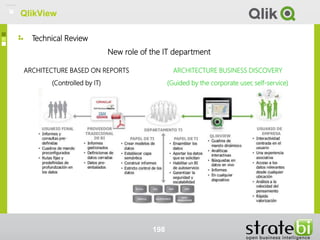
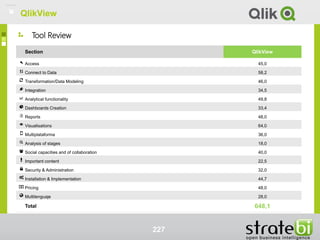
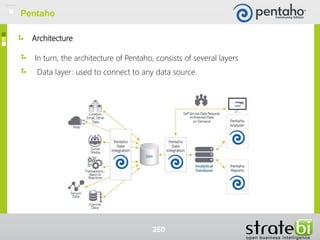
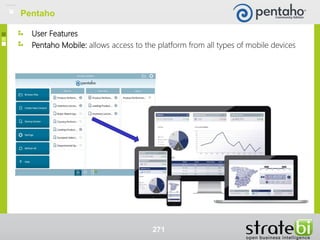
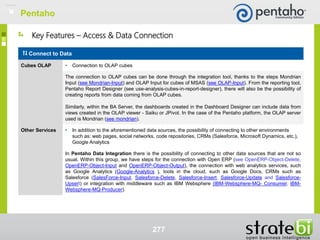
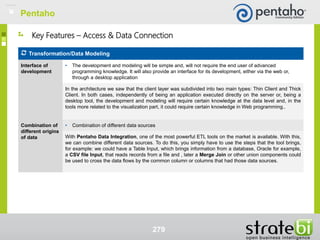
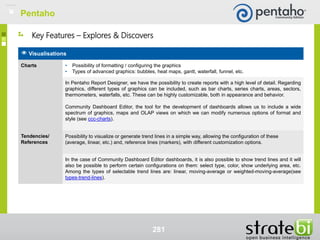
BI Tools Comparison 2018
Document Description 4
Methodology tools evaluation 6
Sections / Category considered 11
Comparison tolos 13
Tableau 14
PowerBI 58
Information Builders 95
SAS 128
QlikView 176
Amazon QuickSight 228
Pentaho 255
Final compasison 295
General index
BI Analysis Tools
2
* For each of the analyzed tools, you may find the following table of contents
Introduction
Architecture
Technical Review
User features
Key Features
Tool Review
BI Analysis Tools
3
Tools Index
Document description
BI Analysis Tools
4
BI Analysis Tools
The document presented analyzes and compares 7 of the most powerful
Business Intelligence tolos.
The tools discussed in the slides are: Tableau, PowerBI, Information
Builders, SAS, QlikView, Amazon QuickSight and Pentaho.
Document description
5
Evaluation methodology tools
BI Analysis Tools
6
BI Analysis Tools
To carry out the evaluation, we started with an evaluation file, on which 4 main
categories have been defined (tabs): Access & Connection to Data, Explore
& Discover, Share & Collaborate and Administration
These categories, in turn, are broken down into different sections of analysis.
For example:
In the category Administration, there are the sections: Security &
Administration, Installation & Implementation, Multilanguage and
For category Explore & Discover, these are the sections: Views, Analytics
functionality, Creating Dashboards, Reports, Multi platform Y Scenario
analysis.
Evaluation methodology tools
7
BI Analysis Tools
Finally, the criteria have been included under the sections. On these, a weight is
marked that will mark the importance of the criteria, this will go from 0 to 4,
depending on the importance that you want to give to the criterion.
The tools will comply more or less with the criteria. For this, it will be necessary to
specify a value, which will go from 0 to 3, which will mark the degree to which a
tool meets a certain criterion. So the associated result will depend on the
importance with which the criterion in question has been marked and, the degree
of compliance that the tool has for that criterion.
Evaluation methodology tools
8
importance Criteria evaluation Criteria
Option Value Option Value
0 - No Important 0 0 - Not Available 0
1 - Good having 1 1 - Minimum 1
2 - Required 2 2 - Suitable 2
3 - Major 3 3 - Excellent 3
4 - Essential 4
BI Analysis Tools
Let's take as an example the category Access & Connection to Data, where
we have the Access section, which is broken down into 2 criteria: Single web
access and Independence desktop application. Let us suppose, in turn, that we
have marked these criteria as; 4 - Essential and 2 - Necessary respectively.
Suppose also that the tool has obtained the following values: 2 - Suitable and
3 - Excellent. With this we would have to:
Single web access: 4 - Essential * 2 - Suitable = 4 * 2 = 8
Independence of… : 2 - Required * 3 - Excellent = 2 * 3 = 6
To obtain the total evaluation for the analyzed section, Access in this case, we
would average the results obtained in the criteria under this section. Therefore:
(8 + 6) / 2 = 7
Finally, the sections also have a weight, which ranges from 1-6. For example,
let's say that Access is marked with a weight 5. We would have that: 7 * 5 = 35
Evaluation methodology tools
9
BI Analysis Tools
For the final construction of Tool Reviews, there is a section that we called
Result, Which corresponds to the screenshot shown in paragraph Tool
Review.
he Result section contains all the sections of the different categories. On
these, as we have seen, a weight (1-6) will be applied, which will define the
importance given to the sections. For the calculation, based on the score
obtained by the different tools in the different sections (average of the scores
associated with the criteria under the sections), they will be multiplied by the
weight that has been defined and will give us the final result of the tool for
each of the sections
Finally, all the values obtained in the different sections and obtain the final
evaluation will be added.
Evaluation methodology tools
10
Sections / Category considered
BI Analysis Tools
eleven
12
Section Category Weight
Access Access & Data Connection 6
Connect to Data Access & Data Connection 6
Transformation / Data Modeling Access & Data Connection 6
Integration Access & Data Connection 6
Analytics functionality Explore & Discover 6
Dashboards creation Explore & Discover 6
Reports Explore & Discover 6
Views Explore & Discover 6
Multiplatform Explore & Discover 4
Scenario analysis Explore & Discover 3
Social skills and collaborative Share & To collaborate 5
Important content Share & To collaborate 3
Security & Administration Administration 6
Installation & Implementation Administration 6
Pricing Administration 6
Multilanguage Administration 4
BI Analysis Tools
Sections / Category considered
Comparison tools
BI Analysis Tools
13
Tableau
14
Introduction
Tableau
fifteen
Introduction
Tableau is a BI tool that is aimed at ordinary users being able to interpret and
understand the data.
Tableau has several products: Tableau Desktop, Server, Online, Mobile, Public
and Reader. All of them integrate / communicate perfectly among
themselves, fostering another of the tool's objectives: collaborative work.
Tableau
16
Tableau Desktop
Desktop application that allows you to generate visualizations in a simple
way. It is designed to adapt to the way of thinking of people. Available for
Windows and Mac.
Connection to very diverse data sources: relational databases, cloud, big
data, etc. It abstracts the user from advanced knowledge of databases or
programming.
Wide variety of visualizations / graphics available. Integration with simple
and powerful maps. All graphics and components have powerful
interaction capabilities between them.
Possibility to create interactive presentations, called stories within the
Tableau environment.
Advanced analysis options. Among them, the possibility of including
reference lines, prediction functions, creating formulas or calculations
through existing data, etc.
Tableau
17
Tableau Server
Integrated with Tableau Desktop so that, once developed a Dashboard
with the desktop version, we publish / share in Tableau Server safely.
Available only for Windows servers.
Tableau Server allows you to organize information sites, allowing for
example, categorize information by department: Human Resources,
Marketing, etc.
Accessible from browser or mobile device. To interact with the views, for
further questions about the data.
It presents powerful management capabilities: resource sharing, setting
hardware / server memory, defining data sources, security, advanced
search solutions, etc. visual interface specification permits users.
Tableau
18
Tableau Online
"In the cloud" version of Tableau. Saves hardware costs and installation /
configuration times.
Accessible from browser or mobile device. Allows you to interact with the
views, to ask new questions about the data.
Security. Only authorized users will be able to interact with your data and
dashboards.
Programming of data updates and, alerts in cases where data connections
are not established.
Subscriptions Possibility of subscribing to jobs, receiving notifications
directly in the email.
Tableau
19
Tableau Mobile
Tableau mobile version. Available in App Store (IOS) and google Play
(Android).
Interactivity and usability adapted to mobile touch devices.
Ability to modify the analysis by adding calculations and filters.
Tableau
twenty
Products. Tableau Public
Free version for visualization and interaction with data. Available for
Windows and Mac.
Connectivity to files / limited databases. Possibility of connecting to files:
Excel, Access, Statistical file or text file. It also connects to an OData server.
The work is saved only in your Tableau profile. It is not possible to have it
on your local hard drive.
Products. Tableau Reader
Free desktop version. You can open data visualizations created with
Tableau Desktop. Available for Windows and Mac.
Tableau
twenty-one
Architecture
Tableau
22
Architecture
Tableau provides a scalable solution for creating and delivering web, mobile
and desktop analysis.
It has a client-server, as shown in the figure below, provides services to
different customers architecture: web, mobile, tablet and software installed
on desktop computers.
Tableau
2. 3
Architecture
Tableau architecture consists of the following layers: data layer, data
connectors, Tableau Server components, gateway / load balancer and
customers.
Tableau
24
Architecture
Data layer: Tableau does not require that your data be stored in a single
system. This adapts perfectly to organizations, since they usually have a
heterogeneous data environment: databases, cubes, Excel files, etc. Tableau
provides easy options to manage the data in order to access them quickly,
thanks to the in-memory data engine.
Data connectors: includes a number of data connectors optimized for
databases such as Microsoft Excel, SQL Server, Oracle, Teradata, Vertica,
Cloudera, Hadoop and many more. Also, there is a generic ODBC connector
for any system without a native connector. Tableau provides two modes of
interaction with the data: in real time or in memory.
Tableau
25
Architecture
Real-time connection: appropriate for environments where databases have
an effective and optimized performance. Tableau is the front-end for many
of the most popular data bases client.
In Memory: Tableau offers a fast engine data memory that is optimized for
analysis. You can connect your data and then extract your data to gather in
memory.
Tableau Server components: work Tableau Server is controlled by the
following four server processes:
Application server: process control application server and exploration
permits for web and mobile interfaces Tableau Server. When a user opens a
view on a client device, the user starts a session on Tableau Server. This
means that an application server process starts and checks the permissions
for that user and that view.
Tableau
26
Architecture
VizQL Server: the VizQL process is responsible for sending queries directly
to the data source and returns a set of results that are displayed as images
and presented to the user. Each VizQL Server has its own cache that can be
shared among several users.
Data Server: allows you to centrally manage and store Tableau data
sources. It also maintains the Tableau Desktop metadata, such as
calculations, definitions and groups.
Background component: this component is in charge of updating the
scheduled extracts and administering other tasks in the background.
Tableau
27
Architecture
Gateway / load balancer: the gateway, routes requests to other components.
If several processes are configured for any component, the gateway will act
as a load balancer and distribute the requests to the processes. When
running in distributed environments, the primary server is designated as a
physical machine and the others are designated as worker servers, which can
execute any number of other processes. There is always a single machine as
the primary server.
Tableau
28
Architecture
Clients - web browsers and mobile applications: Tableau Server provides
interactive control panels to users through HTML and JavaScript (AJAX). In
addition, Tableau supports:
Web browsers: Explorer, Firefox, Chrome and Safari
Mobile devices: mobile safari, Android browser and, applications for iPad
and Android.
Clients - Tableau Desktop: designated environment for the creation and
publication of views, reports and control panels in Tableau Server. You can
also publish a complete workbook or, a data source. Tableau Desktop also
allows you to open any workbook published in Tableau Server or connect it
with any published data source, either an extract or a connection in real time.
Tableau
29
Technical Review
TableauTableau
30
VizQL is a visual language that transforms drag-and-drop actions into data
queries and then displays that data in visual form.
Technical Review
TableauTableau
31
Live query engine allows people to consult diverse data sources: databases,
cubes, warehouses, cloud sources and even Hadoop without advanced
programming or development knowledge.
Memory data engine is an analysis database in memory, focused on
overcoming the limitations of existing data warehouses. This technology uses
the entire memory hierarchy of the disk up to the L1 cache.
The Tableau Online product is a solution in the cloud, which allows users to
share visualizations and data sources, abstracting them from the
administration of the hardware.
It allows the integration with R, allowing the use of the functions of R, its
libraries and even saved models.
REST API that will allow developers to manage resources programmatically
via HTTP.
Funcionalidades Técnicas
TableauTableau
32
User features
TableauTableau
33
User features
Data Sources: it is a reusable connection to data.
Data Sources published (in real time), contain information connection
independent of the workbooks.
Data Sources embedded (extract) contains connection information and is
associated with a workbook.
TableauTableau
3. 4
User features
Workbooks: like workbooks in Excel. They contain one or more sheets, which
can be: worksheets, dashboard and stories. Let you organize, save and share
results.
Leaves: where data views to drag and drop fields on the shelves are created.
TableauTableau
35
User features
Cards and shelves: cards are containers for shelves, legends and other
controls.
TableauTableau
36
User features
Dashboard: combination of several views that can arrange for presentation
or to monitor.
History: is a sequence of views or dashboards, which are used together to
display information.
TableauTableau
37
Key Features
TableauTableau
38
Key Features - Access & Data Connection
TableauTableau
39
Connect to Data
Archive • Ability to set file as the source data. For example: Excel, CSV, XML, Text.
In Tableau, it allows the connection to Excel files, text files, Access files, statistics files or other files, such
as workbooks or data extractions from Tableau. There is also a data interpreter that allows cleaning tasks
on the files to which it connects. In addition, if you use the interpreter, it allows you to inspect the changes
or incidents that you resolved and how you did it.
Possibility of carrying out advanced operations on files: convert information to table, possibility of editing
the names of columns, data types, possibility of dividing columns by delimiter, etc. (see data-with-files).
Bases de datos • Connections to databases. For example: Oracle, SQL Server, MySQL, PostgreSQL, Teradata, IBM
DB2, etc.
It includes a good number of connectors for databases. Among the main connectors are: Oracle, Firebird,
HP Vertica, Microsoft SQL Server, MySQL, Oracle, PosgtgreSQL or Teradata. Also, it has a generic
ODCB connection for any system without a native connector (see connection-db).
Key Features - Access & Data Connection
TableauTableau
40
Connect to Data
files SAS • SAS7BDAT reading files SAS
Allows seamless connection to SAS (* .sas7bdat), simply: Connect> Archive statistics. It supports a
single table per file statistics. Once the file is loaded, you can perform various operations: data display,
manipulate metadata fields and rows sort, hide / rename fields, etc. (see statistical-file)
Cloud / Big Data • Ability to connect with Big Data environments or Cloud, type Hadoop, Spark, Microsoft Azure, etc.
Tableau It is aligned with the most cutting-edge advances in database managers, including the already
established databases NoSQL and distributed environments for processing files, as Hadoop or Spark.
Tableau It has connectors Spark SQL, Google BigQuery, Cloudera Hadoop, MapR Hadoop Hive,
Splunk, DataStax Enterprise, etc.
Some success stories where it has been used Tableau Big Data environments are: yellow-pages-Canada,
mappy or progressive-insurance.
Key Features - Access & Data Connection
TableauTableau
41
Connect to Data
OLAP cubes • Connecting to OLAP cubes
As other data sources, you can work with OLAP cubes in offline mode. including calculated members in
MDX is allowed. OLAP data sources available are: Oracle Essbase and Microsoft Analysis Services
(MSAS). There are certain limitations onTableau when we connect to a cube, such as aggregations
calculation functions: SUM, AVG, CNT, can not be overwritten dimensional cell values, can not be grouped
measures can not be created hierarchies, etc. However, for these limitations alternative approaches that
would lead us to the same result could be taken. (see tableau-OLAP)
Key Features - Access & Data Connection
TableauTableau
42
Connect to Data
Other services • In addition to the previous mentioned data sources, possible connection to other environments such as
web pages, social networks, code repositories, CRMs (salesforce, Microsoft Dynamics, etc), Google
Analytics
In Tableau you can also access other sources not as common data such as web pages. To do this, it
would be necessary to create a web connector, which will process these data (JSON, XML or HTML). For
this purpose, it uses the SDK would, through Javascriptand HTML. also comment that in the community
have already created certain Web connectors, eg for JIRA,MapBox, Fitbit, etc. Furthermore, the
connection is allowed toCRMs, as salesforce, SAP (SAP Hana, SAP Sysbase ASE, Etc.), analytical sites
to sites, such as Google Analyticsservices and other sources. (see connecting-salesforce and
connecting-Google-analytics)
Offline mode • Availability of having data in memory for agility in response time
• Ability to view data offline
When we connect to data sources, Tableau can maintain a connection real time or, memory. Since the
data engine can access disk storage and RAM and cache, it is not limited by the amount of memory in a
system. There is no requirement that the entire data set is loaded into memory to achieve their
performance goals
Key Features - Access & Data Connection
TableauTableau
43
Transformation / Modeling Data
Interface
development
• Development and modeling will be simple and will not require the end user advanced programming
knowledge. In addition it will provide an interface for development, either via web or through a desktop
application
The development interface is extremely intuitive and will allow users to create visualizations very simply,
simply drag and drop components and make small adjustments. The development of visualizations can be
done from the desktop version or from versionServer or On-line. They are not intended to replace the
desktop version, but also offer certain capabilities when creating / viewing analysis. Of course, there are
also more advanced operations, such as creating expressions / custom formulas or expressions LOD
LOD. Here, things are not so trivial.
Combination of
different data
sources
• Combination of different data sources
Multiple data sources in a few connection can be made to one or "clicks". In addition, these sources may
be combined in the displays to be created. Logically, when we combine different data sources, they have
to have columns in common (see combination-data-sources-different).
Key Features - Access & Data Connection
TableauTableau
44
Integration
Interface
development
• Customized Portal
Tableau allows the embedding of views within web pages, blogs, wiki, intranet portals. These, follow the
same conditions as those present in Tableau Server in terms of licensing and restrictions. That is, to see
an embedded view, the person accessing the view must have an account in Tableau Server. You can
embed the views in two ways: through the share button present in the views, which generates the code
that can be copied and pasted into the desired web page or, by entering the custom embed code (see
embed-views).
TableauTableau
Four. Five
Views
Graphics • Ability to format / configure graphics
• Advanced charting types: bubbles, heat maps, gantt, waterfall, funnel, etc.
The graphics can be created / modified in a very simple way with a few mouse "clicks". The rack marks,
gives the user a great potential for personalization to the user, being able to establish colors / shapes for
the categories, establish descriptions and labels, etc. Regarding the types of graphics, Tableau Desktop
offers a variety of visualizations: areas, lines, bars, map, tree diagrams, etc. In addition, it is possible to
build other more advanced graphics (Pareto diagrams, cascade graphics, funnel, etc.), in a non-direct
way, as shown in the training videos of your website (Section "How to do it” https://www.tableau.com/es-
es/learn/training
Trends /
References
• Possibility to visualize or generate trend lines in a simple way, allowing the configuration of these
(average, linear, etc.) and, reference lines (markers), with different customization options
As long as you are working with numeric data, Tableau, in its Analysis panel of the worksheets, gives the
possibility of showing and configuring trend lines. Among the options that could be configured are the Type
of model: linear, logarithmic, exponential or polynomial, and other Options such as: showing the
confidence bands, allowing different trend lines by color, etc. In addition, you can export the data from the
trend line to Access format. As for the reference lines, they can also be shown, through the Analysis panel.
There are several configuration options on the reference lines, select the value to build the line, the label
to be displayed, the format of the line, etc. (see trend-lines and lines-reference).
Key Features - Explore & Discover
TableauTableau
46
Funcionalidad Analítica
Fórmulas • Possibility of incorporating new variables from custom calculations / formulas
• Existence of predefined functions. Functions for the calculation of% growth, trends, inclusion of
financial functions, temporary functions, etc.
You can create fields calculated from the data present in the analyzes. To do this, just click "right" in the
data panel and "Create calculated field". Here, we will have several predefined functions depending on the
type of data. For example: ABS, COS, SIN, FLOOR, etc. for Numbers, CONTAINS, LOWER,
STARTSWITH, etc. for Chains. In addition to these types of data, there are predefined functions for Dates,
Type Conversion, Logic and Sets. Especially interesting are the User functions, which allow us to access
the information of the authenticated user, his name, the group to which you belong, etc. and Table
Calculation functions: FIRST, MAX, RUNNING_SUM, RANK_DENSE, etc.
You can perform calculations in another way, the so-called level of detail expressions LOD (see
expressions-LOD). With these, we can calculate the aggregations that are not in the level of detail of the
view. For example, we might want to see, the frequency of orders placed by customers or, we might want
to calculate, the contribution of each country to global sales (more examples in: LOD-expressions)
Key Features - Explore & Discover
TableauTableau
47
functionality Analytics
Forecasting • Allows predictions based on predefined algorithms
Forecasting or prognosis, as is currently known within the environment Tableau allows generating, from a
statistical model predictions about the data. To make predictions, we need in the analysis, at least one
date field, a move to 5 data points. Estimation options can be changed, allowing you to select the date
range that will predict, select the dataset to consider in the forecast, or confidence intervals, the prediction
model. At this point, we have some restrictions, we can not make predictions about cubes on table views
with calculations or measurements or unbundled dimensions (see https://www.tableau.com/es-
es/learn/tutorials/on-demand/forecasting).
Statistical tools
/ data mining
• Integration with external tools to add functionality predicitivas (R, Weka, Python)
In Tableau, you can access the functions and statistical models R. To do this, you need access to a server
R to be accessed either from Tableau Desktop or from Tableau Server. There are 4 integrated
functionsTableau: SCRIPT_REAL, SCRIPT_STR, SCRIPT_INT, SCRIPT_BOOL. All these models are
used to invoke specific features and R and the only difference between them is the kind of result
generated. There are some limitations:
You can not be exported from Tableau R directly to run new models, if not by the SCRIPT_ functions *
They can not be imported visualizations created in R to Tableau
can not import data sets R to Tableau. However, it is possible to use R and export data through a
supported data source,.csv for example, and then display it in Tableau (see how-integrate-r-and-tableau
and using-r-Within-tableau).
Key Features - Explore & Discover
TableauTableau
48
functionality Analytics
Data Discovery • Interactivity between graphics and other components. As the user selects certain parts of
Dashboard.The graphics will be updated as appropriate
Available in Tableau of a Dashboard fully interactive and integrated, it is quite simple. In order to obtain it,
we need to use basically 3 elements:
• Filters: Cut the data you are viewing. Within these settings, you can specify its scope. If you
select Apply to worksheets> All using this data source, we will make any changes on the filter
affects all components sharing the data source. (see quick-filters Y additional-filtering-topics)
• Parameters: Provide a single result in another element. Useful when the value has been
incorporated into another element, such as a filter, a set, or reference line calculated field. We can
link multiple views of the same parameter. (see parameters)
• Actions: There are 3 types of actions: filter, that filter (when "click"About a country on a map, for
example) or shoulder, protruding (when mouse over a country for example). URL actions,
including field values ​​as dynamic entries. The latter could be used for example to display the
Wikipedia entry for the selected country. (see dashboard-interactivity-using-actions).
Key Features - Explore & Discover
TableauTableau
49
functionality Analytics
Maps
integration
• Possibility to display data on maps in a simple way. The maps can be integrated via:country, City, zip
code, latitude & longitude
• Interactivity map. Possibility of clicking on the locations shown on the map and modify the content of
these other components within the Dashboard/Panel
• Heatmaps. Possibility of certain color intensities based on the underlying securities.
Tableau allows the integration of maps into your visualizations. Tableau has an internal database that can
recognize the names of common geographical areas, such as country, state, city, etc. If the tool does not
automatically recognize a geographical role, it can become at the appropriate level from the context menu.
For any geographic column we have in sight,Tableau automatically generated torque: latitude, longitude
associated. It may happen, that no correspondence between the geographic role and internal database of
Tableau. In these cases, they may be edited unrecognized locations.
We can show on maps, brands or different sizes and shapes, we are able also to show maps choropleth.
You can add a browser to the map, besides the usual zoom options. several configuration options on
maps, like the layers show is also presented: costa, country boundaries, state names, etc. Additionally,
you can set background maps from MapBox (see maps-tableau and MapBox-integration).
Key Features - Explore & Discover
TableauTableau
fifty
Multi platform
Mobile
platforms
• Availability in different mobile platforms: Android, iOS, Windows Phone
• Mobile version of the tool provides the user with features sharing / collaboration with other users
One of the products offered Tableau, is Tableau Mobile, Native applications available iPhone, iPad and
devices Android. We may edit or interact with displays from mobile devices intuitively, since the
controlsdashboards They adapt automatically to these devices.
In the case of iPad Y iPhones, Will be available favorite user views as high-resolution images even when
working offline. Ability to subscribe to relevant information from the application.
Key Features - Explore & Discover
TableauTableau
51
capabilities social and collaborative
Alerts and
notifications
• Ability to receive alerts or notifications. You are notified, for example, when a threshold is exceeded
preconfigured.
Default, Tableau integrates 3 types of alerts. They shall be notified via mail periodically based on an
established configuration. To work properly, you must configure the SMTP server that will useTableau
Server to send mails.
• Subscriptions views
• Mail alerts for system failures
• Alerts based on disk utilization, and can configure sending mails when certain thresholds are exceeded
pre-configured
To receive alerts and notifications based on variables used in displays, Tableau It not included but there is
an alternative developed by the community Tableau which provides it with this functionality (see
https://community.tableau.com/docs/DOC-7329)
Key Features - Share & Collaborate
TableauTableau
52
capabilities social and collaborative
To export • Export Graphics /dashboard PDF, PNG
• Export values ​​to CSV, XLS / XLSX
• Share dashboard with other users without access to these data sources. The data will be packaged /
included within itselfDashboard
• The tool allows you to export the data sources so that they can be loaded later
Tableau It offers the ability to download a display shown from Tableau Server or Tableau On-line to
subsequently loaded from Tableau Desktopand to modify it. In addition, we also export a display image
data (format.txt), Crosstab or PDF. The displayed content can also be shared with other users via mail. In
this case, you would be asked to issue user credentials before they can view the content. As already seen
in some previous point, the data can be packaged in the workbook.
distribution
planner
• Delivery of reports /dashboards via mail
In Tableau, the contents are created from application Desktop to subsequently publish either version
Server or in the On-line. Tableaua scheduler has no content itself. However, this functionality could be
achieved otherwise. To do this, it would make a small script to take care of this task (see
http://kb.tableau.com/articles/knowledgebase/using-tabcmd).
Key Features - Share & Collaborate
TableauTableau
53
Security & Administration
Security • Level permissions Report /Dashboard
• Data-level permissions
• Application of Statistical Secrecy (LOPD). Hiding sensitive information
• Integration with third-party authentication services (CAS, LDAP, AD, etc)
• The information is always displayed based on the roles to which users belong, limiting the information
to be displayed as appropriate
In Tableau there are 3 levels of security: access, object and data. Regarding access security,Tableau
Server supports 3 types of authentication: microsoft Active Directory, Local authentication administered
Tableau Server and reliable authentication creates a relationship of trust between Tableau Server and
one or more web servers. As for security purpose, the contents published, as data sources, workbooks
and views, can be administered with permits for typical actions view, create, modify and delete. You can
create groups to facilitate permission management, such as "marketing users."
Finally, data security can be achieved through capacity Table auto have filters which, depending on the
user or group, the data displayed is restricted. There is also the possibility of configuring communications
between Tableau Desktop and Tableau Server for HTTPS.
Key Features - Administration
TableauTableau
54
Security & Administration
Security • Security integration via JDBC
• Integration Application Servers
On the point Data Access & Wireless> Integration> Custom PortalAs we have seen that they can
"imbibe" views on personalized portals (see embed-views), So that integration with common applications
servers, could be carried out smoothly. However, it is worth noting that, despite views to embed within an
application within all application servers would not be possible to deploy Tableau Server on all servers.
This would only be possible toMicrosoft Windows Server 2008 SP2 or later.
Tableau accepts impersonation, through which allows a user to act on behalf of another user account. So
that you can set Tableau Y Microsoft SQL Server for impersonation user database, so that the account
database used by SQL Server Tableau Server conduct inquiries on behalf of users of the database SQL
Server, which are also users Tableau (see impersonalization, impers_requirements, impers_how).
Roles user /
group
• Possibility of establishing roles for Users / Groups
As already mentioned in the Security section, published content, such as data sources, workbooks and
views, can be administered with permits for typical actions view, create, modify and delete. You can create
groups to facilitate permission management, such as "marketing users."
Key Features - Administration
TableauTableau
55
Installation & Implementation
Citrix • Possibility of development in virtualized servers (Citrix MetaFrame, XenApp)
Tableau products work in virtualized environments when they are configured with the appropriate hardware
and operating system. We would install the tool and, subsequently, we would need to activate it with the
product key
volumetry • Ability to work with large data volumes
A Tableau extraction (* .tde) is a subset of data that we can use to improve the performance of your
workbooks. These extractions are based on columnar models, which means that the data is stored in
column sections, which allows maximum compression of the data. An extract from Tableau is not a
replacement for the Data Warehouse, so it is important that the underlying servers and databases are
powerful. In the following link, some tees made with Tableau Desktop and different datasets can be seen:
http://blog.crgroup.com/how-much-data-can-tableau-handle/
Tableau Server
Tableau Server can be configured for high availability. For this, it would be necessary to make the
configuration to integrate redundancy, which reduces the possibility of inactive time. The four areas that
require redundancy are the data engine, repository, and link processes, and the primary Tableau Server.
Obviously, this type of configuration requires several nodes. The minimum configuration for high
availability is a three-node system (see high-availability). To install Tableau Server in several nodes, you
must have a license for multi-machine cores from Tableau Server
Key Features - Administration
Tool review
TableauTableau
56
Tool Review
TableauTableau
57
Section Tableau
Access 36.0
Connect to Data 58.2
Transformation / Data Modeling 50.0
Integration 34.5
Analytics functionality 63.2
Dashboards Creation 36.0
Reports 24.0
Views 72.0
Multi platform 36.0
Scenario analysis 18.0
Social skills and collaborative 39.5
Important Contents 27.0
Security & Administration 39.3
Installation & Implementation 52.7
Pricing 48.0
Multilanguage 32.0
Total 666.4
PowerBI
58
Introduction
PowerBIPowerBI
59
Introduction
Power BI transforms corporate data into visual objects, allowing the user to
focus on what really matters.
It consists of a set of business analysis applications that enable analysis of
data and information sharing.
PowerBI
60
Power BI Desktop
Ease of creating visualizations. Simply drag and drop the items where
desired.
Transforms / modeling and data cleaning.
Ability to share / publish the information.
PowerBI
61
Power BI
Cloud version of Power BI. Service that reports subsequently be accessed via
Power BI Desktop or Mobile will be published.
Possible connection to a variety of data sources.
Customized content. These include panels, reports and data sets containing
a series of displays.
Groups Power BI adds collaboration capabilities to make everyone use the
correct data.
REST API open to enable the integration of apliciones / services.
PowerBI
62
Power BI Mobile
Version adapted to mobile devices. It has native applications on Windows,
iOS and Android.
Data-driven alerts to keep updated with the most current data.
Possibility of sharing reports and dashboards. Annotations can also be
performed on the displays for the rest of team members to see.
PowerBI
63
Power BI Gateways
Tool that acts as a bridge between the Power BI service and data sources,
taking care of your soda or upgrade.
It installs and runs as a service with the Windows account. Only available in
the Pro version Power BI versions of Windows 64 bits.
Useful to refresh local data sets loaded from: books Excel 2013 or later, or
Power BI Desktop files. Different data sources on which settings can be
made, depending on the version: Personal or Enterprise.
Ability to schedule the frequency with which the data will be refreshed.
Data traffic between Power and Power BI BI Gateways service is done safely
through Azure Service Bus.
PowerBI
64
Architecture
PowerBI
65
Architecture
Each implementation of Power BI consists of two clusters: a front-end web
(WFE) And a back-end.
PowerBI
66
Architecture. Front-end
WFE manages the authentication process
and initial connection
AAD It provides tokens for connections to
users
He Azure Traffic Manager directs traffic to
the nearest data center
Power BI uses Network Azure content
delivery (CDN) to effectively distribute the
necessary static content and files to users
depending on the geographic region
PowerBI
67
Architecture. Back-end
The back-end cluster reports on how customers interact with authenticated
service Power BI. Manages displays, panels, datasets, connections, etc.
The role Gateway liaises between user requests and Power BI service.
PowerBI
68
Architecture. Data Storage
Power BI uses two repositories for storing and
managing data.
The data stored by users, typically target
Azure BLOB. An example would be when a
user imports an Excel file into a workbook, in
this case the data would be stored in
memory (for 1 hour approx.)
Metadata and artifacts of the system itself are
stored in SQL Azure Database. For example,
information to be sent to this store will be:
dashboards, reports, recent data sources,
workspaces, etc.
PowerBI
69
Technical Review
PowerBI
70
Power BI consists of a number of components, harmonically integrated.
Power Pivot: It is the engine that performs all calculations (in memory),
brings together all the data and creates the analytical model that can be
exploited later with other tools
Power Query: solution for data easily with search functionality, processing
and cleaning them
Power View: data visualization tool for exploring data simple, intuitive and
interactive way
Power Map: 3D display to map, explore and interact with the geographic
and temporal data.
Technical Review
PowerBI
71
Technical Review
Cloud: Power BI is a cloud service that allows users to view and analyze data
easily.
Allows the execution of scripts R and import the resulting data sets in a data
model of Power BI Desktop.
DAX: collection of functions, operators and constants that can be used in a
formula or expression, thus being capable of creating information from other
data already.
Queries in Natural language (so far only supported in English). Feature that
makes the difference compared to other tools in the market, asks questions
of their models and the system is capable of performing filters, systems and
clusters that satisfy your question generating new graphics as a result.
Power BI can be extended using REST APIs that facilitate the development
tools integration with Power BI.
PowerBI
72
User features
PowerBI
73
User features
Data origin: It is the location where the data actually come. For example:
Google Analytics, a SQL data or local file, etc.
Datasets: It contains information about the data source, the user credentials
and, most often, a subset of data copied from this data source.
PowerBI
74
User features
Report: composed of one or more page views (graphics and images). A
report may be associated with several panels can be created using data from
a dataset and that report could be imported into Power BI.
PowerBI
75
User features
Panel: It is a single canvas that contains one or more icons or widgets. Each
icon shows a single view created from a dataset and anchored to the panel.
A panel displays can display many different data sets and reports.
PowerBI
76
Key Features
PowerBI
77
PowerBI
78
Key Features - Access & Data Connection
Connect to Data
Archive • Ability to set file as the source data. For example: Excel, CSV, XML, Text.
Power BI allows obtaining data files Excel, CSV, XML, Text, JSON and even lets you import metadata
and links about files in a folder.
Databases • Connections to databases. For example: Oracle, SQL Server,MySQL, PostgreSQL, Teradata, IBM
DB2, etc.
It includes a number of data connectors optimized for databases. Among the main connectors they are:
Access, IBM DB2, SQL Server, MySQL, Oracle, PosgtgreSQL Y Teradata Also it has a connecting
ODCB generic for any system without a native connector.
SAS files • Ability to connect with Big Data environments or Cloud, type Hadoop, Spark, Microsoft Azure, etc.
PowerBI integrates some possibilities for communication with Cloud and Big Data environments. Some
possibilities in the Cloud section are the possibility of obtaining data Azure HDInsight Spark (Beta) or
microsoft Azure Document DB (Beta) version NoSQLMicrosoft oriented documents. SincePower BI also
given the opportunity to connect with Apache Hadoop (HDFS) or Spark (Beta).
PowerBI
79
Key Features - Access & Data Connection
Connect to Data
Cloud / Big Data • Ability to connect with Big Data environments or Cloud, type Hadoop, Spark, Microsoft Azure, etc.
Power BI integrates some possibilities for communication with Cloud and Big Data environments. Some
possibilities in the Cloud section are the possibility of obtaining data Azure HDInsight Spark (Beta) or
Microsoft Azure Document DB (Beta) NoSQL version oriented to Microsoft documents. Since Power BI
also given the opportunity to connect with Apache Hadoop (HDFS) or Spark (Beta).
OLAP cubes • Connecting to OLAP cubes
With Power BI, we can access SSAS multidimensional models. To do this, from the window of "Get
Data", selectDatabase> SQL Database Server Analysis Services. With this type of connection,
consumption various elements are supported, including: KPI trends, default members, dimension
attributes, hierarchies, etc. There are also some restrictions on the use of multidimensional models. (see
https://powerbi.microsoft.com/es-es/documentation/powerbi-desktop-ssas-multidimensional/)
PowerBI
80
Key Features - Access & Data Connection
Connect to Data
Other services • In addition to the afore mentioned data sources, possible connection to other environments such as
web pages, social networks, code repositories, CRMs (salesforce, Microsoft Dynamics, etc), Google
Analytics
PowerBI has the ability to connect to a variety of services. InPower BI can access information as directory
services Active Directory, CRMs as Dynamis CRM Online or Salesforce (possibility of access to
objects or reports, powerbi-content-pack-salesforce) Social networks like Facebook, Code repositories as
Github (powerbi-content-pack-github), Service providers email marketing as MailChimp and many others.
Offline mode • Availability of having data in memory for agility in response time
• Ability to view data offline
We have the ability to work offline mode via the product Power Mobile BI. This, will allow access to the
latest information, even with limited connectivity. This is possible thanks to the behavior of the application
every 2 hours, updates the contents of the views and the “caches" so that they are accessible even with
limited connectivity (so far available for Android devices and iOS, (see offline-capabilities-for-power-bi-
mobile-apps).
PowerBI
81
Key Features - Access & Data Connection
Transformation / Modeling Data
Interface
development
• Development and modeling will be simple and will not require the end user advanced programming
knowledge. In addition it will provide an interface for development, either via web or through a desktop
application
Power BI Desktop has an intuitive interface development will allow users to create analysis of a very
simple way. Basically, it is sufficient that the user select the items to display and drag on the view, then you
can adjust and format the graphic objects as desired.
Generally speaking, it has a great usability. However, other operations, such as creating measures /
custom columns that require more advanced skills.
Combination of
different data
sources
• Combination of different data sources
To combine different data sources PowerBI, Simply go to the option Edit queries> combine queries,
Where we can select queries to merge, and the type of combination (similar to JOINS: LEFT, RIGHT,
INNER, etc.). Clearly, if the merge process is satisfactory, the data sources must maintain columns in
common.
PowerBI
82
Key Features - Access & Data Connection
Integration
personalized
Portal
• Possibility of integration into an external portal (Liferay, Sharepoint, etc)
The PowerBI team is studying the possibility of integration and reporting and dashboards with online
pages in SharePoint (see power bi Ideas).
Additionally, with Power BI, it is possible to integrate reports and icons from a Power BI account by
inserting an IFrame element in an application, such as a mobile application or a web application (see to
integrate power bi tile).
PowerBI
83
Views
Graphics • Ability to format / configure graphics
• Advanced charting types: bubbles, heat maps, gantt, waterfall, funnel, etc.
Once configured the data sources, managed relationships and other operations are required, we can
create reports quickly and intuitively.
From the report view, you can create visualizations that can then be published in Power BI, and anchored
to a panel. From the side panels Visualizations and Fields, we can configure the analyzes. To do this, we
will select the desired fields and the visualization that best suits the analysis that wants to be done.
Subsequently, adjustments can be made to the graphics: colors, labels, title, etc.
Key Features - Explore & Discover
PowerBI
84
Views
Trends /
References
• Possibility to visualize or generate trend lines in a simple way, allowing the configuration of these
(average, linear, etc.) and, reference lines (markers), with different customization options.
They can be displayed and configured reference lines Power BI (see baselines). For this purpose, there
are two possible options:
• Through the side panel Views, Activate the option Reference line and it gives you the ability to
set certain parameters as: value (line location), color, transparency, style, tag, etc.
• Creating a new field (column) in the data set and then using the value of said column displays to
display.
As for trends, PowerBI does not have a direct functionality to get it. However, the PowerBI team is
working on this functionality so that will probably be included in future versions of the product (see ability-
to-add-trend-line-to-charts).
Key Features - Explore & Discover
PowerBI
85
Analytics functionality
formulas • Possibility of incorporating new variables from calculations / custom formulas
• Existence of predefined functions. Functions for calculating the% growth, trends, including financial
functions, temporary functions, etc.
Power BI allows the creation of computed columns (see calculated columns). In this way, they can add
new data to an existing table in the model. To create this column, a formula expression data analysis
(DAX) defining column values ​​will be created.
The DAX formula language (see language dax) Includes a library of over 200 functions, operators and
constructions. These formulas are very similar to Excel formulas, in fact, it has many of the functions that
integrates Excel.
Forecasting • Allows predictions based on predefined algorithms
Functionality not directly available PowerBI. Still, it could be reached by relying on getting the power tool
gives the DAX expressions. For an example, see the following link:recursive calculations using DAX.
Key Features - Explore & Discover
PowerBI
86
Analytics functionality
Statistical tools
/ data mining
• Integration with external tools to add forecasting functionalities (R, Weka, Python)
In Power BI Desktop, you can run R scripts and import the resulting data sets into a Power BI Desktop
data model. This functionality is in Beta phase. In order to have this functionality, it is necessary to install R
on the local computer
.A more detailed description of the process to follow is shown in the following link: Scripts r power bi. An
example of "Forecasting” with R and Power BI can be seen here: powerbi-r.
Data Discovery • Interactivity between graphics and other components. As the user selects certain parts of
DashboardThe graphics will be updated as appropriate
The visualizations that we develop within the same page of the report, will be all connected to each other.
Which means that, if we select one or several values ​​in a visualization, other visualizations will change
depending on that selection. The two modes that you have to interact with the visualizations in Power BI
are:
• Filters: Remove all data except those where you want to focus. Here, we have 3 possibilities.
• Page filter: Applies to all page views Report
• Visual filter: Applies to a single view of one page of the report
• Report Filter: Applies to all pages of the report
• Highlighted: This interaction does not filter, but highlights a subset of data visible; unhighlighted
data remain visible but attenuated.
Links: filters and highlighted, incorporating filters in reports
Key Features - Explore & Discover
PowerBI
87
Analytics functionality
Maps
integration
• Possibility to display data on maps in a simple way. The maps can be integrated via: country, City, zip
code, latitude & longitude
• Interactivity map. Possibility of clicking on the locations shown on the map and modify the content of
these other components within the Dashboard/Panel
• Choropleth maps. Possibility of certain color intensities based on the underlying securities.
Power BI integrates with Bing to provide the coordinates of predetermined maps and facilitate the creation
of maps. Bing uses some algorithms and suggestions to try to obtain the correct location, although it is an
approximate calculation. To increase it is important to use the suggestions proposed in the documentation
(see suggestions). In the data view, Power BI allows you to categorize a column to: address, city,
continent, country or region, county, latitude, longitude, place, postal code or, state or province.
The default maps are interactive, and act as a filter / highlight on the rest of the visualizations. Finally,
there is the possibility of displaying coroplast maps (see coroplast maps)
Key Features - Explore & Discover
PowerBI
88
Multi platform
Mobile
platforms
• Availability in different mobile platforms: Android, iOS, Windows Phone
• Mobile version of the tool provides the user with features sharing / collaboration with other users
With Tableau Mobile, users can stay connected to data from anywhere and anytime. Currently,Power BI
has native applications for iPhone, iPad, Android and Windows 10 devices.
On mobile platforms, you will be able to see and interact with reports and dashboards and reports will be
shared assets and panels with other users.
Key Features - Explore & Discover
PowerBI
89
social skills and collaborative
Alerts and
notifications
• Ability to receive alerts or notifications. You are notified, for example, when a threshold is exceeded
preconfigured.
This functionality, today is not implemented in the service that Power BI offers in the cloud. However, it is
possible to use this functionality via Mobile app. Specifically, this functionality is only available for iPhone
devices. From this, we can configure alerts. The alert can be configured to receive notification when a
value exceeds a certain upper, lower or both thresholds.
To export • Export Graphics /dashboard PDF, PNG
• Export values ​​to CSV, XLS / XLSX
• Share dashboard with other users without access to these data sources. The data will be packaged /
included within the dashboard itself
• The tool allows you to export the data sources so that they can be loaded later
It is posible to export the underlying information displays to files csv. The number of rows that can be
downloaded is limited to 10000. In addition, the views can also be exported to pdf. the tool does not
currently allow the export of data sources.
Key Features - Share & Collaborate
PowerBI
90
Security & Administration
Security • Permissions at the level of Report / Dashboard
• Data level permissions
• Application of Statistical Secrecy (LOPD). Hiding sensitive information
• Integration with third-party authentication services (CAS, LDAP, AD, etc.)
• The information is always shown based on the roles to which the users belong, limiting the information
to be displayed when
Under Power BI, there is a complex authentication layer, which, based on local Active Directory servers,
allows users to log in (more information on powerbi security). The level of reports and dashboards security
is achieved through collaboration groups. In these, the administrator can define which users should be.
Data level security can be obtained through rules that can be defined through DAX expressions and user
roles. In this way, different users can view different contents.
In Power BI, when a group is created (only available in the Power BI Pro version), we have the possibility
of generating two types of roles: Administrators and Members. The latter, by default, can edit the contents.
This configuration can be changed so that users under the Member role can only view the contents (see
groups).
Key Features - Administration
PowerBI
91
Security & Administration
Security • Security integration via JDBC
• Integration Application Servers
In the point Access & Data Connection> Integration> Custom Portal, we have already seen that you
can "embed" views in custom portals (see integrate-a-power-bi-tile-or-report). However, it should be noted
that, despite being able to embed visualizations within an application within an application server, it would
not be possible to deploy Power BI on any of them, because it is a solution in the cloud.
Both in the case of integration with SSO applications, and with security via JDBC, Power BI would not be
possible. Keep in mind, that Power BI is a service hosted entirely in the cloud, so you do not have as
many possibilities of configuration compared to a service that could be integrated into the servers of the
companies
Roles user /
group
• Possibility of establishing roles for Users / Groups
A Power BI administrator can create groups and assign users to them. It is important to emphasize that
Power BI supports the creation of groups only under the Pro version of your product. Regarding the roles,
as has already been mentioned in the Security section, there can be two: Administrators and Members,
who can edit content by default, but Power BI allows modifying this behavior.
Key Features - Administration
PowerBI
92
Installation & Implementation
Citrix • Possibility of development on servers virtualized (Citrix MetaFrame, XenApp)
Installation in a virtual environment such as Citrix, is identical to the installation in a normal environment.
We would install the tool and then any user would have access to the desktop version of the tool.
Volumetry • Ability to work with large data volumes
When we use Power BI, the tool creates a local cache with the data it uses. Therefore, this cache is
subject to certain limits. Specifically, because that information is stored in memory, we will be limited by the
amount of memory we have in the machine and, for the amount of data that can be compressed, so, a
knowledge of how Power BI compresses the data , could lead us to work with more data. These limits
apply to both the desktop version and the cloud version. There is a limit of 250 MB for each data set that is
imported in Power BI (see data-model limit and dataset limit). It is necessary to take into account here the
limits imposed by the license that is being used: 1 GB for free users and 10 GB for PRO users (see data-
capacity). There are also certain limitations if the service will be used via API REST: API REST limits.
Key Features - Administration
Tool Review
PowerBI
93
Tool Review
PowerBI
94
Section PowerBI
Access 36.0
Connect to Data 46.8
Transformation / Data Modeling 46.0
Integration 34.5
Analytics functionality 59.3
Creation dashboards 36.9
Reports 24.0
Views 64.0
Multi platform 36.0
Scenario analysis 0.0
Social skills and collaborative 32.5
Important contents 27.0
Security & Administration 20.7
Installation & Implementation 33.3
Pricing 72.0
Multilanguage 32.0
Total 601.0
95
Information Builders
Introduction
96
Information Builders
Introduction
Information Builders
Its motto is based on three competencies are: Intelligence Integration and
Integrity, which are built on a common architecture.
For each of these competencies, WebFOCUS offers a fairly broad set of
products to meet all the needs that an organization can have on their
business.
97
Information Builders
Intelligence. Product overview
XBRL Financial Reporting Exchange
rstat
Development Studio
Application Studio
Enable for Adobe Flex
InfoAssist
visual Discovery
Quick Data
Pro Server
ReportCaster
Hyperstage
Performance Management
Framework
Portal
Mobile Favorites
Maintain
Administration
Active Technologies
Workload Distribution Facility
98
Information Builders
Integration. Product overview
iWay Service Manager
iWay Parallel Service Manager
iWay Universal Adapter Suite
iWay DataMigrator
iWay Activity Monitor (BAM)
iWay Event Manager
iWay Trading Partner Manager
iWay Business Service Provider
iWay Enterprise Index
iWay Managed File Transfer (MFT)
iWay Cloud Services for Amazon EC2
99
Information Builders
Integrity. Product overview
Information Builders
iWay Data Quality Center
iWay Data Steward Portal
iWay Master Data Center
iWay Data Profiler
iWay EIM Server
iWay Enterprise Master Patient Index
Information Builders
100
Architecture
Information Builders
101
Information Builders
Functional architecture
Information Builders
102
Information Builders
Architecture of Components
Information Builders
103
Information Builders
Technical Review
Information Builders
104
Information Builders
Technical Review
It offers a platform of solid development complete and integrated that allows
the access to the information to any type of level inside the organisations
(executive, analytical and operational)
Highly scalable and portable since it works in around 35 platforms. It
integrates with the infrastructures of existent Internet.
Content of WebFOCUS entregable by means of solutions of portal like
mySAP, Plumtree, IBM WebSphere, Microsoft Sharepoint, jBoss, TIBCO,
SunOne, etc.
It offers one of the main lists of connectors of data.
The native architecture of WebFOCUS, oriented to services (SOA), offers
protection in diverse levels: roles, applications and data. It is possible also,
make the integration with the infrastructure of existent security
Servers multihilo, that allows that multiple users can access to the same
information without overburdening the servers.
Information Builders
105
Information Builders
User Features
Information Builders
106
Information Builders
User Fatures
Reports that support high levels of parameterization and numerous output
formats: Excel, PivotTable, PDF, HTML, XML, PowerPoint, etc.
Storage, recovery and agile distribution of information via email, web
browser, mobile devices, faxes and printers.
It allows the delivery of information in any format to any mobile device and
also allows offline analysis.
Ease of design and management of workflows, being able to detect and
monitor practically any technology event.
Information Builders
107
Information Builders
Key Features
Information Builders
108
Information Builders
109
Key Features - Access & Connection to Data
Connect to Data
Archive • Possibility to configure like origin of data archives. For example: Excel, CSV, XML, Text.
Among the available possibilities are: flat files, Excel, XML and CSV (see
http://www.informationbuilders.com/products/webfocus/data_access).
Databases • Connection to databases. For example: Oracle, SQL Server, MySQL, PostgreSQL, Teradata, IBM DB2,
etc.
It has a wide listing of possibilities. Among the most stood out are: Access, Informix, MySQL, Oracle,
PosgreSQL, Microsoft SQL Server, Teradata, etc.
To see the complete list of origins of databases endured:
http://www.informationbuilders.com/products/webfocus/data_access.
Files SAS • Reading of files SAS7BDAT of SAS
It exists the possibility to connect to SAS with the connector ODBC of SAS.
Information Builders
110
Key Features - Access & Connection to Data
Connect to Data
Cloud / Big
Dates
• Possibility of connecting with Big Data or Cloud environments, such as Hadoop, Spark, Microsoft
Azure, etc.
In the field of Cloud / Big Data, Information Builders - WebFOCUS, through the adapters, gives the
possibility of connection to environments such as Hive, Hortonworks, MongoDB, Clodera Impala,
Cassandra, etc. (see information-builders-adapters).
Additionally, the launch of iWay Hadoop Manager, a solution created for the management
and integration of data based on Hadoop (see iway-hadoop-data-manager), has recently been
announced.
Cubes OLAP • Connection to cubes OLAP
Among the available connectors, Information Builders has possibility of connection to cubes OLAP eat:
Microsoft OLAP Services or SQL Server Analysis Services.
Other Services • In addition to the aforementioned data sources, the possibility of connecting to other environments
such as: web pages, social networks, code repositories, CRMs (Salesforce, Microsoft Dynamics, etc.),
Google Analytics
• Access to ERP data such as: SAP, SAP BW, Siebel or PeopleSoft. In addition, it also allows the
management of XML Web services as data sources. It also allows connection to CRM, FTP, etc. (see
https://www.youtube.com/watch?v=_I9iNSgKMKM
Information Builders
111
Key Features - Access & Connection to Data
Connect to Data
Off-line way • Availability to have data in memory for agility in response time
• Possibility to consult data without connection
Within the Information Builders environment, we have the analytical capability known as Active
Technologies, which allows the combination of data and controls within an HTML file, so that valuable
information can be delivered in a portable way, without connection or offline. This analytical capability is
known as In-Documents Analytics. These analytical capabilities can be achieved either through the
Application Studio or the InfoAssist (see active-technologies).
With regard to the fact to be able to have of data in memory to speed up time of response, WebFOCUS
has Hyperstage, a solution of hybrid storage among disk and memory, that allows to improve the times of
response (information-builders-webfocus-hyperstage).
WebFOCUS Mobile, gives the possibility also to work with analysis portables so much on-line like off-line
(see mobile and WebFOCUS-InfoAssist).
Information Builders
112
Key Features - Access & Connection to Data
Transformation/Modelación Data
Interface of
development
• The development and modeling will be simple and, will not require the end user of advanced
programming knowledge. It will also provide an interface for its development, either via the web or,
through a desktop application
Either through the Application Studio or the InfoAssist, elements can be dragged / dropped between
columns. As in other products, it presents a zone from which you can specify the way in which the tables
are related, create calculated fields, change the type of graphic, etc. However, unlike other tools of the
competition, the interface is not so attractive (see http://www.pcmag.com/article2/0,2817,2495566,00.asp).
Combination of
different origins
of data
• Combination of different data sources.
Thanks to the connectors provided by iWay, we have a native access to multiple data sources, which will
generate data that we can later combine.
Information Builders
113
Key Features - Access & Connection to Data
Integration
Personalised
portal
• Possibility of integration in an external portal (Liferay, Sharepoint, etc)
WebFOCUS, has of Open Portal Services, that allows the delivery of information and processes inside the
companies through an only portal Web. WebFOCUS Open Portal Services, endures the integration with
some of the main portals eat: SharePoint, IBM WebSphere and SAP. (See
https://www.informationbuilders.com/new/newsletter/10-5/01_rodriguez)
Information Builders
114
Visualisations
Tendencies/
References
• Possibility to visualize or generate trend lines in a simple way, allowing the configuration of these
(average, linear, etc.) and, reference lines (markers), with different customization options.
Both trend lines and reference lines can be added with both InfoAssist and Application Studio. In the case
of reference lines, they can be used in a visualization, through the Series tab of the control panel. In
addition, it will be possible to select between different types of reference lines: linear, polynomial,
logarithmic, exponential, etc.
As for the reference lines, they can be found in the Format tab of the control panel (see trend-reference-
lines).
Charts • Possibility to give format/configure the charts
• Types of advanced charts: bubbles, maps of heat, gantt, waterfall, funnel, etc.
Through the products InfoAssist or Application Studio, endows to the user of a wide variety of charts
that will be able to use in his visualisations. Among the charts that will be able to use , find : charts of bars,
of sectors, histograms, maps, etc.
Possibility also, to include charts of third, as for example D3 graphics.
Key Features - Explores & Discovers
Information Builders
115
Analytical functionality
Formulas • Possibility of incorporating new variables from custom calculations / formulas
• Existence of predefined functions. Functions for the calculation of% growth, trends, inclusion of
financial functions, temporary functions, etc.
With InfoAssist or Application Studio we have the possibility to create fields or calculated formulas. In
addition, it has a wide collection of functions to manage: characters, dates, numbers, system functions,
input / output functions, etc. (see http://datacenter.ucr.edu/focususing.pdf).
Forecasting IIt allows making predictions based on predefined algorithms
For this purpose, Information Builders has the product WebFOCUS RStat that, leaning on the bookshop
R, allows the creation of statistical models.
In addition to this product, has other solutions: Marketing Mix Modelling, oriented to activities of
prediction on data of marketing, Optimisation of Prices and Planning of Sales and Operations. All of
them, allow to simulate different stages, being able to see like this, how react some variables in base to
some modifications on the variables that can occur (see
http://www.informationbuilders.es/solutions/predictive-analytics).
Key Features - Explores & Discovers
Information Builders
116
Analytical functionality
Statistical
tools/dates
mining
Integration with external tools that allow to add predictive functionalities (R, Weka, Python)
As previously mentioned, with the WebFOCUS RStat product, there is a graphical interface that is
supported by the R library. Through this tool, you can explore the data, create visualizations, build
statistical models, etc.
It dates
Discovery
• Interactivity between the graphics and the rest of the components. As the user selects certain parts of
the Dashboard, the graphics will be updated as appropriate
The possibility of performing Data Discovery in a simple way has been included in the latest versions of
the tool. Specifically, in InfoAssist Plus, there are integrated technologies that will allow the user to analyze
and navigate the data (see webfocus-date-discovery).
Key Features - Explores & Discovers
Information Builders
117
Analytical functionality
Integration with
Maps
• Possibility of showing data in maps in a simple way.
• The maps can be integrated through: country, city, postal code, latitude & longitude
• Interactivity of the map. Possibility of clicking on the locations shown on the map and that these modify
the content of other components within the Dashboard / Panel
• Heat maps. Possibility of establishing certain color intensities based on the underlying values.
Information Builders and ESRI - one of the leading developers of geographic information systems - have
created a solution to analyze geospatial information (see
http://www.informationbuilders.com/solutions/ESRI).
There is also, through the WebFOCUS add-on for Google Maps, the possibility of mapping geographic
information on Google Maps (see http://www.informationbuilders.com/new/newsletter/9-2/04_lotrowski).
Both points are included within the InfoAssist and Application Studio products
Key Features - Explores & Discovers
Information Builders
118
Multiplataforma
Mobile
platforms
• Availability in the different mobile platforms: Android, iOS, Windows Phone
The mobile version of the tool, provides the user with sharing / collaboration features with other users
The Information Builders BI platform, WebFOCUS offers dashboards, reports, maps and other
visualizations on all mobile platforms, including iOS, Android and BlackBerry, without specific coding
devices. This is possible, thanks to the WebFOCUS Mobile product. This will provide solutions based on
HTML5, adaptable to the different screen sizes of the devices, with possibilities to save, classify or
subscribe, etc. (see http://www.informationbuilders.com/products/webfocus/mobile).
Key Features - Explores & Discovers
Information Builders
119
Social capacities and of collaboration
Alerts and
notifications
Possibility of receiving alerts or notifications. It must be reported, for example, when a pre-configured
threshold has been exceeded.
It allows the generation of automatic alerts, in real time, based on certain events or, when certain business
rules are met. To achieve this, we can, based on WebFOCUS ReportCaster, based on certain alerts or
defined notifications, distribute the information related to the event to the appropriate people.
Another way to be aware of possible errors or alerts is through the Business Activity Monitoring, which
monitors in real time the business activities (see
http://www.informationbuilders.com/products/webfocus/real_time and
http://www.informationbuilders.com/products/webfocus/operational_dashboard).
Key Features - Share & Collaborate
Information Builders
120
Social capacities and of collaboration
Export • Export charts/dashboard PDF, PNG
• Export values to CSV, XLS/XLSX
• Share dashboard with other users without need that these have access to the origins of data. The data
will be packed/included inside the own Dashboard
• The tool allows to export the data sources, so that these can be uploaded later
The WebFOCUS platform BI , allows to hand the information in a wide variety of formats: HTML, Excel,
PDF or PowerPoint.
Planificador
Distribution
• Delivery of reports/dashboards via mail
WebFOCUS ReportCaster, allows to carry out the relevant procedures for the distribution of information.
This product allows the programming of this distribution or the format in which it will be sent, including:
HTML, Excel, PDF, etc. In addition, this distribution can be done safely, thanks to the possibility of
encryption, compression of said information
(See http://www.informationbuilders.com/products/webfocus/delivery_manage).
Key Features - Share & Collaborate
Information Builders
121
Security & Administration
Security • Permissions at the level of Report / Dashboard
• Data level permissions
• Application of Statistical Secrecy (LOPD). Hiding sensitive information
• Security integration via JDBC Integration in application servers
• Integration with third-party authentication services (CAS, LDAP, AD, etc.)
• The information is always shown based on the roles to which the users belong, limiting the information
to be displayed when appropriate.ermissions to level of Report/Dashboard
Security within the Information Builders environment is given at different levels: application-based
security, data-level security, so that users only see what they are authorized to do, and external security,
which refers to security systems. external authentication such as LDAP, ADS or Entrust (see
http://www.informationbuilders.com/products/webfocus/security). Information Builders WebFOCUS can be
fully integrated into application servers, through WebFOCUS Open Portal Services, also providing
customization possibilities and supporting the integration also at the security level, so that users within the
application server can be authorized to receive information (see
http://www.informationbuilders.com/products/webfocus/wf_ibm). Regarding the issue of application of
statistical secrecy, it can be achieved through procedures and data restriction rules (see encrypt) and
through the WebFOCUS Resource Analyzer module
Key Features - Administration
Information Builders
122
Security & Administration
Roles of
user/group
• Possibility to setup roles for users/groups
As already mentioned in the Security section, one of the levels on which security can be applied is the
level of Application Access, where administrators, within WebFOCUS Portal can manage and define
accesses based on user groups, departments or roles.
Key Features - Administration
Information Builders
123
Installation & Implementation
Citrix • Possibility of development in virtualized servers (Citrix MetaFrame, XenApp)
WebFOCUS Developer Studio can be integrated into virtualized environments. For this they have to be
configured with the appropriate hardware and operating system.
Volumetry • Working capacity with large data volumes
We have already seen in some previous point the possibilities offered by WebFOCUS when working with
Big Data technologies. Currently, the huge volumes of data that can be handled today are not a problem,
since they can be treated with technologies such as Hadoop or the Hortonworks data platform. Once
these data have been processed, they can be viewed through the tools provided by WebFOCUS. (See
Information-Builders-Hortonworks-Solution-Brief).
It should also be noted, within the WebFOCUS environment, the WebFOCUS Hyperstage tool. It is an
integrated data warehouse that dramatically improves the performance of the BI environment. For this, it is
based on an internal structuring of the columnar database, making that, for databases that have a large
number of columns, of which a few are consulted, with WebFOCUS Hyperstage it is possible to simplify
this operation, improving well the response times. The tool in question, supports up to 50TB with a single
server and, in addition to improvements in performance, will also reduce the use of the disk in large
databases (webfocus-hyperstage).
Key Features - Administration
Information Builders
Tool review
Information Builders
124
Information Builders
Evaluation of the tool
Information Builders
125
Section Information Builders
Access 36,0
Connect to Data 52,8
Transformation/Modelación Data 38,0
Integration 48,0
Analytical functionality 53,6
Creation Dashboards 26,6
Reports 72,0
Visualisations 56,0
Multiplataforma 36,0
Analysis of stages 27,0
Social capacities and of collaboration 41,5
Important content 27,0
Security & Administration 58,0
Installation & Implementation 46,7
Pricing 24,0
Multilenguaje 36,0
Total 679,2
Information Builders
126
SAS
SAS
Introduction
127
SAS
Introduction
SAS
SAS Institute is the world's largest private equity software company, leader in
Business Analytics. It was founded in the United States 40 years ago and has a
presence throughout the world. It has more than 14 thousand employees in the
world that offer support services to the 90 companies of the Fortune Top 100 list,
who are customers of SAS
128
SAS
Introduction
SAS is also a programming language developed by SAS Institute to finals of the
years sixty. The language SAS operates mainly on tables of data (reading,
transformation, combination, creation of reports).
There are procedure modules that expand the capacities of the basic language.
SAS/IML: implements an alternative language to Matlab or R.
SAS/STAT: procedures to make statistical analyses (regressions, etc.)
SAS/ETS: statistical analysis of temporary series
SAS/OR: resolution of problems of operative investigation
SAS/GRAPH: charts creation
129
SAS
Introduction
Within the multiple applications, services and platforms we can distinguish groups of
tools that SAS markets as Products
SAS Enterprise BI Server  Complete suite with development tools: ETL, SAS
code, reporting and analytics
SAS Visual Analytics  Suite integrated of web applications that offers an intuitive
interaction drag & drop. This set of applications are oriented to the analytical
visualisation allow to do reporting and exploration of data. It GOES it uses
technology SAS LASR by what executes in memory.
SAS Enterprise Miner  Tool that streamlines the process of data mining to create
high-precision predictive and descriptive models based on the analysis of large
amounts of data across the company. Use cases: detect fraud, stop the loss of
customers ...
130
SAS
Introduction
PREPARATION OF DATA
• Monitors the Analytical Server
SAS®
LASR™
• Load and joins data
• Creation of columns
calculated
EXPLORER
• Ad hoc analysis
• Data discovery
DESIGNS
• Creates pictures of controls to
be visualised in the web or in
mobiles from the Visual
Analytics Designer
BI MOBILE
• Native application for iOS
and Android that offers the
interactive reports created
in the Visual Analytics
Designer
SAS Visual Analytics
Powerful analytical solution for all types of users: business users with limited technical skills, statistics,
data scientists ..
131
SAS
Introduction
It DATES PREP
ENVIRONMENT
ADMIN
EXPLORER
DESIGNER
REPORTS
FINDER
MOBILE
FINDER
WEB
IT / DATES
MANAGER
HUB
ANALYST
It DATES
PREP
ENVIRONMENT
ADMIN
EXPLORER
DESIGNER
HUB REPORTS
FINDER
MOBILE
FINDER
WEB
USER OF
BUSINESSES
It DATES
PREP
ENVIRONMENT
ADMIN
EXPLORER
DESIGNER
HUB REPORTS
FINDER
MOBILE
FINDER
WEB
Visual Analytics:
For all the roles:
User of Businesses
Analyst
IT/Dates Manager
132
SAS
Introduction
SAS Visual Analytics: Analytical visualization tool in memory, allows reporting and
data exploration. Visual Analytics includes state-of-the-art graphics, mobile support
and a large number of predefined predictive capabilities. Use SAS LASR technology
to run in memory..
SAS BI Dashboard: Web tool that allows users to create dashboards. Easy-to-use
interface and has role-based security.
SAS Dates Integration Studio: ETL Tool with interface of visual development .
SAS Enterprise Guide: Client application to run on Windows environments that
allows a guided way to execute SAS programs and publish the results dynamically
throughout the entire organization
SAS Information Map Studio: Creator of maps of information (areas of metadatos).
The maps of information represent a layer that isolates to the final users of the
complexities of the databases.
133
SAS
Creator of information maps (metadata areas). Information maps represent a layer that isolates end users from the complexities of databases
Introduction
SAS OLAP Server : OLAP Server that manages the access to OLAP cubes of SAS.
These cubes can query using the standard MDX.
SAS OLAP Cube Studio : Graphical tool to create cubes OLAP of SAS. From it can
define aggregations.
SAS Web Report Studio: Web report designer (for example, you can use an OLAP
SAS cube as a source
SAS Information Delivery Portal: Web tool to access a wide variety of information
(reports, stored processes, information maps, web applications, files ..)
SAS Dates Management: Tool oriented to integration processes, quality and data
governance.
SAS Management Console: Tool to administer all the platform (administration of
servers, programming of works, administration of roles and users, repository of
metadata)
134
SAS
Introduction
SAS Enterprise Miner: Tool with a powerful visual interface to perform data mining
tasks. It allows generating advanced models for descriptive and predictive
analytical processes. Includes data preparation and exploration features and
integration with R..
SAS LASR Analytic Server: Multiuser Analytical platform that stores the data in
RAM memory.
SAS Dates Loader for Hadoop: Tool to manage Big Data environments. It allows to
load data in memory in SAS LASR Analytic Server. It allows to copy data to
Hadoop from Oracle, Teradata or a SAS Server and execute SAS and Hadoop SQL
programs from a graphical interface. It includes access, cleaning and profiling
functions of the data.
JMP SAS: Tool for statistical Data Discovery. Visualization tool with extensive
statistical capabilities.
135
SAS
SAS
Introduction
Tools by functionality:
Dashboards, Reporting/Queries and Analysis: Information Delivery Portal, Web
Report Studio, Enterprise Guide, Visual Analytics.
OLAP: OLAP Cube Studio, Web OLAP Viewer
Analytical integrated: Enterprise Guide
Metadata Management : Information Map Studio
Administration and Management: Management Console
ETL: Data Integration Studio
Minería de Datos: Enterprise Miner
Big Data: Data Loader for Hadoop
Data Discovery Estadístico: JMP
136
SAS
SAS
Architecture
137
SAS
Architecture of Visual Analytics
Under Level  Server SAS LASR : Storage in Memory
Half Level  Servers: Metadata ,Workspaces and Visual Analytics Mid-Tier
High Level Clients: Desktop, Web and Mobile
138
SAS
Architecture SAS Enterprise BI
Data Sources: RDBMS, Cubes and set of data SAS, ERP….
Low Level  Application Server : OLAP, Metadatos, Processes Stored...
Half Level  Web Server: Information Delivery Portal, BI Dashboard, Web Report Studio…
High Level  Desktop Clients: Enterprise Guide, GAVE Studio, Information Map Studio…
139
SAS
Architecture SAS Enterprise BI
SAS
Under Level Server of Applications:
OLAP Server
Spaces of work Management Server
Processes Management Server of
Connection to SAS Server
140
SAS
Architecture SAS Enterprise BI
SAS
Half Level  Server Web:
SAS Web Report Studio
SAS Information Delivery Portal
SAS Web OLAP Viewer for Java
SAS BI Dashboard
SAS Web Infrastructure Platform (Login, Preferences, Objects shared,
processes stored…)
141
SAS
Architecture SAS Enterprise BI
SAS
High Level  Clients of Desk:
SAS Enterprise Guide
SAS Enterprise Miner
SAS Dates Integration Studio
SAS Information Map Studio
SAS OLAP Cube Studio
SAS Management Console
SAS Add-in For Office
142
SAS
SAS
Technical Review
143
SAS
Technical Review
SAS Management Console (Documentation): It is the unique and centralized control
place from where resources are managed within SAS:
• Definition of servers and bookshops.
• Definition of users, groups and roles
• Control of access to the different resources
• Metadata Repositories
• Job Programming
144
SAS
Technical Review
SAS
Register external connections in SAS
Tutorial
1. Configure the Compound Server so that it communicate with the source
2. Define a source ODBC
3. Register the server of BBDD
4. Register the bookshop of BBDD
145
SAS
Technical Review
SAS LASR Analytic Server: Analytical platform in RAM memory used in SAS Visual
Analytics with the following characteristic
System of Massive Parallel Process (MPP) and mullti thread
Possibility of deployment distributed with Teradata DW or Greenplum
Reading data from HDFS
146
SAS
Technical Review
SAS Visual Analytics Hub for users Administrators.
From the SAS Visual Analytics Administrator we can manage which elements will be
loaded into memory.
There is also a tab to check mobile connections.
147
SAS
Technical Review
SAS Dates Integration Studio
ETL desktop tool in which develops data integration processes visually. In its latest
version, a component that allows loading tables in SAS LASR Analytic Server has
been added.
148
SAS
Technical Review
SAS Enterprise Guide: Desktop tool that allows analysts and statisticians from a
graphical interface and without the need of programming knowledge in SAS the
following capacities:
Access to data from multiple platforms, operating systems and databases
Create and share stored processes
Share reports and datasets
Perform correlation analysis and build predictive models
Viewing SAS OLAP Cubes
149
SAS
Technical Review
SAS OLAP Cube Studio
Desktop tool designed to create SAS OLAP cubes. From this editor we can create
aggregations, update cubes and add new members calculated in cubes that
will be exploited by other SAS applications (Enterprise Guide, Web OLAP
Viewer ...).
150
SAS
SAS
User Features
151
SAS
User Features
SAS Visual Analytics Hub:
Point of entry to SAS GOES from which can:
Prepare the data
Create Reports
Explore the data
Open a report saved
Open a query saved
Open an exploration saved
152
SAS
User Features
SAS Visual Analytics Hub:
Prepare the data using the Visual Dates Builder
153
SAS
User Features
SAS Visual Analytics Explorer:
Exploration of simple data:
• The variables are interpreted as categories or metric.
• To create a visualisation drag a variable to the central area and select the
type of chart
154
SAS
User Features
Analysis of Stages (video) with SAS Visual Analytics
Procedure
• Deploys the tab of Analysis of Stages.
• For each measure selects the values of future data and updates to see the new
results
155
SAS
SAS
User Feature
Visual Analytics example of Dashboard
156
SAS
User Feature
SAS Web Report Studio: Web tool oriented to business users that allows end
users::
Visualise, create and share reports
Include views of cubes of SAS OLAP
157
SAS
Connects with SAS
SAS
Support for clients
SAS Community
Facebook
Twitter
Linkedin
Google+
Blogs
RSS
SAS
User Features
158
SAS
SAS
Key Features
159
SAS
SAS
160
Key Features - Access & Connection to Data
Connect to Data
Archive • Possibility to configure it as data files source. For example: Excel, CSV, XML, Text.
SAS Enterprise Guide: It allows to read all type of text files . It also allows to integrate Excel files .
SAS Dates Integration Studio: This ETL tool allows us to work with all type of files of text (.txt, .csv, .xml)
And Excel.
Databases • Connections to databases. For example: Oracle, SQL Server, MySQL, PostgreSQL, Teradata, IBM
DB2, etc.
SAS Enterprise Guide: Using the bookshop SAS/ACCESS Interface to ODBC will be able to connect to
all the databases that use this standard. Specific documentation of the bookshop SAS/Access for Oracle.
SAS Dates Integration Studio: In addition to the ODBC connection standard there are pre-configured
libraries to connect to DB2, Sybase, Teradata, Oracle. These connections will be registered in the SAS
metadata server by the administrator that will make them accessible to the rest of the suite's tools.
SAS
SAS
161
Key Features - Access & Connection to Data
Connect to Data
Files SAS • Reading of files SAS7BDAT of SAS
SAS7BDAT means “SAS system dates set” . This extension is the standard format of SAS and all the
applications allow to export and import in this format.
Cloud / Big
Dates
• Possibility to connect with Big Data environments or Cloud, such as Hadoop, Spark, Microsoft Azure,
etc.
SAS Dates Loader for Hadoop: Copies data to Hadoop from Oracle, Teradata or a Server SAS. It
executes SAS programs and Hadoop SQL programs from a graphic interface. Functionalities of access,
cleansing and profiling of the data. It provides secure access to HortonWorks / Cloudera and can
integrate with LDAP or Actuate Directory for the authentication of users..
There are also other ways to connect to Hadoop from SAS for example by means of SAS/ACCESS to
Hadoop that allows to extract data of Hadoop via libname or proc sql connecting with HiveQL.
SAS
SAS
162
Key Features - Access & Connection to Data
Connect to Data
Cubes OLAP • Connection to OLAP cubes
It is evident that there is connectivity from the visualization tools to the SAS own cubes. Also through the
use of SAS / ACCESS to OLE DB libraries we can connect to cubes Microsoft SQL Server Analysis
Services.
Other Services • In addition to the aforementioned data sources, the possibility of connecting to other environments
such as: web pages, social networks, code repositories, CRMs (Salesforce, Microsoft Dynamics, etc.),
Google Analytics
Using the ODBC standard, we can register a connection to Salesforce within the SAS application and data
servers and then use it from SAS Data Integration Studio. SAS Visual Analytics has a functionality to
connect Google Analytics directly.
Off-line way • Availability to have data in memory for agility in time of response
• Possibility to consult data without connection
SAS Visual Analytics it includes the possibility in its mobile version to visualize the offline control panels
using a network anchoring or tethering. SAS LASR Analytic Server is the multiuser analytic platform that
stores the data in RAM that Visual Analytics uses below.
SAS
SAS
163
Key Features - Access & Connection to Data
Transformation/Modelación Data
Interface of
development
• The development and modeling will be simple and, will not require the end user of advanced
programming knowledge. In addition, an interface for its development will be provided, either via the
web or through a desktop application.
.
SAS Visual Analytics: End-user web tool in which technical knowledge is not required. Advanced analytics
have been seamlessly integrated, including decision trees, network diagrams, on-the-fly projection and
scenario analysis with easy-to-use features such as automatic diagram creation and drag-and-drop
capabilities.
SAS BI Dashboard: Web tool for end users that allows to create dashboards including all kinds of existing
elements in SAS: graphics, OLAP views, tables, trend lines.
Combination of
different origins
of data
• Possibility to combine several data sources
SAS Dates Integration Studio:ETL tool that allows to graphically combine and combine information flows
from a wide spectrum of sources (files, database records ...).
SAS Enterprise Guide:Lightweight integration tool with the ability to combine data sources from different
sources but with more limited capabilities than DI Studio.
SAS
SAS
164
Key Features - Access & Connection to Data
Integration
Personalised
portal
• Possibility of integration in an external portal (Liferay, Sharepoint, etc)
Document of integration of elements of SAS BI Dashboard with Sharepoint.
SAS
SAS
165
Visualisations
Charts • Possibility to format/configure the charts
• Types of advanced charts: bubbles, maps of heat, Gantt, waterfall, funnel, etc.
SAS Visual Analytics includes a wide range of available graphics: Bars, lines, tart, Waterfall, Treemap,
funnel, bubbles, dispersion, crossed table, speedometers ... All the components have a section from which
we will configure their format and properties
Tendencies/
Reference
Possibility to visualize or generate trend lines in a simple way, allowing the configuration of these
(average, linear, etc.) and, reference lines (markers), with different customization options
SAS Visual Analytics: allows you to add trend lines by configuring the time axis and the measure that the
line to be displayed will represent. It also allows to create lines of adjustment (Fit Lines) the data of the
following types:
• Linear
• Quadratic
• Cubic
• B-Spline With penalty
To level of code can also generate lines of tendency using SAS GRAPH.
Key Features – Explores & Discovers
SAS
SAS
166
Analytical functionality
Formulas • Possibility of incorporation of new variables from calculations/customized formulas
• Existence of predefined functions. Functions for the calculation of% growth, trends, inclusion of
financial functions, temporary functions, etc.
SAS Visual Analytics includes an expression editor that offers us the opportunity to create new members
based on operations on the source columns. In this editor there are operators: numeric, boolean,
comparison and temporary (date / time).
From the editor of aggregated metrics we will be able to create new indicators using the common
aggregation functions (Average, Maximum, Count, Count Different, Minimum ...). We can also work with
annual accumulation calculations and Period-To-Date calculations.
At the platform level SAS provides the FINANCE function available for use from the different tools of the
suite that performs financial calculations such as depreciation, interest, savings and rates of return.
Forecasting • It allows to make predictions in base to algorithms predefinidos
In SAS Visual Analytics: Exists the possibility to make a chart by means of the right click the functionality
to show the prediction. It is possible to configure the metric that wants that they take part in the generation
of our predictions.
There is also the possibility of carrying out simple decision trees.
Key Features – Explores & Discovers
SAS
SAS
167
Analytical functionality
Statistical
tools/dates
mining
• Integration with external tools that allow to add predectives functionalities (R, Weka, Python)
There are several ways to run Python and R programs within SAS code: SAS IML (Interactive Matrix
Language) Studio allows you to integrate R code through a PROC IML procedure.
Another valid option for R and Python would be to install a Java class (SASJavaExec.jar) and use this java
object in a SAS DATA step, see tutorial.
In SAS Enterprise Miner we could also execute Python code within a SAS program.
It dates
Discovery
• Interactiveness among the charts and the rest of components. To measure that the user selects some
parts of the dashboard, the charts will go updating as it correspond.
There is a solution called SAS Visual Data Discovery that provides high technical knowledge and
advanced visualization capabilities using different platform tools, among which we can highlight JMP to
visualize graphics.
.
Key Features – Explores & Discovers
SAS
SAS
168
Multiplataforma
Mobile
platforms
• Availability in the different mobile platforms: Android, iOS, Windows Phone
• The mobile version of the tool, provides the user with sharing / collaboration features with other users
SAS Mobile BI is the application that from the different mobile platforms (itunes, Google Play) will allow us
to access the business reports and dashboards of SAS Visual Analytics from Apple® iOS and Android
devices. Within the application there is a table of contents view from which the different elements of the
miniature control panel are displayed.
You can include comments at the report level or at the element level (charts, tables) from a section where
comments and alerts are available. The feature of adding comments is very useful to collaborate with
other team members. Within a comment we can attach elements (for example images).
Key Features – Explores & Discovers
SAS
SAS
169
Social capacities and of collaboration
Alerts and
notifications
• Possibility of receiving alerts or notifications. It must be notified, for example, when a previously
configured threshold has been exceeded
SAS Visual Analytics offers us the functionality to create alerts for the different elements of a report and
notify certain users if certain criteria are met. In the configuration of the alert we will specify the column,
the condition, the threshold value, the frequency of the check and the recipients thereof..
Export • Export charts/dashboard PDF, PNG
• Export values to CSV, XLS/XLSX
• Share dashboard with other users without need that these have access to the origins of data. The data
will be packed/included inside the own Dashboard.
• The tool allows to export the data source, so that these can be uploaded later
SAS Visual Analytics allows us export/save the elements of a chart to formats Excel 2007 xlsx, separate
text by tabs tsv or separate text by commas csv.
SAS7BDAT data files are used on the SAS platform, this extension is the standard SAS format and all
applications allow exporting and importing in this format..
Key Features – Share & Collaborate
SAS
SAS
170
Social capacities and of collaboration
Planificador
Distribution
• Delivery of reports/dashboards via mail
SAS Visual Analytics provides a simple wizard for the distribution of reports called New Report Job.
SAS Web Report Studio allows launching queries to generate static reports to users, in addition it allows
us to carry out planning and distribute reports..
If we go down to SAS code level there are also by using complicated macros in which the generated
reports are distributed to a series of recipients.
Key Features – Share & Collaborate
SAS
SAS
171
Security & Administration
Security • Integration security via JDBC
• Integration in servers of applications
• Integration with services of authentication of third (CAS, LDAP, AD, etc)
• Permissions to level of Report/Dashboard and permissions to level of data
• Application of Statistical Secret (LOPD). Concealment of sensitive information.
SAS supports deployment with WebSphere Application Server and WebSphere Application Server
Network. There is a wizard to easily perform the deployment with WebSphere Application Server Network,
for WebSphere Application Server manual configuration steps are needed. SAS allows to use as an
authentication system IBM Tivoli Access Manager, this complete network security and authorization policy
management solution. SAS does not have JDBC connectivity to perform an existing role mapping in an
external tool.
SAS Visual Analytics allows you to control security at the row level from your administration tool. This
document explains how to make this configuration in which we can establish some formulas with the
conditions of access to the data. Before applying this type of security we must ensure that the user or
group exists in the SAS management console (SAS Management Console) SAS Federation Server
provides data access control, auditing and encryption functions. In this document we will see how
encryption techniques are used to hide sensitive data from personally identifiable information.
Key Features – Administration
SAS
SAS
172
Security & Administration
Roles of
user/group
• Possibility to setup roles for users/groups
• Integration with third-party authentication services and the possibility of creating custom authentication
mechanisms (CAS, LDAP, AD, etc.)
From the user management plugin (User Manager) located within the SAS management console (SAS
Management Console) centrally provides the management of user metadata within the platform. When the
user manager registers a new user / group in the system, an entity of type SAS Open Metadata
Architecture is created for this user / group. The function of these entities is the following:
Authorize users or groups to access certain resources or metadata
Allow applications to retrieve the appropriate access credentials for servers and other resources
In this plugin the following definitions will be created Users (User Metadata Identity): At this point users
are created and assigned access to the different servers. Groups (Group Metadata Identity): Groups are
created here and assigned to users. Access (Login Definitions): An access definition contains the access
credentials for a specific account within a specific authentication provider (Windows Local or Network
Account, Microsoft Active Directory account, LDAP account, UNIX oz / OS account) ...)
Key Features – Administration
SAS
SAS
173
Installation & Implementation
Citrix • Possibility of development in virtualized servers (Citrix MetaFrame, XenApp)
All SAS products starting in version 9.2 and above are supported in a virtualized presentation environment
(see official documentation):
• Terminal Services in Windows Server 2003
• Terminal Services for Windows Server 2008
• Remote Desktop Services Windows Server 2008 R2
• Remote Desktop Services Windows Server 2012
• Remote Desktop Services Windows Server 2012 R2
• Citrix Presentation ServerTM 4.0
• Citrix Presentation ServerTM 4.5
• Citrix XenAppTM 5.0 and upper
Volumetry • Capacity of work with high data volumes
SAS Dates Loader for Hadoop: Tool for managing Big Data environments. It allows to load data in memory
in SAS LASR Analytic Server. It allows to copy data to Hadoop from Oracle, Teradata or a SAS Server and
execute SAS and Hadoop SQL programs from a graphic interface. It includes access, cleaning and
profiling functions of the data.
SAS Visual Analytics also uses SAS LASR memory technology.
Key Features – Administration
SAS
SAS
Tool Review
174
SAS
Tool Review
SAS
175
Section SAS
Access 45,0
Connect to Data 64,8
Transformation/Modelación Data 48,0
Integration 58,5
Analytical functionality 60,0
Creation Dashboards 30,0
Reports 48,0
Visualisations 72,0
Multiplataform 36,0
Analysis of stages 27,0
Social capacities and of collaboration 40,5
Important content 18,0
Security & Administration 52,7
Installation & Implementation 47,3
Pricing 24,0
Multilenguaje 32,0
Total 703,8
SAS
176
QlikView
QlikView
Introduction
177
QlikView
Introduction
QlikView
One of QlikView's slogans is that it allows you to discover and visualize data
autonomously (self-service), which allows intuition to go ahead.
QlikView aims to simplify the analysis for all types of users.
• It consolidates information quickly of any data source
• Search for data with ease
• The information is displayed with high quality graphics
178
QlikView
QlikView
QlikView is a platform for Business Discovery. Business Discovery is the term that
gives name to Business intelligence defined by the user, simplifying decision
making. It is the original tool of the company Qlik.
Introduction
179
QlikView
Qlik Sense is a new generation self-service data visualization application that allows
users to easily create a range of interactive visualizations that lead to exploration
and discovery using our intuition.
Introduction
180
QlikView
• Leading platform in the BI and
Business Discovery market.
• Used for the development and
deployment of very powerful and
complex analytical control panels for
exploration & discovery that we call
guided analytics.
• State-of-the-art technology designed
for Visualization and Self-Service that
we call self-service visualization.
• It allows an end user to create flexible
and interactive visualizations using his
intuition.
Introduction
181
QlikView
• Version for installable
standalone Windows of
Qlik Sense.
• Includes all features to
create visualizations and
consume information
• Sharing local files
• Allows you to export
applications to Qlik Sense
Cloud
• Free download, no
application limit or
information sharing
restrictions
• New platform for Qlik
cloud services
• This service allows you to
share visualization
applications created with
QlikView Sense Desktop.
• Interactive search and
information exploration.
• Web tool that supports
access from any type of
device including mobile.
• Full Enterprise Version of
Qlik Sense
• Deployment available in
own servers or private
cloud
• All user capabilities
available in a unified client
• Robust set of available
business features
• Licensing system based
on tokens
182
QlikView
QlikView
• Instructions of Armed
• Interaction with the pieces guided
• Complex results
Box Rasti Rasti Blocks
• Without Instructions
• Each user has high flexibility to
create his own models
Introduction
183
QlikView
• Qlik NPrinting is an application for the creation, distribution and programming of
reports in QlikView (tutorial). Purchased by Qlik to Vizubi in 2015.
• Web and pixel perfect reports that are exported to all Office tools (Word, Excel,
PowerPoint). Drag & Drop elements from QlikView.
• We will be able to add to our reports data, pivot tables, graphics, existing sheets
sheets in QlikView applications.
• Distribution and planning of sending reports (Report Bursting)
Introduction
184
QlikView
Architecture
185
QlikView
QlikView
QlikView Developer
Development tool to create:
1) Data extractions and
transformations
2) Graphical interface layer
(dashboards)
Generates QVW files (.qvw)
Architecture
QlikView Server (QVS)
Access point via web
Analytical engine in memory
Manage the connection between
the server and the Qlikview
client
QlikView Publisher
It has two main functions:
1. Reload the data (.qvw) and
execute the transformations
2. Distribute the documents to
the different existing servers
186
QlikView
Architecture
QlikView
Main components of QlikView: QlikView Desktop (Back End), QlikView Server (Front
End), QlikView Publisher (Back End)
TWe should also mention QlikView Access Point (Front End), a web page hosted on
QlikView Server that shows the documents available to the user connected to the
platform.
187
QlikView
Architecture
QlikView
Back end Architecture
Contains source documents created by QlikView Developer
Typical file types QVW, QVD and LOG
QlikView Publisher is the main component of the back end
Security at the file level is always handled by Windows
188
QlikView
Architecture
QlikView
Front end Architecture
Contains user documents generated and distributed by Publisher
Typical front end file types: QVW, META and SHARED
Main Components QlikView Server and QlikView Web Server or Internet
Information Services
The security of the client and the file system are in charge of the QlikView
Server
189
QlikView
Architecture
QlikView
Cluster Servers
Additional servers can be added to create an Active / Active cluster (2
servers working simultaneously) that allows high availability
Automatically raise different applications in each node to achieve an optimal
memory balance
If one of the servers fails, the other server can respond to the users
guaranteeing the service
QlikView Server Clúster
190
QlikView
Architecture
QlikView
Publishers Cluster
Additional servers can be added to create an Active / Active cluster that
allows high availability of the service.
The tasks of Publisher will be distributed among the nodes according to a
formula we will configure of occupied memory and CPU in use.
QlikView Server Publisher
191
QlikView
Architecture
QlikView
QlikView Escalation
Scale separating QlikView Server and Publisher into 2 different servers
Scale by adding more clustered QlikView Server / Publisher servers
Add extra web servers, using load balancers.
192
QlikView
QlikView
Technical Review
193
QlikView
Technical Review
QlikView
Associative technology in memory
1. Easily consolidates information from multiple data sources
2. Load all information in memory
3. Allows analysis and associative searches in real time
4. Compress the data to 10% of its original size
5. Optimize processor power
194
QlikView
QlikView
Aasociative Technology in memory
• Automatically maintains all associations between all analyzed fields
• Calculate aggregations on the fly as needed
Technical Review
195
QlikView
Technical Review
File Extensions in QlikView
• QVW (QlikView Worksheet): Application file that includes: data, reports, graphs,
scripts, data model and connection strings.
• QVD (QlikView Data): QlikView's patent is used to extract and store the input and
output data; it has a reading speed 100 times higher compared to other sources
due to its optimized storage format. One of the main advantages of using QVD
files is that, once you have a QVD on your disk, the information can be exploited
by more than one QlikView application. This reduces the load on the database and
optimizes resources and development time.
• QVX (QlikView Data Exchange): It is used for data entry from external systems to
QlikView (for example if you are not using ODBC / OLEDB connections). The main
difference with respect to QVD files is that QVX is a public format and can be
created from external interfaces. It can be considered as the format in which the
custom data sources send the QlikView data through the custom connector.
196
QlikView
Technical Review
QlikView
Analyticalcapacity
It depend YOU It depends of the User
of Company
Power and simplicity: IT department independence and high analytical
capacity
197
QlikView
Technical Review
QlikView
ARCHITECTURE BASED ON REPORTS
(Controlled by IT)
ARCHITECTURE BUSINESS DISCOVERY
(Guided by the corporate user, self-service)
New role of the IT department
198
QlikView
Ratios Of IT in implementations of systems BI
QlikView
Query Based QlikView
Disk Space 7- 20 X in DW+Cubes+Inform
0,02-0,1 X in Associative Query
Language
Query Exec.
Time
Variable (Second to Hours) Consistent (Instantaneous)
Project Time 4 to 24 Months 1 to 3 Months
Time for
changes
Weeks/Months Hours/Days
Calculation
T1: Disk to CPU
T2: Selection
T3: Calculation
T4: Visualisation (another tool)
T1= 0
T2= 0
T3: Calculation and Visualisation
optimised
Expertise
Requirements
Experts in ETLs, DW and other
tools of visualisation
1 Expert in QlikView + functional
users
Technical Review
199
QlikView
Technical Feaures
QlikView
Dimensional models in QlikView
Advantages and disadvantages of various types of modeling schemes in relation
to QlikView
200
QlikView
QlikView
User Features
201
QlikView
User Features
QlikView
QlikView is the leader in the Magic Quadrant of Gartner
Two well differentiated segments: Report-oriented BI and Data Discovery
Business Discovery: BI directed by the business user
202
QlikView
User Features
QlikView
Value added in little
time Experience
asociativa
Analysis to the speed of
our thought
Access to business
data from any place
Interactiveness centred
in the user
Business Discovery
QlikView
203
The associative search allows users to manage
Traditional Asociativa
• Linear thinking, pre-defined
• Knowledge lost in hidden data
• Months to implement changes
• Centered on the data
• The user decides where to start
• All the data, always visible
• Minutes to implement changes
• Focused on knowledge
User Features
204
QlikView
User Features
QlikView
QlikView Access Point: It is the web portal to which the end users will connect to see
the available QlikView documents.
205
QlikView
User Features
QlikView In mobile devices : The HTML5 advantages
• Identical QlikView experience on mobile devices
• You will not receive a mobile QlikView report, but a complete and comprehensive
Business Discovery experience.
• Secure system since the data is stored on the server and not on the device
• All supported platforms: Apple, Android, Blackberry
206
QlikView
User Features
QlikView In mobile devices: Optimized for small devices
• Grid Visualisation
• Interactivity with graphics in full screen
• Swipe to switch between different graphics
207
QlikView
User Features
Qlik Market: Find an infinite number of extensions for the products of the Qlik family
grouped by the following categories:
• Best rated
• Recent
• Most downloaded
208
QlikView
Qlik Sense Dashboard Example
QlikView
User Features
209
QlikView
QlikView
Key Features
210
QlikView
QlikView
211
Key Features – Access & Data Connection
Connect to Data
Archive • Possibility to configure lit as data source. For example: Excel, CSV, XML, Text.
QlikView includes a wizard to import files of type: delimited, fixed length, Excel xls and xlsx, html, xml ...
that allows to visualize the content and adjust parameters such as the delimiter or the existence of
headers
Databases • Connections to databases. For example: Oracle, SQL Server, MySQL, PostgreSQL, Teradata, IBM
DB2, etc.
From QlikView and Qlik Sense we can connect through ODBC, OLE DB type connections to all the
databases for which there are these standards of connection to database, in practice they are the majority
(SQL Server, MySQL, Oracle, PostgreSQL, Teradata, IBM DB2, Vertica).
Files SAS • Reading SAS7BDAT of SAS files
Through an ODBC connection we can connect directly to SAS libraries and obtain data.
Cloud / Big
Dates
• Possibility to connect Big Data or Cloud environments, such as Hadoop, Spark, Microsoft Azure, etc.
There are some external JDBC connectors in the Qlik Market, tailored to connect to sources: Hive, Hbase,
Cassandra, Amazon Redshift, Neo4J, MongoDB, HP Vertica, Cloudera Impala, Google Cloud SQL,
FoxPro, etc.
QlikView
QlikView
212
Key Features – Access & Data Connection
Connect to Data
Cubes OLAP • Connection to cubes OLAP
Desta Tool (QlikView) using the standard OLE DB will be able to make surgeries MDX to cubes of
Analysis Services.
Also they exist external connectors like TM1Qonnect that allows us connect us to cubes of Cognos TM1
and import the security and the metadatos.
Other Services • In addition to the origins of data already mentioned, possibility of connection to other surroundings eat:
web pages, Social nets, repositories of code, CRMs (Salesforce, Microsoft Dynamics, etc), Google
Analytics
It exists a native connector to Salesforce designated Qlik for Salesforce.com that provides a transparent
and intuitive access to the objects of Salesforce ( Accounts, personalised fields..) . Regarding Google
Analytics exist connectors and staff of pictures of controls to import directly from the tool and visualise the
statistics of our different portals web.
Off-line way • Availability to have data in memory for agility in time of response
• Possibility to consult data without connection
QlikView allows you to work offline by using qvw files that include data along with documents that can
include dashboards in one or more. There are also qvd and qvx files that allow us to save only data. Qvd
files allow incremental loading and are recommended by the manufacturer
QlikView
QlikView
213
Key Features – Access & Data Connection
Transformation/Data Modeling
Interface of
development
• The development and modeling will be simple and, will not require the end user of advanced
programming knowledge. It will also provide an interface for its development, either via the web or,
through a desktop application
One of the main assets of QlikView is that it allows us to discover and visualize the data autonomously,
which allows our intuition to go ahead. From the desktop development tool we can develop our
dashboards and reports without the need for programming knowledge
Combination of
different origins
of data
• Possibility to combine several data sources.
QlikView automatically connects the data sources using the name of the columns. From the Script Editor
we import any data source and if necessary, aliases will be included so that the column names are
coincident.
• Join sources of different sources
• Join sources of different sources with different columns names
QlikView
QlikView
214
Key Features – Access & Data Connection
Integration
Personalised
portal
• Possibility of integration with an external portal (Liferay, Sharepoint, etc)
There is the possibility to connect and extract data from both Liferay and Sharepoint, but within these
there is no predefined clear integration with QlikView documents.
QlikView
QlikView
215
Visualisations
Tendencies/
Reference
• Possibility to visualize or generate trend lines in a simple way, allowing the configuration of these
(average, linear, etc.) and, reference lines (markers), with different customization options..
QlikView Includes by defect the possibility to add to the original data the following lines of tendency:
• Average
• Linear
• Polynomials of 2º, 3º and 4º degree
• Exponential
It also allows us to visualize the equation of the previous lines and the value of R2 (coefficient of
determination) is the% of variability that is explained by the linear equation that we have. And this goes
from 0 to 1. 1 when the model explains all reality.
Charts • Possibility to give format/configure the charts
• Types of advanced charts : bubbles, maps of heat, Gantt, waterfall, funnel, etc.
We will be able in QlikView and Qlik Sense to easily change the following properties referring to the
graphics: appearance, orientation, colors, titles, arrangement, font type ...
QlikView includes predefined a wide type of graphics (bars, lines, pie, funnel, dispersion, speedometers,
blocks, mekko, radar), selectors and dynamic tables.
Key Features – Explores & Discovers
QlikView
QlikView
216
Analytical functionality
Formulas • Possibility of incorporating new variables from custom calculations / formulas
• Existence of predefined functions. Functions for the calculation of% growth, trends, inclusion of
financial functions, temporary functions, etc. ns, etc.
There is an expression editor within the tool to generate new columns based on existing ones. From this
editor we select the fields to perform the formula and the aggregation function (Sum, Average, Fashion,
Maximum, Minimum, Total Counter, Null Counter ...).
In an extra tab we will find a wide range of predefined functions grouped within the following Categories:
• Aggregation
• Chain
• Date and Hour
• Financial
• Logical
Forecasting • It allows to make predictions based on predefined algorithms
Functionality no available in QlikView
Key Features – Explores & Discovers
QlikView
QlikView
217
Analytical functionality
Statistical
tools/dates
mining
• Integration with external tools that allow to add predictive functionalities (R, Weka, Python)
To run Python from Qlikview it is necessary to add 2 libraries to Python (win32com and Pythoncom). Once
configured these libraries from the Module Editor of the tool using a Visual Basic script we use the function
defined in Python.
ATK R Connector for QlikView is a connector developed by an external company that allows the
incorporation of prediction capabilities thanks to the use of neural networks and econometric models
provided by R libraries.
It dates
Discovery
• Interactivity between the graphics and the rest of the components. As the user selects certain parts of
the dashboard, the graphics will be updated accordingly.
This is one of the strengths of QlikView since associative technology is used in memory so that all
associations between all analyzed fields are automatically maintained. By default, any selection in a
graphic, drop-down or element of our Scorecard will be reflected in all the components of our document
Key Features – Explores & Discovers
QlikView
QlikView
218
Multiplataforma
Mobile
platforms
• Availability in the different mobile platforms: Android, iOS, Windows Phone
• The mobile version of the tool, caters to the user of functionalities of compartición/collaboration with
other users
QlikView
is a multiplatform tool in which we can access the server via web browser. From the server we will access
the Access Point where we will see the different documents that we have available for our user. There is
also QlikView for iOS, this application available in the Apple App Store, complements access to previously
connected QlikView. The application offers a native user experience for the QlikView AccessPoint portal,
while extending and improving QlikView's HTML5 capabilities for analytical applications. With QlikView for
iOS, there is no difference between functionality with or without connection, the user has a true Business
Discovery in both ways.
Qlik Sense s mobile by nature (it is not necessary to download any application) and was created from the
beginning to offer a fully analytical functionality on all devices. There are no differences between the
mobile version and the desktop version. Qlik Sense includes the following key capabilities for mobility
• Mobile analysis without restrictions
• Creation in any place
• User interfac based in gestures
• Responsive Design
• Small devices look and feel
Key Features – Explores & Discovers
QlikView
QlikView
219
Social capacities and of collaboration
Alerts and
notifications
• Possibility of receiving alerts or notifications. It must be reported, for example, when a pre-configured
threshold has been exceeded.
There is an alert editor (Tools> Alerts) that will be executed when opening a document or when reloading
the information and in which we can configure:
• Condition: Expression that has to evaluate to true or dud to shoot the alarm
• Description: Title that describes us the operation of the alarm
• Message: Body of message for the alarm
• Receptors of Post: List of emails receptors of the notice
Export • Export graphics / dashboard PDF, PNG
• Export values ​​to CSV, XLS / XLSX
• Share dashboard with other users without needing them to access the data sources. The data will be
packaged / included within the Dashboard itself.
• The tool allows you to export the data sources, so that they can be loaded later
In a graphic we will be able to send your values ​​to Excel format and its content (data) to QlikView's own
formats (.qvo and .qvd), csv, txt, html and also in image formats (JPG, BMP, PNG and GIF) ). At the level
of the control panel we can export a capture of the same in the previously mentioned image formats and
the design of the document to use it as a template in future work.
In Qlikview the document export format is the .qvw, this will be the extension of our work and it includes
everything (data, reports, graphics, scripts, data model and connections).
Key Features – Share & Collaborate
QlikView
QlikView
220
Social capacities and of collaboration
Planificador
Distribution
• Delivery of reports/dashboards via mail
From the QlikView NPrinting report generation tool it is possible to distribute reports to users using a
wizard in which the following steps are performed:
1. Define a task of report and configure it (name, description, connection, folder allocate..)
2. Select reports
3. Add Addressees of the reports
4. Add Filters
5. Program the task
Key Features – Share & Collaborate
QlikView
QlikView
221
Security & Administration
Security • Integration security via JDBC
• Integration with application servers
• Integration with third authentication services (CAS, LDAP, AD, etc)
QliKView Can not deploy in IBM Websphere and needs any of the following servers web (see requests):
• QlikView Web server
• Microsoft IIS 6, 7, 7.5, 8 or 8.5
QliKView Is NOT compatible with IBM Tivoli Access Manager becuase his security only can be integrated
with (see requests):
• Microsoft Actuate Directory
• Microsoft NTLM
Key Features – Administration
QlikView
QlikView
222
Security & Administration
Security • Permits at the level of Report / Dashboard and data level permissions
In QlikView you can configure a security mechanism in two different ways: It can be embedded in the
QlikView document script, or it can be configured by using QlikView Publisher. To apply security we must
load the IDUSER, PASSWORD, SERIES, NTNAME (user or group name corresponding to a Windows NT
domain), OMIT (Contains a list of unauthorized fields and therefore should be omitted for this specific
user). You can use external authentication services by mapping using the previous fields, for example
using NTNAME as the Active Directory group, NTNAME = DOMAIN  AD_GROUP_1.
• At the sheet level in a document we can allow or restrict the following tasks from Sheet Properties
Security: Add Sheet Objects, Delete Sheet Objects, Copy / Clone Sheet Objects, Access Sheet
Object Properties, Delete Sheet.
• We can also play with the visibility of a sheet in Sheet Properties General there is a Show Sheet
section (Always or Conditional)
Key Features – Administration
QlikView
QlikView
223
Security & Administration
Roles of
user/group
• Possibility of establishing roles for users / groups
• Application of Statistical Secrecy (LOPD). Hiding sensitive information. mation.
To complement the security view information it is recommended to visualize this whitepaper that includes a
view of the architecture at the security level and where the roles / users and the permissions at file level
are managed.
The tool does not directly include functionality to hide sensitive information and apply the statistical
system. There is a possibility that it would be the encryption of those sensitive fields using CryptoJS
cryptographic algorithms.
Key Features – Administration
QlikView
QlikView
224
Installation & Implementation
Citrix • Possibility of development in virtualized servers (Citrix MetaFrame, XenApp)
On PCs with low performance it is possible to connect to external virtualized Citrix servers and develop
(use of QlikView Desktop) on these. Although possible, this option is not recommended for QlikView
Server since it can be managed from the web console remotely.
Key Features – Administration
QlikView
QlikView
225
Installation & Implementation
Volumetry • Capacity of work with high data volumes
QlikView stores the information in memory and uses data compression algorithms based on columns
(reduce to 10% the original 50 GB size would be 5GB). 1 million rows for the treatment column (Mr., Ms.,
Ms.) will take up much less memory than a column in which you save the phone number. To recharge a
QlikView document, the script is executed and it recharges the information in memory. There is a formula
to calculate the necessary memory based on the concurrent users:
RAM = (User RAM × Number of concurrent users) + Initial RAM
Initial RAM = QVW tam. on disk × File size multiplier; Minimum initial RAM for 1 application
User RAM = initial RAM × userRAMratio; RAM consumed by each incremental user
QVW size on disk = Original Data × (1-Ratio of Compression); Size on disk QlikView file
Example: Original data = 50GB, Compression ratio = 90%, File size multiplier = 4, UserRamratio = 5%,
Number of concurrent users = 30.
QVW disk size = 50GB x (1-0.9) = 5GB
Initial RAM = 5 GB x 4 = 20 GB
User RAM = 20GB x 5% = 1GB
RAM = (1GB x 30) +20 GB = 50GB required to have 30 concurrent users and 50 GB of information
Key Features – Administration
QlikView
QlikView
Tool Review
226
QlikView
Tool Review
QlikView
227
Section QlikView
Access 45,0
Connect to Data 58,2
Transformation/Data Modeling 46,0
Integration 34,5
Analytical functionality 49,8
Dashboards Creation 33,4
Reports 48,0
Visualisations 64,0
Multiplataforma 36,0
Analysis of stages 18,0
Social capacities and of collaboration 40,0
Important content 22,5
Security & Administration 32,0
Installation & Implementation 44,7
Pricing 48,0
Multilenguaje 28,0
Total 648,1
QlikView
Amazon QuickSight
228
Index
Introduction
Architecture
Technical Review
User Features
Key Features
Tool Review
Amazon QuickSightAmazon QuickSight
229
Amazon QuickSight
Introduction
Amazon QuickSight
230
Introduction
Amazon QuickSight
Its motto is to provide business intelligence very fast, easy to use and managed
in the cloud for a tenth of the cost of traditional business intelligence solutions.
100% cloud tool under the AWS infrastructure.
It is a tool in private Beta phase so it has not been possible to prove and of
which there is a scarce documentation,
One of his slogans is that we will be able to create our first analysis in 60
seconds.
Amazon QuickSight
231
Amazon QuickSight
Architecture
Amazon QuickSight
232
Architecture
QuickSight Is a web BI tool 100% oriented to final user
Amazon QuickSightAmazon QuickSight
233
Architecture
Tools of recolección of data
Tools of storage
Tools of analysis
Amazon QuickSightAmazon QuickSight
234
Amazon QuickSight
Technical Review
Amazon QuickSight
235
Technical Review
Amazon QuickSight
Upload files or connect to AWS data services
Easily connect Amazon QuickSight to AWS data services, including Amazon Redshift,
Amazon RDS, Amazon Aurora, Amazon EMR, Amazon DynamoDB, Amazon S3 and
Amazon Kinesis; Upload CSV, TSV and spreadsheets files or connect to third-party data
sources, such as Salesforce.
Amazon QuickSight
236
Technical Review
Amazon QuickSight
Performance
Amazon QuickSight uses SPICE – a superfast, parallel, memory-optimized calculation engine
compiled from scratch to generate responses on large datasets.
SPICE: Engine of calculation in parallel memory ultrarrápido
Amazon QuickSight
237
Amazon QuickSight
Memory engine, parallel and super fast ("SPICE")
Created from scratch for the cloud, Amazon QuickSight's memory, parallel, and super-fast
computing engine ("SPICE") uses a combination of memory storage technologies in
columns enabled through the latest hardware innovations, machine code generation and
data compression to allow users to execute interactive queries on large datasets and get
quick responses.
SPICE supports rich calculations that help customers obtain valuable information from their
their analyzes, so they never have to worry about provisioning or managing the
infrastructure.
SPICE automatically replicates the data to provide high availability and, in addition, enables
QuickSight to scale thousands of users who can perform rapid interactive analyzes at a time
on a wide variety of AWS data sources.
Technical Review
Amazon QuickSight
238
Amazon QuickSight
Use BI solutions from AWS partners with Amazon QuickSight
Amazon QuickSight offers partners a simple SQL-like interface to query data stored in
This allows customers to continue to use the existing business intelligence tools of AWS
business intelligence partners and benefit from the faster performance delivered by SPICE.
Technical Review
Amazon QuickSight
239
Amazon QuickSight
User Features
Amazon QuickSight
240
User Features
Amazon QuickSight
Easy to use. Smart graphics are dynamically optimized for data.
Amazon QuickSight automatically derives data types and relationships, and offers
suggestions on the best possible visualizations (optimized for data) to help you get useful
and fast business information.
Visualise in minutesPoint to a data source
Amazon QuickSight
241
Amazon QuickSight
Ease of use. The intelligent charts optimise of dynamic way for the data.
Amazon QuickSight deduces automatically the types of data and the relations, and offers
suggestions on the best possible visualisations (optimised for the data) with the end to help
him to obtain useful business information and fast.
User Features
Amazon QuickSight
242
User Features
Amazon QuickSight
Share and collaborate
Amazon QuickSight allows you to share business information easily by grouping it into
interactive stories that can be shared with others.
With the Amazon QuickSight whiteboard feature, you can combine visualizations on
business panels, add comments and share them securely with a user or with large
groups of users in the organization.
Amazon QuickSight
243
User Features
Amazon QuickSight
Native access in the main mobile platforms
You can access Amazon QuickSight data using native apps for iPad, iPhone, and Android
tablets and phones. You can also control the availability of analyzes, stories, and panels for
offline viewing, as well as create offline annotations, so that they synchronize when the
device reconnects to the Internet.
Amazon QuickSight
244
Amazon QuickSight
Key Features
Amazon QuickSight
245
Amazon QuickSightAmazon QuickSight
246
Connect to Data
Archive • Possibility to configure files as data source. For example: Excel, CSV, XML, Text.
QuickSight allows to read text structured files.
Databases • Connections to databases. For example: SQL Server, MySQL, PostgreSQL, Teradata, IBM DB2, etc.
This tool does not allow you to connect to databases external to Amazon Services
Key Features – Access & Data Connection
Amazon QuickSightAmazon QuickSight
247
Key Features – Access & Data Connection
Transformation/Data Modeling
Interface of
development
• The development and modeling will be simple and, will not require the end user of advanced
programming knowledge. In addition, an interface for its development will be provided, either via the
web or through a desktop application.
Amazon QuickSight automatically infers the data types and relationships in its simple interface of web
development, and offers tips on the best possible displays (optimized for data) in order to help you obtain
information business quick and useful. Smart graphics are optimized for data dynamically.
Combination of
different origins
of data
• Possibility to combine several data sources.
QuickSight allows to combine pertinent data of :
• Archives of text
• Databases
• Amazon Elastic MapReduce
• Amazon Kinesis
• Amazon S3
• Amazon Redshift
• Amazon DynamoDB
Amazon QuickSightAmazon QuickSight
248
Visualisations
Charts • Possibility of formatting / configuring the graphics
• Types of advanced graphics: bubbles, heat maps, Gantt, waterfall, funnel, etc.
One of the most interesting features of Amazon QuickSight is that it suggests the type of graphic we
should choose for our input data.
QuickSight has a reduced set of graphics:
• Bar graphic
• Boards
• Scatter plot
• Lines graphics
• Pie Graphics
• Heat maps
Within the graphics the possibilities of configuration and format are limited. Amazon
QuickSight does not have maps or waterfall or funnel
Key Features – Explores & Discovers
Amazon QuickSightAmazon QuickSight
249
Analytical functionality
It dates
Discovery
• Interactivity between the graphics and the rest of the components. As the user selects certain parts of
the dashboard, the graphics will be updated as appropriate
First steps. Start quickly since you only have to log in, point to a data source and create the first display
in minutes.
Log in to QuickSight and point to a data source or upload a file to start visualizing the data with useful
information in just over a minute.
Key Features – Explores & Discovers
Amazon QuickSightAmazon QuickSight
250
Multiplataforma
Mobile
platforms
• Availability in the different mobile platforms: Android, iOS, Windows Phone
• The mobile version of the tool, provides the user with sharing / collaboration features with other users.
You can access Amazon QuickSight data using native apps for iPad, iPhone, and Android tablets and
phones. You can also control the availability of analyzes, stories, and panels for offline viewing, as well as
create offline annotations, so that they synchronize when the device reconnects to the Internet.
Key Features – Explores & Discovers
Amazon QuickSightAmazon QuickSight
251
Security & Administration
Security • Integration security via JDBC
• Integrationwith application server
QuickSight does not allow the deployment neither integration with any of these tools.
Key Features – Administration
Amazon QuickSightAmazon QuickSight
252
Installation & Implementation
Citrix • Possibility of development in virtualized servers (Citrix MetaFrame, XenApp)
It does not allow working in virtualized servers since it is a 100% cloud tool
Volumetry Working capacity with large data volumes
Through the use of the SPICE parallel, super-fast, memory-based calculation engine, Amazon QuickSight
uses a combination of memory-enabled, columnar storage technologies through the latest hardware
innovations, machine code generation, and data compression to enable Users run interactive queries on
large data sets and get quick responses.
SPICE automatically replicates the data to provide high availability and, in addition, enables QuickSight to
scale thousands of users who can perform rapid interactive analyzes at a time on a wide variety of AWS
data sources.
Key Features – Administration
Amazon QuickSight
Tool Review
Amazon QuickSight
253
Tool Review
Amazon QuickSight
254
Section Amazon QuickSight
Access 54,0
Connect to Data 21,6
Transformation/Data Modeling 32,0
Integration 3,0
Analytical functionality 16,6
Dashboards Creation 17,1
Reports 0,0
Visualizations 48,0
Multiplatform 24,0
Analysis of stages 0,0
Social capacities and of collaboration 23,0
Important content 4,5
Security & Administration 5,3
Installation & Implementation 34,7
Pricing 72,0
Multilenguaje 32,0
Total 387,8
255
Pentaho
Introduction
Pentaho
256
Pentaho
Introduction
BI Suite developed under the philosophy of open source
Developed on Java, it makes Pentaho a very flexible and multiplatform solution.
Within this analytical solution, solutions are available to perform ETLs, reporting,
both interactive and pixel-perfect, OLAP web viewers and other tools.
257
Pentaho
Architecture
Pentaho
258
Pentaho
Architecture
Pentaho
Pentaho is distributed in 3 levels:
Light Clients
Server
Desktop Tools
259
Pentaho
Architecture
Pentaho
In turn, the architecture of Pentaho, consists of several layers
Data layer: used to connect to any data source.
260
Pentaho
Architecture
Pentaho
Server layer: intermediate layer within the architecture, the application
"runs" on the server and acts as an intermediate layer. Here, we have: BA
Server, Pentaho User Console and Pentaho Data Integration Server.
BA Server: Main container where to publish the dashboards and reports
that develop, so that, later are accessible by the users.
Pentaho User Console: It allows us to establish the security level of users
/ roles and defines which content to see in function of the roles to which
belongs.
Pentaho Dates Integration Server: it allows to administer and program
the works ETL.
261
Pentaho
Architecture
Pentaho
Client Layer: based on two main types:
Thin Client: it runs on the server and, among others, we could have
applications for the creation of dashboards with the Community
Dashboard Editor or, tools to exploit the information underlying the
system through the OLAP web viewers.
Thick Client: represents the applications that do not run within the
Pentaho environment but do have full interactivity with it, allowing you to
publish works developed with these applications. Some of these
applications are: Pentaho Data Integration, Pentaho Report Designer or
Schema Workbench.
262
Pentaho
Technical Review
Pentaho
263
Pentaho
Pentaho is an open platform, which incorporates the main tools of the Open
Source market. It has a large development community that allows the
platform to improve and expand constantly.
It is a standards-based Web solution that supports a large set of databases
and is integratable with other tools through Web services.
Technical Review
Pentaho
264
Pentaho
Pentaho offers on its platform a wide variety of connectors to Big Data
sources, as well as components and tools, to perform an effective processing
of data from them.
Technical Review
Pentaho
265
Pentaho
User Features
266
Pentaho
OLAP web viewer
OLAP drag & drop viewer with geographic capabilities. Ability to perform
calculations "on the fly", formula editor and many other new features.Finder
web OLAP
267
Pentaho
User Features
User Features
Interactive Reporting
Web tool that allows the creation of tabular drag & drop reports
It allows to include filters, sections and export to several formats (Excel, PDF,
etc)
268
Pentaho
Dashboards
Possibility of creating attractive dashboards in a few minutes
269
Pentaho
User Features
Scorecards
Tool to manage Scorecards, being able to: edit objectives, indicators, export
results, etc.
270
Pentaho
User Features
User Features
Pentaho Mobile: allows access to the platform from all types of mobile devices
271
Pentaho
User Features
Pentaho Dates Integration: Visual ETL tool that connects to all kinds of bases:
databases (JDBC, ODBC), Big Data sources (Hadoop, NoSQL), OLAP cubes, text
files, ERPs, Google Analytics, Salesforce, Web Services
272
Pentaho
User Features
Pentaho Report Designer: Desktop tool for the creation of pixel-perfect static
reports. It allows us to add filters and export the reports to the usual work
formats.
273
Pentaho
Key Features
Pentaho
274
Pentaho
275
Key Features – Access & Data Connection
Connect to Data
Archive • Possibility to configure files as data source. For example: Excel, CSV, XML, Text.
Through the integration tool included in the Pentaho platform, it is possible to connect to a wide variety of
files (see column with Input value in the link: Pentaho-Data-Integration-Steps). Some of the possibilities
are: csv files, flat text files, JSON files, XML files or Excel files. In addition, certain actions can be specified
on the files to which it is connected, such as: range of rows to read, Excel tabs on which to process the
information or file coding.
There is also a plugin available in PDI and in the BA Server user console (Agile BI) to read csv data
sources and integrate them into the platform.
Databases • Connections to databases. For example: Oracle, SQL Server, MySQL, PostgreSQL, Teradata, IBM
DB2, etc.
As for the connection against databases, we have several tools that can undertake this purpose, among
them: Pentaho Report Designer, BA Server, Pentaho Data Integration, Schema Workbench. The
main databases to which it will be possible to connect are: Oracle, MySQL, PostgreSQL, Teradata, SQL
Server or MS Access..
Pentaho
276
Key Features – Access & Data Connection
Connect to Data
Files SAS • Reading the SAS7BDAT of SAS files
One of the input steps present within Pentaho Data Integration gives the possibility to read sas7bdat files
(see SAS-Input). There are certain limitations when using this step within the tool: all the files that are read
for each copy of the step, must have the same format (same number of columns, with the same names
and types) and, for data of numerical type with NaN values, they will be automatically converted to null.
Cloud / Big
Dates
• Possibility to connect to Big Data or Cloud environments, such as Hadoop, Spark, Microsoft Azure,
etc.
Within the integration tool, Pentaho Data Integration, there is a wide variety of connectors for
communication with Big Data sources. Among the main ones, it has the ability to connect to tools in the
Hadoop environment, such as Cloudera, Hortonworks or Spark, connections to NoSQL databases
such as MongoDB, Hbase or Cassandra. (You can see the complete list of steps that connect with Big
data data sources in Pentaho-Data-Integration-Steps, where the category column has the Big Data value)
Pentaho
277
Key Features – Access & Data Connection
Connect to Data
Cubes OLAP • Connection to OLAP cubes
The connection to OLAP cubes can be done through the integration tool, thanks to the steps Mondrian
Input (see Mondrian-Input) and OLAP Input for cubes of MSAS (see OLAP-Input). From the reporting tool,
Pentaho Report Designer (see use-analysis-cubes-in-report-designer), there will also be the possibility of
creating reports from data coming from OLAP cubes.
Similarly, within the BA Server, the dashboards created in the Dashboard Designer can include data from
views created in the OLAP viewer - Saiku or JPivot. In the case of the Pentaho platform, the OLAP server
used is Mondrian (see mondrian).
Other Services • In addition to the aforementioned data sources, the possibility of connecting to other environments
such as: web pages, social networks, code repositories, CRMs (Salesforce, Microsoft Dynamics, etc.),
Google Analytics
In Pentaho Data Integration there is the possibility of connecting to other data sources that are not so
usual. Within this group, we have steps for the connection with Open ERP (see OpenERP-Object-Delete,
OpenERP-Object-Input and OpenERP-Object-Output), the connection with web analytics services, such
as Google Analytics (Google-Analytics ), tools in the cloud, such as Google Docs, CRMs such as
Salesforce (SalesForce-Input, Salesforce-Delete, Salesforce-Insert, Salesforce-Update and Salesforce-
Upsert) or integration with middleware such as IBM Websphere (IBM-Websphere-MQ- Consumer, IBM-
Websphere-MQ-Producer).
Pentaho
278
Key Features – Access & Data Connection
Connect to Data
Off-line way • Availability of having data in memory for agility in response time
• Possibility to consult data without connectionn
Regarding the possibility of consulting data without connection, within Pentaho, no mechanism is offered
to obtain this purpose. As for having data in memory that speeds up the times, yes. By default, the
Mondrian analysis engine does not include any caching components, but it does include the possibility of
including third-party caching systems.
The Enterprise version, has by default configured the distributed cache of JBoss Infinispan. Other
possibilities would be: Memcached and Pentaho Platform Delegating Cache (see mondrian-cache-
control).
Pentaho
279
Key Features – Access & Data Connection
Transformation/Data Modeling
Interface of
development
• The development and modeling will be simple and, will not require the end user of advanced
programming knowledge. It will also provide an interface for its development, either via the web or,
through a desktop application
In the architecture we saw that the client layer was subdivided into two main types: Thin Client and Thick
Client. In both cases, independently of being an application executed directly on the server or, being a
desktop tool, the development and modeling will require certain knowledge at the data level and, in the
tools more related to the visualization part, it could require certain knowledge in Web programming..
Combination of
different origins
of data
• Combination of different data sources
With Pentaho Data Integration, one of the most powerful ETL tools on the market is available. With this,
we can combine different data sources. To do this, you simply have to use the steps that the tool brings,
for example: we could have a Table Input, which brings information from a database, Oracle for example,
a CSV file Input, that reads records from a file and , later a Merge Join or other union components could
be used to cross the data flows by the common column or columns that had those data sources.
Pentaho
280
Key Features – Access & Data Connection
Integration
Personalised
portal
• Possibility of integration in an external portal (Liferay, Sharepoint, etc)
When we develop visualizations within the BA Server, these allow then to be embedded in other portals,
since they are accessible under a specific URL. So, if you wanted to include Pentaho content, for example
in Liferay, this could be done without problems since, each display responds to a URL. Obviously, it would
be necessary to manage the authentication mode, perhaps through a Single Sign On mechanism, since
in order to be able to visualize said contents, it must first be authenticated within the Pentaho platform.
Pentaho
281
Visualisations
Charts • Possibility of formatting / configuring the graphics
• Types of advanced graphics: bubbles, heat maps, gantt, waterfall, funnel, etc.
In Pentaho Report Designer, we have the possibility to create reports with a high level of detail. Regarding
graphics, different types of graphics can be included, such as bar charts, series charts, areas, sectors,
thermometers, waterfalls, etc. These can be highly customizable, both in appearance and behavior.
Community Dashboard Editor, the tool for the development of dashboards allows us to include a wide
spectrum of graphics, maps and OLAP views on which we can modify numerous options of format and
style (see ccc-charts).
Tendencies/
References
Possibility to visualize or generate trend lines in a simple way, allowing the configuration of these
(average, linear, etc.) and, reference lines (markers), with different customization options.
In the case of Community Dashboard Editor dashboards, it is also possible to show trend lines and it will
also be possible to perform certain configurations on them: select type, color, show underlying area, etc.
Among the types of selectable trend lines are: linear, moving-average or weighted-moving-average(see
types-trend-lines).
Key Features – Explores & Discovers
Pentaho
282
Analytical functionality
Formulas • Possibility of incorporating new variables from custom calculations / formulas
• Existence of predefined functions. Functions for the calculation of% growth, trends, inclusion of
financial functions, temporary functions, etc.
New variables can be incorporated from calculations / formulas in the OLAP viewers present in the
Community version of Pentaho. To do this, the definition of these variables must be specified directly in the
MDX language.
As for the existence of predefined functions, we could extend the functionality of our visualizations and
calculations through the power of the MDX language. As we already know, Pentaho uses OLAP Mondrian
server. He is able to interpret this language, so we could make use of the extensive list of present
functions to create more complex calculations (see documentation-mdx).
Forecasting • It allows to make predictions in base to predefined algorithms
Pentaho Dates Integration includes a plugin from which can make tasks of predictive analysis using the
algorithm of WEKA TimeSeries Forecasting. Also it includes a step designated WEKA Forecasting that
allows us use the .model , with models of minería created by WEKA.
Key Features – Explores & Discovers
Pentaho
283
Analytical functionality
Statistical
tools/dates
mining
• Integration with external tools that allow to add functionalities predicitivas (R, Weka, Python)
Weka is the mining tool that Pentaho integrates into its suite.
A: There is the possibility to run R scripts from a Pentaho Data Integration step
Pentaho recently announced a native integration with Python (see newsletter). (see bulletin).
It dates
Discovery
• Interactivity between the graphics and the rest of the components. As the user selects certain parts of
the Dashboard, the graphics will be updated accordingly
When checking the data through analytical reports through the OLAP viewers within the Pentaho
environment, the visualizations included in them, have a certain degree of interactivity, being able to
change the type of graph, select subsets of data or filter in a simple way.
Community Dashboard Editor allows, down to the level of code, the interaction between graphics,
tables, selectors and other elements that we include in dashboards made.
Key Features – Explores & Discovers
Pentaho
284
Analytical functionality
Integration with
Maps
• Possibility to show data in maps of a simple way. The maps will be able to integrate through: country,
city, postal code, latitude & longitude
• Interactivity of the map. Possibility of clicking on the locations shown on the map and that these modify
the content of other components within the Dashboard / Panel
• Heat maps. Possibility of establishing certain color intensities based on the underlying values.
In the case of the integration of maps, Pentaho is more limited compared to other tools of the competition.
However, Pentaho allows the integration in your dashboards, maps of Google Maps or any map
application. These can be dynamic and interact with the rest of the components of the dashboard
responding to certain events or actions.
To achieve this, it would be necessary to rely on the events that originated within Pentaho, and coordinate
them with the functionality of the selected map application.
Key Features – Explores & Discovers
Pentaho
285
Multiplataforma
Mobile
platforms
• Availability in the different mobile platforms: Android, iOS, Windows Phone
• The mobile version of the tool, provides the user with sharing / collaboration features with other users.
Pentaho does not have official native applications. However, if you have an interface optimized for mobile
devices, Pentaho Mobile, which allows access from all sizes of devices. In addition, as an example,
dashboards designed with Community Dashboard Editor are responsive.
Key Features – Explores & Discovers
Pentaho
286
Possibility of receiving alerts or notifications. It must be reported, for example, when a pre-configured threshold
has been exceeded.
Possibility of
receiving alerts
or notifications.
It must be
reported, for
example, when
a pre-
configured
threshold has
been exceeded.
• Possibility of receiving alerts or notifications. It must be reported, for example, when a pre-configured
threshold has been exceeded.
Pentaho has a large community behind it that makes the platform extend and improve quickly. One of the
tools that helps to promote that this fact is fulfilled, is the Pentaho Marketplace, thanks to which, we can
access a large number of plugins. Well, one of them is the Community Data Validation.
It is a data validator that will periodically make a set of questions about our data and perform certain
actions based on the answers to the questions given. (see
http://www.webdetails.pt/ctools/cdv/#section=notifications).
Key Features – Share & Collaborate
Pentaho
287
Social capacities and of collaboration
Export • Export graphics / dashboard PDF, PNG
• Export values ​​to CSV, XLS / XLSX
• Share dashboard with other users without needing them to access the data sources.
• The data will be packaged / included within the dashboard itself
• The tool allows you to export the data sources, so that they can be loaded later
When we run reports created with Pentaho Reporting from the Pentaho BA Server we will be able to
export the reports in one of the following formats: PDF, HTML, CSV, Excel, RTF and Text.
Also from the Pentaho Interactive Reporting we can export the tabular reports to the usual formats.
In the Community Dashboard Editor there is the possibility to export to Excel the data of the graphics and
also to image format the graphics thanks to the plugin CGG.
Key Features – Share & Collaborate
Pentaho
288
Social capacities and of collaboration
Planificador
Distribution
• Delivery of reports/dashboards via mail
Within the Pentaho BA Server user console, located in the directory browser, if we position ourselves on
Pentaho Reporting reports, we can access the available Schedule page through the File Actions panel.The
steps to make to program the sending of reports are:
• We chose the period of time. Something similar to what we would do with the CRON in Linux or
the task scheduler in Windows.
• It would also be necessary to select the types of files that should be taken into account for
planning. To have the possibility of planning via email, it is necessary that the email server has
been configured and enabled on the platform.
• The planning would already be created
• (See schedule-reports and set-up-an-email-server)
Key Features – Share & Collaborate
Pentaho
289
Security & Administration
Security • Security integration via JDBC
• Integration with third-party authentication services (CAS, LDAP, AD, etc.)
• The information is always shown based on the roles to which the users belong, limiting the information
to be displayed when appropriate.
• Permissions at the level of Report / Dashboard
• Data level permissions
• Application of Statistical Secrecy (LOPD). Hiding sensitive information
• Integration in application servers
The Pentaho security configuration can be done either via the platform or through external providers. In
the first case, security would be achieved through the management of users / roles that Pentaho provides,
allowing for the management of existing roles the permissions that will be available to users under them.
In the case of security via external providers, we have several options: LDAP, Single Sign-On, Microsoft
AD and also via JDBC. The Pentaho security configuration can be done either via the platform or through
external providers. In the first case, security would be achieved through the management of users / roles
that Pentaho provides, allowing for the management of existing roles the permissions that will be available
to users under them. In the case of security via external providers, we have several options: LDAP, Single
Sign-On, Microsoft AD and also via JDBC (see security-for-ba-server and date-access-object).
Based on this basis, it is possible to achieve security at the report / dashboard level without problems.
Data-level permissions can be achieved through layers of metadata between the views and the underlying
data. With these, based on the users / roles that are authenticated, we could limit the data to be displayed
in the views (see dynamic-schema-processor-modify-mondrian-schema-in-run-time, mondrian-
access_control and Multi-Tenancy).
Pentaho can be deployed in the most popular application servers such as: Jboss, Apache Tomcat,
etc.
Key Features – Administration
Pentaho
290
Security & Administration
Roles of
user/group
• Possibility to define roles for users/groups
In the Pentaho platform, through the user console, roles and users can be managed. To do this, the user
administrator, through the administration tab, can create users, roles and assign roles to users. By default,
there are 4 different types of roles: Administrator, Business Analyst Role, Power User Role and
Report Author Role. These, have a series of associated permissions (execution, reading, programming,
etc.) that can be modified if desired, or create new roles with the permissions that are desired (see
pentaho-security).
Key Features – Administration
Pentaho
291
Installation & Implementation
Citrix • Possibility of development on virtualized servers (Citrix MetaFrame, XenApp)
Pentaho products work in virtualized environments when configured with the appropriate hardware and
operating system. We would install the desired tool or tools and we could work with them in the virtual
environment..
Key Features – Administration
Pentaho
292
Installation & Implementation
Volumetry • Working capacity with large data volumes
When dealing with large volumes of data, in Pentaho different approaches can be adopted to try to handle
such a situation. At BA Server level, it is possible to configure a cluster of these so that, in association
with a load balancer, the load is distributed evenly and we can have better response times. At the level of
OLAP analysis, we have already seen in Access & Connection to Data, the different options that are
allowed in Mondrian to optimize the use of the cache.
At the level of data integration, with Pentaho Data Integration you have several options to handle large
volumes of data. With this tool, in addition to having steps that allow you to connect and work with the
main Big Data tools: Hadoop, Spark, Cassandra, MongoDB, etc., at the design level of the solution,
several scenarios are proposed that adapt perfectly to the handling of quantities huge amounts of data.
Within the tool, for this purpose, we can rely on the techniques of clustering and partitioning, which allow
the load or data handling can be distributed through several nodes (performance-and-scalability and pdi-
performance-tuning).
Key Features – Administration
Pentaho
Tool Review
293
Pentaho
Tool Review
294
Section Pentaho
Access 45,0
Connect to Data 51,0
Transformation/ Data Modeling 44,0
Integration 58,5
Analytical functionality 50,8
Dashboards Creation 25,7
Reports 72,0
Visualisations 56,0
Multiplataforma 12,0
Analysis of stages 18,0
Social capacities and of collaboration 31,0
Important content 18,0
Security & Administration 55,3
Installation & Implementation 44,0
Pricing 72,0
Multilenguaje 36,0
Total 689,4
Pentaho
Final Comparison
Analysis Tools BI
295
Final Comparison – final scores
Analysis Tools BI
296
666.4
601.0
679.2
648.1
387.8
703.8 689.4
0.0
100.0
200.0
300.0
400.0
500.0
600.0
700.0
800.0
TABLEAU POWER BI INFORMATION BUILDERS QLIKVIEW AMAZON QUICKSIGHT SAS ANALYTICS PENTAHO
Tableau Power BI Information Builders Qlikview Amazon QuickSight SAS Analytics Pentaho
Analysis Tools BI
297
Final Comparison – Detail final scores
Section Tableau PowerBI
Information
Builders
SAS QlikView
Amazon
QuickSight
Pentaho
Access 36,0 36,0 36,0 45,0 45,0 54,0 45,0
Connect to Data 58,2 46,8 52,8 64,8 58,2 21,6 51,0
Transformation /Data Modeling 50,0 46,0 38,0 48,0 46,0 32,0 44,0
Integration 34,5 34,5 48,0 58,5 34,5 3,0 58,5
Analytical functionality 63,2 59,3 53,6 60,0 49,8 16,6 50,8
Dashboards Creation 36,0 36,9 26,6 30,0 33,4 17,1 25,7
Reports 24,0 24,0 72,0 48,0 48,0 0,0 72,0
Visualisations 72,0 64,0 56,0 72,0 64,0 48,0 56,0
Multiplataforma 36,0 36,0 36,0 36,0 36,0 24,0 12,0
Analysis of stages 18,0 0,0 27,0 27,0 18,0 0,0 18,0
Social capacities and of collaboration 39,5 32,5 41,5 40,5 40,0 23,0 31,0
Important content 27,0 27,0 27,0 18,0 22,5 4,5 18,0
Security & Administration 39,3 20,7 58,0 52,7 32,0 5,3 55,3
Installation & Implementation 52,7 33,3 46,7 47,3 44,7 34,7 44,0
Pricing 48,0 72,0 24,0 24,0 48,0 72,0 72,0
Multilenguaje 32,0 32,0 36,0 32,0 28,0 32,0 36,0
Total 666,4 601,0 679,2 703,8 648,1 387,8 689,4
Analysis Tools BI
298
Final Comparison – Detail final scores
0%
10%
20%
30%
40%
50%
60%
70%
80%
90%
100%
Tableau Power BI Information Builders Qlikview Amazon QuickSight SAS Analytics Pentaho
Acceso Transformación/Modelación Datos Integración Funcionalidad Analítica Creación Dashboards
Informes Visualizaciones Análisis de escenarios Capacidades sociales y de colaboración Contenido Importante
Seguridad & Administración Instalación & Implementación Multilenguaje Pricing
Bigdata.stratebi.com
info@stratebi.com
www.stratebi.com
Information
Phone: + 34 917883410
Madrid: Avenida de Brasil, 17
Barcelona: C/ Valencia, 63
Spain
Contact

Business Intelligence tools comparison

  • 1.
  • 2.
    Document Description 4 Methodologytools evaluation 6 Sections / Category considered 11 Comparison tolos 13 Tableau 14 PowerBI 58 Information Builders 95 SAS 128 QlikView 176 Amazon QuickSight 228 Pentaho 255 Final compasison 295 General index BI Analysis Tools 2
  • 3.
    * For eachof the analyzed tools, you may find the following table of contents Introduction Architecture Technical Review User features Key Features Tool Review BI Analysis Tools 3 Tools Index
  • 4.
  • 5.
    BI Analysis Tools Thedocument presented analyzes and compares 7 of the most powerful Business Intelligence tolos. The tools discussed in the slides are: Tableau, PowerBI, Information Builders, SAS, QlikView, Amazon QuickSight and Pentaho. Document description 5
  • 6.
  • 7.
    BI Analysis Tools Tocarry out the evaluation, we started with an evaluation file, on which 4 main categories have been defined (tabs): Access & Connection to Data, Explore & Discover, Share & Collaborate and Administration These categories, in turn, are broken down into different sections of analysis. For example: In the category Administration, there are the sections: Security & Administration, Installation & Implementation, Multilanguage and For category Explore & Discover, these are the sections: Views, Analytics functionality, Creating Dashboards, Reports, Multi platform Y Scenario analysis. Evaluation methodology tools 7
  • 8.
    BI Analysis Tools Finally,the criteria have been included under the sections. On these, a weight is marked that will mark the importance of the criteria, this will go from 0 to 4, depending on the importance that you want to give to the criterion. The tools will comply more or less with the criteria. For this, it will be necessary to specify a value, which will go from 0 to 3, which will mark the degree to which a tool meets a certain criterion. So the associated result will depend on the importance with which the criterion in question has been marked and, the degree of compliance that the tool has for that criterion. Evaluation methodology tools 8 importance Criteria evaluation Criteria Option Value Option Value 0 - No Important 0 0 - Not Available 0 1 - Good having 1 1 - Minimum 1 2 - Required 2 2 - Suitable 2 3 - Major 3 3 - Excellent 3 4 - Essential 4
  • 9.
    BI Analysis Tools Let'stake as an example the category Access & Connection to Data, where we have the Access section, which is broken down into 2 criteria: Single web access and Independence desktop application. Let us suppose, in turn, that we have marked these criteria as; 4 - Essential and 2 - Necessary respectively. Suppose also that the tool has obtained the following values: 2 - Suitable and 3 - Excellent. With this we would have to: Single web access: 4 - Essential * 2 - Suitable = 4 * 2 = 8 Independence of… : 2 - Required * 3 - Excellent = 2 * 3 = 6 To obtain the total evaluation for the analyzed section, Access in this case, we would average the results obtained in the criteria under this section. Therefore: (8 + 6) / 2 = 7 Finally, the sections also have a weight, which ranges from 1-6. For example, let's say that Access is marked with a weight 5. We would have that: 7 * 5 = 35 Evaluation methodology tools 9
  • 10.
    BI Analysis Tools Forthe final construction of Tool Reviews, there is a section that we called Result, Which corresponds to the screenshot shown in paragraph Tool Review. he Result section contains all the sections of the different categories. On these, as we have seen, a weight (1-6) will be applied, which will define the importance given to the sections. For the calculation, based on the score obtained by the different tools in the different sections (average of the scores associated with the criteria under the sections), they will be multiplied by the weight that has been defined and will give us the final result of the tool for each of the sections Finally, all the values obtained in the different sections and obtain the final evaluation will be added. Evaluation methodology tools 10
  • 11.
    Sections / Categoryconsidered BI Analysis Tools eleven
  • 12.
    12 Section Category Weight AccessAccess & Data Connection 6 Connect to Data Access & Data Connection 6 Transformation / Data Modeling Access & Data Connection 6 Integration Access & Data Connection 6 Analytics functionality Explore & Discover 6 Dashboards creation Explore & Discover 6 Reports Explore & Discover 6 Views Explore & Discover 6 Multiplatform Explore & Discover 4 Scenario analysis Explore & Discover 3 Social skills and collaborative Share & To collaborate 5 Important content Share & To collaborate 3 Security & Administration Administration 6 Installation & Implementation Administration 6 Pricing Administration 6 Multilanguage Administration 4 BI Analysis Tools Sections / Category considered
  • 13.
  • 14.
  • 15.
  • 16.
    Introduction Tableau is aBI tool that is aimed at ordinary users being able to interpret and understand the data. Tableau has several products: Tableau Desktop, Server, Online, Mobile, Public and Reader. All of them integrate / communicate perfectly among themselves, fostering another of the tool's objectives: collaborative work. Tableau 16
  • 17.
    Tableau Desktop Desktop applicationthat allows you to generate visualizations in a simple way. It is designed to adapt to the way of thinking of people. Available for Windows and Mac. Connection to very diverse data sources: relational databases, cloud, big data, etc. It abstracts the user from advanced knowledge of databases or programming. Wide variety of visualizations / graphics available. Integration with simple and powerful maps. All graphics and components have powerful interaction capabilities between them. Possibility to create interactive presentations, called stories within the Tableau environment. Advanced analysis options. Among them, the possibility of including reference lines, prediction functions, creating formulas or calculations through existing data, etc. Tableau 17
  • 18.
    Tableau Server Integrated withTableau Desktop so that, once developed a Dashboard with the desktop version, we publish / share in Tableau Server safely. Available only for Windows servers. Tableau Server allows you to organize information sites, allowing for example, categorize information by department: Human Resources, Marketing, etc. Accessible from browser or mobile device. To interact with the views, for further questions about the data. It presents powerful management capabilities: resource sharing, setting hardware / server memory, defining data sources, security, advanced search solutions, etc. visual interface specification permits users. Tableau 18
  • 19.
    Tableau Online "In thecloud" version of Tableau. Saves hardware costs and installation / configuration times. Accessible from browser or mobile device. Allows you to interact with the views, to ask new questions about the data. Security. Only authorized users will be able to interact with your data and dashboards. Programming of data updates and, alerts in cases where data connections are not established. Subscriptions Possibility of subscribing to jobs, receiving notifications directly in the email. Tableau 19
  • 20.
    Tableau Mobile Tableau mobileversion. Available in App Store (IOS) and google Play (Android). Interactivity and usability adapted to mobile touch devices. Ability to modify the analysis by adding calculations and filters. Tableau twenty
  • 21.
    Products. Tableau Public Freeversion for visualization and interaction with data. Available for Windows and Mac. Connectivity to files / limited databases. Possibility of connecting to files: Excel, Access, Statistical file or text file. It also connects to an OData server. The work is saved only in your Tableau profile. It is not possible to have it on your local hard drive. Products. Tableau Reader Free desktop version. You can open data visualizations created with Tableau Desktop. Available for Windows and Mac. Tableau twenty-one
  • 22.
  • 23.
    Architecture Tableau provides ascalable solution for creating and delivering web, mobile and desktop analysis. It has a client-server, as shown in the figure below, provides services to different customers architecture: web, mobile, tablet and software installed on desktop computers. Tableau 2. 3
  • 24.
    Architecture Tableau architecture consistsof the following layers: data layer, data connectors, Tableau Server components, gateway / load balancer and customers. Tableau 24
  • 25.
    Architecture Data layer: Tableaudoes not require that your data be stored in a single system. This adapts perfectly to organizations, since they usually have a heterogeneous data environment: databases, cubes, Excel files, etc. Tableau provides easy options to manage the data in order to access them quickly, thanks to the in-memory data engine. Data connectors: includes a number of data connectors optimized for databases such as Microsoft Excel, SQL Server, Oracle, Teradata, Vertica, Cloudera, Hadoop and many more. Also, there is a generic ODBC connector for any system without a native connector. Tableau provides two modes of interaction with the data: in real time or in memory. Tableau 25
  • 26.
    Architecture Real-time connection: appropriatefor environments where databases have an effective and optimized performance. Tableau is the front-end for many of the most popular data bases client. In Memory: Tableau offers a fast engine data memory that is optimized for analysis. You can connect your data and then extract your data to gather in memory. Tableau Server components: work Tableau Server is controlled by the following four server processes: Application server: process control application server and exploration permits for web and mobile interfaces Tableau Server. When a user opens a view on a client device, the user starts a session on Tableau Server. This means that an application server process starts and checks the permissions for that user and that view. Tableau 26
  • 27.
    Architecture VizQL Server: theVizQL process is responsible for sending queries directly to the data source and returns a set of results that are displayed as images and presented to the user. Each VizQL Server has its own cache that can be shared among several users. Data Server: allows you to centrally manage and store Tableau data sources. It also maintains the Tableau Desktop metadata, such as calculations, definitions and groups. Background component: this component is in charge of updating the scheduled extracts and administering other tasks in the background. Tableau 27
  • 28.
    Architecture Gateway / loadbalancer: the gateway, routes requests to other components. If several processes are configured for any component, the gateway will act as a load balancer and distribute the requests to the processes. When running in distributed environments, the primary server is designated as a physical machine and the others are designated as worker servers, which can execute any number of other processes. There is always a single machine as the primary server. Tableau 28
  • 29.
    Architecture Clients - webbrowsers and mobile applications: Tableau Server provides interactive control panels to users through HTML and JavaScript (AJAX). In addition, Tableau supports: Web browsers: Explorer, Firefox, Chrome and Safari Mobile devices: mobile safari, Android browser and, applications for iPad and Android. Clients - Tableau Desktop: designated environment for the creation and publication of views, reports and control panels in Tableau Server. You can also publish a complete workbook or, a data source. Tableau Desktop also allows you to open any workbook published in Tableau Server or connect it with any published data source, either an extract or a connection in real time. Tableau 29
  • 30.
  • 31.
    VizQL is avisual language that transforms drag-and-drop actions into data queries and then displays that data in visual form. Technical Review TableauTableau 31
  • 32.
    Live query engineallows people to consult diverse data sources: databases, cubes, warehouses, cloud sources and even Hadoop without advanced programming or development knowledge. Memory data engine is an analysis database in memory, focused on overcoming the limitations of existing data warehouses. This technology uses the entire memory hierarchy of the disk up to the L1 cache. The Tableau Online product is a solution in the cloud, which allows users to share visualizations and data sources, abstracting them from the administration of the hardware. It allows the integration with R, allowing the use of the functions of R, its libraries and even saved models. REST API that will allow developers to manage resources programmatically via HTTP. Funcionalidades Técnicas TableauTableau 32
  • 33.
  • 34.
    User features Data Sources:it is a reusable connection to data. Data Sources published (in real time), contain information connection independent of the workbooks. Data Sources embedded (extract) contains connection information and is associated with a workbook. TableauTableau 3. 4
  • 35.
    User features Workbooks: likeworkbooks in Excel. They contain one or more sheets, which can be: worksheets, dashboard and stories. Let you organize, save and share results. Leaves: where data views to drag and drop fields on the shelves are created. TableauTableau 35
  • 36.
    User features Cards andshelves: cards are containers for shelves, legends and other controls. TableauTableau 36
  • 37.
    User features Dashboard: combinationof several views that can arrange for presentation or to monitor. History: is a sequence of views or dashboards, which are used together to display information. TableauTableau 37
  • 38.
  • 39.
    Key Features -Access & Data Connection TableauTableau 39 Connect to Data Archive • Ability to set file as the source data. For example: Excel, CSV, XML, Text. In Tableau, it allows the connection to Excel files, text files, Access files, statistics files or other files, such as workbooks or data extractions from Tableau. There is also a data interpreter that allows cleaning tasks on the files to which it connects. In addition, if you use the interpreter, it allows you to inspect the changes or incidents that you resolved and how you did it. Possibility of carrying out advanced operations on files: convert information to table, possibility of editing the names of columns, data types, possibility of dividing columns by delimiter, etc. (see data-with-files). Bases de datos • Connections to databases. For example: Oracle, SQL Server, MySQL, PostgreSQL, Teradata, IBM DB2, etc. It includes a good number of connectors for databases. Among the main connectors are: Oracle, Firebird, HP Vertica, Microsoft SQL Server, MySQL, Oracle, PosgtgreSQL or Teradata. Also, it has a generic ODCB connection for any system without a native connector (see connection-db).
  • 40.
    Key Features -Access & Data Connection TableauTableau 40 Connect to Data files SAS • SAS7BDAT reading files SAS Allows seamless connection to SAS (* .sas7bdat), simply: Connect> Archive statistics. It supports a single table per file statistics. Once the file is loaded, you can perform various operations: data display, manipulate metadata fields and rows sort, hide / rename fields, etc. (see statistical-file) Cloud / Big Data • Ability to connect with Big Data environments or Cloud, type Hadoop, Spark, Microsoft Azure, etc. Tableau It is aligned with the most cutting-edge advances in database managers, including the already established databases NoSQL and distributed environments for processing files, as Hadoop or Spark. Tableau It has connectors Spark SQL, Google BigQuery, Cloudera Hadoop, MapR Hadoop Hive, Splunk, DataStax Enterprise, etc. Some success stories where it has been used Tableau Big Data environments are: yellow-pages-Canada, mappy or progressive-insurance.
  • 41.
    Key Features -Access & Data Connection TableauTableau 41 Connect to Data OLAP cubes • Connecting to OLAP cubes As other data sources, you can work with OLAP cubes in offline mode. including calculated members in MDX is allowed. OLAP data sources available are: Oracle Essbase and Microsoft Analysis Services (MSAS). There are certain limitations onTableau when we connect to a cube, such as aggregations calculation functions: SUM, AVG, CNT, can not be overwritten dimensional cell values, can not be grouped measures can not be created hierarchies, etc. However, for these limitations alternative approaches that would lead us to the same result could be taken. (see tableau-OLAP)
  • 42.
    Key Features -Access & Data Connection TableauTableau 42 Connect to Data Other services • In addition to the previous mentioned data sources, possible connection to other environments such as web pages, social networks, code repositories, CRMs (salesforce, Microsoft Dynamics, etc), Google Analytics In Tableau you can also access other sources not as common data such as web pages. To do this, it would be necessary to create a web connector, which will process these data (JSON, XML or HTML). For this purpose, it uses the SDK would, through Javascriptand HTML. also comment that in the community have already created certain Web connectors, eg for JIRA,MapBox, Fitbit, etc. Furthermore, the connection is allowed toCRMs, as salesforce, SAP (SAP Hana, SAP Sysbase ASE, Etc.), analytical sites to sites, such as Google Analyticsservices and other sources. (see connecting-salesforce and connecting-Google-analytics) Offline mode • Availability of having data in memory for agility in response time • Ability to view data offline When we connect to data sources, Tableau can maintain a connection real time or, memory. Since the data engine can access disk storage and RAM and cache, it is not limited by the amount of memory in a system. There is no requirement that the entire data set is loaded into memory to achieve their performance goals
  • 43.
    Key Features -Access & Data Connection TableauTableau 43 Transformation / Modeling Data Interface development • Development and modeling will be simple and will not require the end user advanced programming knowledge. In addition it will provide an interface for development, either via web or through a desktop application The development interface is extremely intuitive and will allow users to create visualizations very simply, simply drag and drop components and make small adjustments. The development of visualizations can be done from the desktop version or from versionServer or On-line. They are not intended to replace the desktop version, but also offer certain capabilities when creating / viewing analysis. Of course, there are also more advanced operations, such as creating expressions / custom formulas or expressions LOD LOD. Here, things are not so trivial. Combination of different data sources • Combination of different data sources Multiple data sources in a few connection can be made to one or "clicks". In addition, these sources may be combined in the displays to be created. Logically, when we combine different data sources, they have to have columns in common (see combination-data-sources-different).
  • 44.
    Key Features -Access & Data Connection TableauTableau 44 Integration Interface development • Customized Portal Tableau allows the embedding of views within web pages, blogs, wiki, intranet portals. These, follow the same conditions as those present in Tableau Server in terms of licensing and restrictions. That is, to see an embedded view, the person accessing the view must have an account in Tableau Server. You can embed the views in two ways: through the share button present in the views, which generates the code that can be copied and pasted into the desired web page or, by entering the custom embed code (see embed-views).
  • 45.
    TableauTableau Four. Five Views Graphics •Ability to format / configure graphics • Advanced charting types: bubbles, heat maps, gantt, waterfall, funnel, etc. The graphics can be created / modified in a very simple way with a few mouse "clicks". The rack marks, gives the user a great potential for personalization to the user, being able to establish colors / shapes for the categories, establish descriptions and labels, etc. Regarding the types of graphics, Tableau Desktop offers a variety of visualizations: areas, lines, bars, map, tree diagrams, etc. In addition, it is possible to build other more advanced graphics (Pareto diagrams, cascade graphics, funnel, etc.), in a non-direct way, as shown in the training videos of your website (Section "How to do it” https://www.tableau.com/es- es/learn/training Trends / References • Possibility to visualize or generate trend lines in a simple way, allowing the configuration of these (average, linear, etc.) and, reference lines (markers), with different customization options As long as you are working with numeric data, Tableau, in its Analysis panel of the worksheets, gives the possibility of showing and configuring trend lines. Among the options that could be configured are the Type of model: linear, logarithmic, exponential or polynomial, and other Options such as: showing the confidence bands, allowing different trend lines by color, etc. In addition, you can export the data from the trend line to Access format. As for the reference lines, they can also be shown, through the Analysis panel. There are several configuration options on the reference lines, select the value to build the line, the label to be displayed, the format of the line, etc. (see trend-lines and lines-reference). Key Features - Explore & Discover
  • 46.
    TableauTableau 46 Funcionalidad Analítica Fórmulas •Possibility of incorporating new variables from custom calculations / formulas • Existence of predefined functions. Functions for the calculation of% growth, trends, inclusion of financial functions, temporary functions, etc. You can create fields calculated from the data present in the analyzes. To do this, just click "right" in the data panel and "Create calculated field". Here, we will have several predefined functions depending on the type of data. For example: ABS, COS, SIN, FLOOR, etc. for Numbers, CONTAINS, LOWER, STARTSWITH, etc. for Chains. In addition to these types of data, there are predefined functions for Dates, Type Conversion, Logic and Sets. Especially interesting are the User functions, which allow us to access the information of the authenticated user, his name, the group to which you belong, etc. and Table Calculation functions: FIRST, MAX, RUNNING_SUM, RANK_DENSE, etc. You can perform calculations in another way, the so-called level of detail expressions LOD (see expressions-LOD). With these, we can calculate the aggregations that are not in the level of detail of the view. For example, we might want to see, the frequency of orders placed by customers or, we might want to calculate, the contribution of each country to global sales (more examples in: LOD-expressions) Key Features - Explore & Discover
  • 47.
    TableauTableau 47 functionality Analytics Forecasting •Allows predictions based on predefined algorithms Forecasting or prognosis, as is currently known within the environment Tableau allows generating, from a statistical model predictions about the data. To make predictions, we need in the analysis, at least one date field, a move to 5 data points. Estimation options can be changed, allowing you to select the date range that will predict, select the dataset to consider in the forecast, or confidence intervals, the prediction model. At this point, we have some restrictions, we can not make predictions about cubes on table views with calculations or measurements or unbundled dimensions (see https://www.tableau.com/es- es/learn/tutorials/on-demand/forecasting). Statistical tools / data mining • Integration with external tools to add functionality predicitivas (R, Weka, Python) In Tableau, you can access the functions and statistical models R. To do this, you need access to a server R to be accessed either from Tableau Desktop or from Tableau Server. There are 4 integrated functionsTableau: SCRIPT_REAL, SCRIPT_STR, SCRIPT_INT, SCRIPT_BOOL. All these models are used to invoke specific features and R and the only difference between them is the kind of result generated. There are some limitations: You can not be exported from Tableau R directly to run new models, if not by the SCRIPT_ functions * They can not be imported visualizations created in R to Tableau can not import data sets R to Tableau. However, it is possible to use R and export data through a supported data source,.csv for example, and then display it in Tableau (see how-integrate-r-and-tableau and using-r-Within-tableau). Key Features - Explore & Discover
  • 48.
    TableauTableau 48 functionality Analytics Data Discovery• Interactivity between graphics and other components. As the user selects certain parts of Dashboard.The graphics will be updated as appropriate Available in Tableau of a Dashboard fully interactive and integrated, it is quite simple. In order to obtain it, we need to use basically 3 elements: • Filters: Cut the data you are viewing. Within these settings, you can specify its scope. If you select Apply to worksheets> All using this data source, we will make any changes on the filter affects all components sharing the data source. (see quick-filters Y additional-filtering-topics) • Parameters: Provide a single result in another element. Useful when the value has been incorporated into another element, such as a filter, a set, or reference line calculated field. We can link multiple views of the same parameter. (see parameters) • Actions: There are 3 types of actions: filter, that filter (when "click"About a country on a map, for example) or shoulder, protruding (when mouse over a country for example). URL actions, including field values ​​as dynamic entries. The latter could be used for example to display the Wikipedia entry for the selected country. (see dashboard-interactivity-using-actions). Key Features - Explore & Discover
  • 49.
    TableauTableau 49 functionality Analytics Maps integration • Possibilityto display data on maps in a simple way. The maps can be integrated via:country, City, zip code, latitude & longitude • Interactivity map. Possibility of clicking on the locations shown on the map and modify the content of these other components within the Dashboard/Panel • Heatmaps. Possibility of certain color intensities based on the underlying securities. Tableau allows the integration of maps into your visualizations. Tableau has an internal database that can recognize the names of common geographical areas, such as country, state, city, etc. If the tool does not automatically recognize a geographical role, it can become at the appropriate level from the context menu. For any geographic column we have in sight,Tableau automatically generated torque: latitude, longitude associated. It may happen, that no correspondence between the geographic role and internal database of Tableau. In these cases, they may be edited unrecognized locations. We can show on maps, brands or different sizes and shapes, we are able also to show maps choropleth. You can add a browser to the map, besides the usual zoom options. several configuration options on maps, like the layers show is also presented: costa, country boundaries, state names, etc. Additionally, you can set background maps from MapBox (see maps-tableau and MapBox-integration). Key Features - Explore & Discover
  • 50.
    TableauTableau fifty Multi platform Mobile platforms • Availabilityin different mobile platforms: Android, iOS, Windows Phone • Mobile version of the tool provides the user with features sharing / collaboration with other users One of the products offered Tableau, is Tableau Mobile, Native applications available iPhone, iPad and devices Android. We may edit or interact with displays from mobile devices intuitively, since the controlsdashboards They adapt automatically to these devices. In the case of iPad Y iPhones, Will be available favorite user views as high-resolution images even when working offline. Ability to subscribe to relevant information from the application. Key Features - Explore & Discover
  • 51.
    TableauTableau 51 capabilities social andcollaborative Alerts and notifications • Ability to receive alerts or notifications. You are notified, for example, when a threshold is exceeded preconfigured. Default, Tableau integrates 3 types of alerts. They shall be notified via mail periodically based on an established configuration. To work properly, you must configure the SMTP server that will useTableau Server to send mails. • Subscriptions views • Mail alerts for system failures • Alerts based on disk utilization, and can configure sending mails when certain thresholds are exceeded pre-configured To receive alerts and notifications based on variables used in displays, Tableau It not included but there is an alternative developed by the community Tableau which provides it with this functionality (see https://community.tableau.com/docs/DOC-7329) Key Features - Share & Collaborate
  • 52.
    TableauTableau 52 capabilities social andcollaborative To export • Export Graphics /dashboard PDF, PNG • Export values ​​to CSV, XLS / XLSX • Share dashboard with other users without access to these data sources. The data will be packaged / included within itselfDashboard • The tool allows you to export the data sources so that they can be loaded later Tableau It offers the ability to download a display shown from Tableau Server or Tableau On-line to subsequently loaded from Tableau Desktopand to modify it. In addition, we also export a display image data (format.txt), Crosstab or PDF. The displayed content can also be shared with other users via mail. In this case, you would be asked to issue user credentials before they can view the content. As already seen in some previous point, the data can be packaged in the workbook. distribution planner • Delivery of reports /dashboards via mail In Tableau, the contents are created from application Desktop to subsequently publish either version Server or in the On-line. Tableaua scheduler has no content itself. However, this functionality could be achieved otherwise. To do this, it would make a small script to take care of this task (see http://kb.tableau.com/articles/knowledgebase/using-tabcmd). Key Features - Share & Collaborate
  • 53.
    TableauTableau 53 Security & Administration Security• Level permissions Report /Dashboard • Data-level permissions • Application of Statistical Secrecy (LOPD). Hiding sensitive information • Integration with third-party authentication services (CAS, LDAP, AD, etc) • The information is always displayed based on the roles to which users belong, limiting the information to be displayed as appropriate In Tableau there are 3 levels of security: access, object and data. Regarding access security,Tableau Server supports 3 types of authentication: microsoft Active Directory, Local authentication administered Tableau Server and reliable authentication creates a relationship of trust between Tableau Server and one or more web servers. As for security purpose, the contents published, as data sources, workbooks and views, can be administered with permits for typical actions view, create, modify and delete. You can create groups to facilitate permission management, such as "marketing users." Finally, data security can be achieved through capacity Table auto have filters which, depending on the user or group, the data displayed is restricted. There is also the possibility of configuring communications between Tableau Desktop and Tableau Server for HTTPS. Key Features - Administration
  • 54.
    TableauTableau 54 Security & Administration Security• Security integration via JDBC • Integration Application Servers On the point Data Access & Wireless> Integration> Custom PortalAs we have seen that they can "imbibe" views on personalized portals (see embed-views), So that integration with common applications servers, could be carried out smoothly. However, it is worth noting that, despite views to embed within an application within all application servers would not be possible to deploy Tableau Server on all servers. This would only be possible toMicrosoft Windows Server 2008 SP2 or later. Tableau accepts impersonation, through which allows a user to act on behalf of another user account. So that you can set Tableau Y Microsoft SQL Server for impersonation user database, so that the account database used by SQL Server Tableau Server conduct inquiries on behalf of users of the database SQL Server, which are also users Tableau (see impersonalization, impers_requirements, impers_how). Roles user / group • Possibility of establishing roles for Users / Groups As already mentioned in the Security section, published content, such as data sources, workbooks and views, can be administered with permits for typical actions view, create, modify and delete. You can create groups to facilitate permission management, such as "marketing users." Key Features - Administration
  • 55.
    TableauTableau 55 Installation & Implementation Citrix• Possibility of development in virtualized servers (Citrix MetaFrame, XenApp) Tableau products work in virtualized environments when they are configured with the appropriate hardware and operating system. We would install the tool and, subsequently, we would need to activate it with the product key volumetry • Ability to work with large data volumes A Tableau extraction (* .tde) is a subset of data that we can use to improve the performance of your workbooks. These extractions are based on columnar models, which means that the data is stored in column sections, which allows maximum compression of the data. An extract from Tableau is not a replacement for the Data Warehouse, so it is important that the underlying servers and databases are powerful. In the following link, some tees made with Tableau Desktop and different datasets can be seen: http://blog.crgroup.com/how-much-data-can-tableau-handle/ Tableau Server Tableau Server can be configured for high availability. For this, it would be necessary to make the configuration to integrate redundancy, which reduces the possibility of inactive time. The four areas that require redundancy are the data engine, repository, and link processes, and the primary Tableau Server. Obviously, this type of configuration requires several nodes. The minimum configuration for high availability is a three-node system (see high-availability). To install Tableau Server in several nodes, you must have a license for multi-machine cores from Tableau Server Key Features - Administration
  • 56.
  • 57.
    Tool Review TableauTableau 57 Section Tableau Access36.0 Connect to Data 58.2 Transformation / Data Modeling 50.0 Integration 34.5 Analytics functionality 63.2 Dashboards Creation 36.0 Reports 24.0 Views 72.0 Multi platform 36.0 Scenario analysis 18.0 Social skills and collaborative 39.5 Important Contents 27.0 Security & Administration 39.3 Installation & Implementation 52.7 Pricing 48.0 Multilanguage 32.0 Total 666.4
  • 58.
  • 59.
  • 60.
    Introduction Power BI transformscorporate data into visual objects, allowing the user to focus on what really matters. It consists of a set of business analysis applications that enable analysis of data and information sharing. PowerBI 60
  • 61.
    Power BI Desktop Easeof creating visualizations. Simply drag and drop the items where desired. Transforms / modeling and data cleaning. Ability to share / publish the information. PowerBI 61
  • 62.
    Power BI Cloud versionof Power BI. Service that reports subsequently be accessed via Power BI Desktop or Mobile will be published. Possible connection to a variety of data sources. Customized content. These include panels, reports and data sets containing a series of displays. Groups Power BI adds collaboration capabilities to make everyone use the correct data. REST API open to enable the integration of apliciones / services. PowerBI 62
  • 63.
    Power BI Mobile Versionadapted to mobile devices. It has native applications on Windows, iOS and Android. Data-driven alerts to keep updated with the most current data. Possibility of sharing reports and dashboards. Annotations can also be performed on the displays for the rest of team members to see. PowerBI 63
  • 64.
    Power BI Gateways Toolthat acts as a bridge between the Power BI service and data sources, taking care of your soda or upgrade. It installs and runs as a service with the Windows account. Only available in the Pro version Power BI versions of Windows 64 bits. Useful to refresh local data sets loaded from: books Excel 2013 or later, or Power BI Desktop files. Different data sources on which settings can be made, depending on the version: Personal or Enterprise. Ability to schedule the frequency with which the data will be refreshed. Data traffic between Power and Power BI BI Gateways service is done safely through Azure Service Bus. PowerBI 64
  • 65.
  • 66.
    Architecture Each implementation ofPower BI consists of two clusters: a front-end web (WFE) And a back-end. PowerBI 66
  • 67.
    Architecture. Front-end WFE managesthe authentication process and initial connection AAD It provides tokens for connections to users He Azure Traffic Manager directs traffic to the nearest data center Power BI uses Network Azure content delivery (CDN) to effectively distribute the necessary static content and files to users depending on the geographic region PowerBI 67
  • 68.
    Architecture. Back-end The back-endcluster reports on how customers interact with authenticated service Power BI. Manages displays, panels, datasets, connections, etc. The role Gateway liaises between user requests and Power BI service. PowerBI 68
  • 69.
    Architecture. Data Storage PowerBI uses two repositories for storing and managing data. The data stored by users, typically target Azure BLOB. An example would be when a user imports an Excel file into a workbook, in this case the data would be stored in memory (for 1 hour approx.) Metadata and artifacts of the system itself are stored in SQL Azure Database. For example, information to be sent to this store will be: dashboards, reports, recent data sources, workspaces, etc. PowerBI 69
  • 70.
  • 71.
    Power BI consistsof a number of components, harmonically integrated. Power Pivot: It is the engine that performs all calculations (in memory), brings together all the data and creates the analytical model that can be exploited later with other tools Power Query: solution for data easily with search functionality, processing and cleaning them Power View: data visualization tool for exploring data simple, intuitive and interactive way Power Map: 3D display to map, explore and interact with the geographic and temporal data. Technical Review PowerBI 71
  • 72.
    Technical Review Cloud: PowerBI is a cloud service that allows users to view and analyze data easily. Allows the execution of scripts R and import the resulting data sets in a data model of Power BI Desktop. DAX: collection of functions, operators and constants that can be used in a formula or expression, thus being capable of creating information from other data already. Queries in Natural language (so far only supported in English). Feature that makes the difference compared to other tools in the market, asks questions of their models and the system is capable of performing filters, systems and clusters that satisfy your question generating new graphics as a result. Power BI can be extended using REST APIs that facilitate the development tools integration with Power BI. PowerBI 72
  • 73.
  • 74.
    User features Data origin:It is the location where the data actually come. For example: Google Analytics, a SQL data or local file, etc. Datasets: It contains information about the data source, the user credentials and, most often, a subset of data copied from this data source. PowerBI 74
  • 75.
    User features Report: composedof one or more page views (graphics and images). A report may be associated with several panels can be created using data from a dataset and that report could be imported into Power BI. PowerBI 75
  • 76.
    User features Panel: Itis a single canvas that contains one or more icons or widgets. Each icon shows a single view created from a dataset and anchored to the panel. A panel displays can display many different data sets and reports. PowerBI 76
  • 77.
  • 78.
    PowerBI 78 Key Features -Access & Data Connection Connect to Data Archive • Ability to set file as the source data. For example: Excel, CSV, XML, Text. Power BI allows obtaining data files Excel, CSV, XML, Text, JSON and even lets you import metadata and links about files in a folder. Databases • Connections to databases. For example: Oracle, SQL Server,MySQL, PostgreSQL, Teradata, IBM DB2, etc. It includes a number of data connectors optimized for databases. Among the main connectors they are: Access, IBM DB2, SQL Server, MySQL, Oracle, PosgtgreSQL Y Teradata Also it has a connecting ODCB generic for any system without a native connector. SAS files • Ability to connect with Big Data environments or Cloud, type Hadoop, Spark, Microsoft Azure, etc. PowerBI integrates some possibilities for communication with Cloud and Big Data environments. Some possibilities in the Cloud section are the possibility of obtaining data Azure HDInsight Spark (Beta) or microsoft Azure Document DB (Beta) version NoSQLMicrosoft oriented documents. SincePower BI also given the opportunity to connect with Apache Hadoop (HDFS) or Spark (Beta).
  • 79.
    PowerBI 79 Key Features -Access & Data Connection Connect to Data Cloud / Big Data • Ability to connect with Big Data environments or Cloud, type Hadoop, Spark, Microsoft Azure, etc. Power BI integrates some possibilities for communication with Cloud and Big Data environments. Some possibilities in the Cloud section are the possibility of obtaining data Azure HDInsight Spark (Beta) or Microsoft Azure Document DB (Beta) NoSQL version oriented to Microsoft documents. Since Power BI also given the opportunity to connect with Apache Hadoop (HDFS) or Spark (Beta). OLAP cubes • Connecting to OLAP cubes With Power BI, we can access SSAS multidimensional models. To do this, from the window of "Get Data", selectDatabase> SQL Database Server Analysis Services. With this type of connection, consumption various elements are supported, including: KPI trends, default members, dimension attributes, hierarchies, etc. There are also some restrictions on the use of multidimensional models. (see https://powerbi.microsoft.com/es-es/documentation/powerbi-desktop-ssas-multidimensional/)
  • 80.
    PowerBI 80 Key Features -Access & Data Connection Connect to Data Other services • In addition to the afore mentioned data sources, possible connection to other environments such as web pages, social networks, code repositories, CRMs (salesforce, Microsoft Dynamics, etc), Google Analytics PowerBI has the ability to connect to a variety of services. InPower BI can access information as directory services Active Directory, CRMs as Dynamis CRM Online or Salesforce (possibility of access to objects or reports, powerbi-content-pack-salesforce) Social networks like Facebook, Code repositories as Github (powerbi-content-pack-github), Service providers email marketing as MailChimp and many others. Offline mode • Availability of having data in memory for agility in response time • Ability to view data offline We have the ability to work offline mode via the product Power Mobile BI. This, will allow access to the latest information, even with limited connectivity. This is possible thanks to the behavior of the application every 2 hours, updates the contents of the views and the “caches" so that they are accessible even with limited connectivity (so far available for Android devices and iOS, (see offline-capabilities-for-power-bi- mobile-apps).
  • 81.
    PowerBI 81 Key Features -Access & Data Connection Transformation / Modeling Data Interface development • Development and modeling will be simple and will not require the end user advanced programming knowledge. In addition it will provide an interface for development, either via web or through a desktop application Power BI Desktop has an intuitive interface development will allow users to create analysis of a very simple way. Basically, it is sufficient that the user select the items to display and drag on the view, then you can adjust and format the graphic objects as desired. Generally speaking, it has a great usability. However, other operations, such as creating measures / custom columns that require more advanced skills. Combination of different data sources • Combination of different data sources To combine different data sources PowerBI, Simply go to the option Edit queries> combine queries, Where we can select queries to merge, and the type of combination (similar to JOINS: LEFT, RIGHT, INNER, etc.). Clearly, if the merge process is satisfactory, the data sources must maintain columns in common.
  • 82.
    PowerBI 82 Key Features -Access & Data Connection Integration personalized Portal • Possibility of integration into an external portal (Liferay, Sharepoint, etc) The PowerBI team is studying the possibility of integration and reporting and dashboards with online pages in SharePoint (see power bi Ideas). Additionally, with Power BI, it is possible to integrate reports and icons from a Power BI account by inserting an IFrame element in an application, such as a mobile application or a web application (see to integrate power bi tile).
  • 83.
    PowerBI 83 Views Graphics • Abilityto format / configure graphics • Advanced charting types: bubbles, heat maps, gantt, waterfall, funnel, etc. Once configured the data sources, managed relationships and other operations are required, we can create reports quickly and intuitively. From the report view, you can create visualizations that can then be published in Power BI, and anchored to a panel. From the side panels Visualizations and Fields, we can configure the analyzes. To do this, we will select the desired fields and the visualization that best suits the analysis that wants to be done. Subsequently, adjustments can be made to the graphics: colors, labels, title, etc. Key Features - Explore & Discover
  • 84.
    PowerBI 84 Views Trends / References • Possibilityto visualize or generate trend lines in a simple way, allowing the configuration of these (average, linear, etc.) and, reference lines (markers), with different customization options. They can be displayed and configured reference lines Power BI (see baselines). For this purpose, there are two possible options: • Through the side panel Views, Activate the option Reference line and it gives you the ability to set certain parameters as: value (line location), color, transparency, style, tag, etc. • Creating a new field (column) in the data set and then using the value of said column displays to display. As for trends, PowerBI does not have a direct functionality to get it. However, the PowerBI team is working on this functionality so that will probably be included in future versions of the product (see ability- to-add-trend-line-to-charts). Key Features - Explore & Discover
  • 85.
    PowerBI 85 Analytics functionality formulas •Possibility of incorporating new variables from calculations / custom formulas • Existence of predefined functions. Functions for calculating the% growth, trends, including financial functions, temporary functions, etc. Power BI allows the creation of computed columns (see calculated columns). In this way, they can add new data to an existing table in the model. To create this column, a formula expression data analysis (DAX) defining column values ​​will be created. The DAX formula language (see language dax) Includes a library of over 200 functions, operators and constructions. These formulas are very similar to Excel formulas, in fact, it has many of the functions that integrates Excel. Forecasting • Allows predictions based on predefined algorithms Functionality not directly available PowerBI. Still, it could be reached by relying on getting the power tool gives the DAX expressions. For an example, see the following link:recursive calculations using DAX. Key Features - Explore & Discover
  • 86.
    PowerBI 86 Analytics functionality Statistical tools /data mining • Integration with external tools to add forecasting functionalities (R, Weka, Python) In Power BI Desktop, you can run R scripts and import the resulting data sets into a Power BI Desktop data model. This functionality is in Beta phase. In order to have this functionality, it is necessary to install R on the local computer .A more detailed description of the process to follow is shown in the following link: Scripts r power bi. An example of "Forecasting” with R and Power BI can be seen here: powerbi-r. Data Discovery • Interactivity between graphics and other components. As the user selects certain parts of DashboardThe graphics will be updated as appropriate The visualizations that we develop within the same page of the report, will be all connected to each other. Which means that, if we select one or several values ​​in a visualization, other visualizations will change depending on that selection. The two modes that you have to interact with the visualizations in Power BI are: • Filters: Remove all data except those where you want to focus. Here, we have 3 possibilities. • Page filter: Applies to all page views Report • Visual filter: Applies to a single view of one page of the report • Report Filter: Applies to all pages of the report • Highlighted: This interaction does not filter, but highlights a subset of data visible; unhighlighted data remain visible but attenuated. Links: filters and highlighted, incorporating filters in reports Key Features - Explore & Discover
  • 87.
    PowerBI 87 Analytics functionality Maps integration • Possibilityto display data on maps in a simple way. The maps can be integrated via: country, City, zip code, latitude & longitude • Interactivity map. Possibility of clicking on the locations shown on the map and modify the content of these other components within the Dashboard/Panel • Choropleth maps. Possibility of certain color intensities based on the underlying securities. Power BI integrates with Bing to provide the coordinates of predetermined maps and facilitate the creation of maps. Bing uses some algorithms and suggestions to try to obtain the correct location, although it is an approximate calculation. To increase it is important to use the suggestions proposed in the documentation (see suggestions). In the data view, Power BI allows you to categorize a column to: address, city, continent, country or region, county, latitude, longitude, place, postal code or, state or province. The default maps are interactive, and act as a filter / highlight on the rest of the visualizations. Finally, there is the possibility of displaying coroplast maps (see coroplast maps) Key Features - Explore & Discover
  • 88.
    PowerBI 88 Multi platform Mobile platforms • Availabilityin different mobile platforms: Android, iOS, Windows Phone • Mobile version of the tool provides the user with features sharing / collaboration with other users With Tableau Mobile, users can stay connected to data from anywhere and anytime. Currently,Power BI has native applications for iPhone, iPad, Android and Windows 10 devices. On mobile platforms, you will be able to see and interact with reports and dashboards and reports will be shared assets and panels with other users. Key Features - Explore & Discover
  • 89.
    PowerBI 89 social skills andcollaborative Alerts and notifications • Ability to receive alerts or notifications. You are notified, for example, when a threshold is exceeded preconfigured. This functionality, today is not implemented in the service that Power BI offers in the cloud. However, it is possible to use this functionality via Mobile app. Specifically, this functionality is only available for iPhone devices. From this, we can configure alerts. The alert can be configured to receive notification when a value exceeds a certain upper, lower or both thresholds. To export • Export Graphics /dashboard PDF, PNG • Export values ​​to CSV, XLS / XLSX • Share dashboard with other users without access to these data sources. The data will be packaged / included within the dashboard itself • The tool allows you to export the data sources so that they can be loaded later It is posible to export the underlying information displays to files csv. The number of rows that can be downloaded is limited to 10000. In addition, the views can also be exported to pdf. the tool does not currently allow the export of data sources. Key Features - Share & Collaborate
  • 90.
    PowerBI 90 Security & Administration Security• Permissions at the level of Report / Dashboard • Data level permissions • Application of Statistical Secrecy (LOPD). Hiding sensitive information • Integration with third-party authentication services (CAS, LDAP, AD, etc.) • The information is always shown based on the roles to which the users belong, limiting the information to be displayed when Under Power BI, there is a complex authentication layer, which, based on local Active Directory servers, allows users to log in (more information on powerbi security). The level of reports and dashboards security is achieved through collaboration groups. In these, the administrator can define which users should be. Data level security can be obtained through rules that can be defined through DAX expressions and user roles. In this way, different users can view different contents. In Power BI, when a group is created (only available in the Power BI Pro version), we have the possibility of generating two types of roles: Administrators and Members. The latter, by default, can edit the contents. This configuration can be changed so that users under the Member role can only view the contents (see groups). Key Features - Administration
  • 91.
    PowerBI 91 Security & Administration Security• Security integration via JDBC • Integration Application Servers In the point Access & Data Connection> Integration> Custom Portal, we have already seen that you can "embed" views in custom portals (see integrate-a-power-bi-tile-or-report). However, it should be noted that, despite being able to embed visualizations within an application within an application server, it would not be possible to deploy Power BI on any of them, because it is a solution in the cloud. Both in the case of integration with SSO applications, and with security via JDBC, Power BI would not be possible. Keep in mind, that Power BI is a service hosted entirely in the cloud, so you do not have as many possibilities of configuration compared to a service that could be integrated into the servers of the companies Roles user / group • Possibility of establishing roles for Users / Groups A Power BI administrator can create groups and assign users to them. It is important to emphasize that Power BI supports the creation of groups only under the Pro version of your product. Regarding the roles, as has already been mentioned in the Security section, there can be two: Administrators and Members, who can edit content by default, but Power BI allows modifying this behavior. Key Features - Administration
  • 92.
    PowerBI 92 Installation & Implementation Citrix• Possibility of development on servers virtualized (Citrix MetaFrame, XenApp) Installation in a virtual environment such as Citrix, is identical to the installation in a normal environment. We would install the tool and then any user would have access to the desktop version of the tool. Volumetry • Ability to work with large data volumes When we use Power BI, the tool creates a local cache with the data it uses. Therefore, this cache is subject to certain limits. Specifically, because that information is stored in memory, we will be limited by the amount of memory we have in the machine and, for the amount of data that can be compressed, so, a knowledge of how Power BI compresses the data , could lead us to work with more data. These limits apply to both the desktop version and the cloud version. There is a limit of 250 MB for each data set that is imported in Power BI (see data-model limit and dataset limit). It is necessary to take into account here the limits imposed by the license that is being used: 1 GB for free users and 10 GB for PRO users (see data- capacity). There are also certain limitations if the service will be used via API REST: API REST limits. Key Features - Administration
  • 93.
  • 94.
    Tool Review PowerBI 94 Section PowerBI Access36.0 Connect to Data 46.8 Transformation / Data Modeling 46.0 Integration 34.5 Analytics functionality 59.3 Creation dashboards 36.9 Reports 24.0 Views 64.0 Multi platform 36.0 Scenario analysis 0.0 Social skills and collaborative 32.5 Important contents 27.0 Security & Administration 20.7 Installation & Implementation 33.3 Pricing 72.0 Multilanguage 32.0 Total 601.0
  • 95.
  • 96.
  • 97.
    Introduction Information Builders Its mottois based on three competencies are: Intelligence Integration and Integrity, which are built on a common architecture. For each of these competencies, WebFOCUS offers a fairly broad set of products to meet all the needs that an organization can have on their business. 97 Information Builders
  • 98.
    Intelligence. Product overview XBRLFinancial Reporting Exchange rstat Development Studio Application Studio Enable for Adobe Flex InfoAssist visual Discovery Quick Data Pro Server ReportCaster Hyperstage Performance Management Framework Portal Mobile Favorites Maintain Administration Active Technologies Workload Distribution Facility 98 Information Builders
  • 99.
    Integration. Product overview iWayService Manager iWay Parallel Service Manager iWay Universal Adapter Suite iWay DataMigrator iWay Activity Monitor (BAM) iWay Event Manager iWay Trading Partner Manager iWay Business Service Provider iWay Enterprise Index iWay Managed File Transfer (MFT) iWay Cloud Services for Amazon EC2 99 Information Builders
  • 100.
    Integrity. Product overview InformationBuilders iWay Data Quality Center iWay Data Steward Portal iWay Master Data Center iWay Data Profiler iWay EIM Server iWay Enterprise Master Patient Index Information Builders 100
  • 101.
  • 102.
  • 103.
    Architecture of Components InformationBuilders 103 Information Builders
  • 104.
  • 105.
    Technical Review It offersa platform of solid development complete and integrated that allows the access to the information to any type of level inside the organisations (executive, analytical and operational) Highly scalable and portable since it works in around 35 platforms. It integrates with the infrastructures of existent Internet. Content of WebFOCUS entregable by means of solutions of portal like mySAP, Plumtree, IBM WebSphere, Microsoft Sharepoint, jBoss, TIBCO, SunOne, etc. It offers one of the main lists of connectors of data. The native architecture of WebFOCUS, oriented to services (SOA), offers protection in diverse levels: roles, applications and data. It is possible also, make the integration with the infrastructure of existent security Servers multihilo, that allows that multiple users can access to the same information without overburdening the servers. Information Builders 105 Information Builders
  • 106.
  • 107.
    User Fatures Reports thatsupport high levels of parameterization and numerous output formats: Excel, PivotTable, PDF, HTML, XML, PowerPoint, etc. Storage, recovery and agile distribution of information via email, web browser, mobile devices, faxes and printers. It allows the delivery of information in any format to any mobile device and also allows offline analysis. Ease of design and management of workflows, being able to detect and monitor practically any technology event. Information Builders 107 Information Builders
  • 108.
  • 109.
    Information Builders 109 Key Features- Access & Connection to Data Connect to Data Archive • Possibility to configure like origin of data archives. For example: Excel, CSV, XML, Text. Among the available possibilities are: flat files, Excel, XML and CSV (see http://www.informationbuilders.com/products/webfocus/data_access). Databases • Connection to databases. For example: Oracle, SQL Server, MySQL, PostgreSQL, Teradata, IBM DB2, etc. It has a wide listing of possibilities. Among the most stood out are: Access, Informix, MySQL, Oracle, PosgreSQL, Microsoft SQL Server, Teradata, etc. To see the complete list of origins of databases endured: http://www.informationbuilders.com/products/webfocus/data_access. Files SAS • Reading of files SAS7BDAT of SAS It exists the possibility to connect to SAS with the connector ODBC of SAS. Information Builders
  • 110.
    Information Builders 110 Key Features- Access & Connection to Data Connect to Data Cloud / Big Dates • Possibility of connecting with Big Data or Cloud environments, such as Hadoop, Spark, Microsoft Azure, etc. In the field of Cloud / Big Data, Information Builders - WebFOCUS, through the adapters, gives the possibility of connection to environments such as Hive, Hortonworks, MongoDB, Clodera Impala, Cassandra, etc. (see information-builders-adapters). Additionally, the launch of iWay Hadoop Manager, a solution created for the management and integration of data based on Hadoop (see iway-hadoop-data-manager), has recently been announced. Cubes OLAP • Connection to cubes OLAP Among the available connectors, Information Builders has possibility of connection to cubes OLAP eat: Microsoft OLAP Services or SQL Server Analysis Services. Other Services • In addition to the aforementioned data sources, the possibility of connecting to other environments such as: web pages, social networks, code repositories, CRMs (Salesforce, Microsoft Dynamics, etc.), Google Analytics • Access to ERP data such as: SAP, SAP BW, Siebel or PeopleSoft. In addition, it also allows the management of XML Web services as data sources. It also allows connection to CRM, FTP, etc. (see https://www.youtube.com/watch?v=_I9iNSgKMKM Information Builders
  • 111.
    Information Builders 111 Key Features- Access & Connection to Data Connect to Data Off-line way • Availability to have data in memory for agility in response time • Possibility to consult data without connection Within the Information Builders environment, we have the analytical capability known as Active Technologies, which allows the combination of data and controls within an HTML file, so that valuable information can be delivered in a portable way, without connection or offline. This analytical capability is known as In-Documents Analytics. These analytical capabilities can be achieved either through the Application Studio or the InfoAssist (see active-technologies). With regard to the fact to be able to have of data in memory to speed up time of response, WebFOCUS has Hyperstage, a solution of hybrid storage among disk and memory, that allows to improve the times of response (information-builders-webfocus-hyperstage). WebFOCUS Mobile, gives the possibility also to work with analysis portables so much on-line like off-line (see mobile and WebFOCUS-InfoAssist). Information Builders
  • 112.
    Information Builders 112 Key Features- Access & Connection to Data Transformation/Modelación Data Interface of development • The development and modeling will be simple and, will not require the end user of advanced programming knowledge. It will also provide an interface for its development, either via the web or, through a desktop application Either through the Application Studio or the InfoAssist, elements can be dragged / dropped between columns. As in other products, it presents a zone from which you can specify the way in which the tables are related, create calculated fields, change the type of graphic, etc. However, unlike other tools of the competition, the interface is not so attractive (see http://www.pcmag.com/article2/0,2817,2495566,00.asp). Combination of different origins of data • Combination of different data sources. Thanks to the connectors provided by iWay, we have a native access to multiple data sources, which will generate data that we can later combine. Information Builders
  • 113.
    Information Builders 113 Key Features- Access & Connection to Data Integration Personalised portal • Possibility of integration in an external portal (Liferay, Sharepoint, etc) WebFOCUS, has of Open Portal Services, that allows the delivery of information and processes inside the companies through an only portal Web. WebFOCUS Open Portal Services, endures the integration with some of the main portals eat: SharePoint, IBM WebSphere and SAP. (See https://www.informationbuilders.com/new/newsletter/10-5/01_rodriguez) Information Builders
  • 114.
    Information Builders 114 Visualisations Tendencies/ References • Possibilityto visualize or generate trend lines in a simple way, allowing the configuration of these (average, linear, etc.) and, reference lines (markers), with different customization options. Both trend lines and reference lines can be added with both InfoAssist and Application Studio. In the case of reference lines, they can be used in a visualization, through the Series tab of the control panel. In addition, it will be possible to select between different types of reference lines: linear, polynomial, logarithmic, exponential, etc. As for the reference lines, they can be found in the Format tab of the control panel (see trend-reference- lines). Charts • Possibility to give format/configure the charts • Types of advanced charts: bubbles, maps of heat, gantt, waterfall, funnel, etc. Through the products InfoAssist or Application Studio, endows to the user of a wide variety of charts that will be able to use in his visualisations. Among the charts that will be able to use , find : charts of bars, of sectors, histograms, maps, etc. Possibility also, to include charts of third, as for example D3 graphics. Key Features - Explores & Discovers Information Builders
  • 115.
    Information Builders 115 Analytical functionality Formulas• Possibility of incorporating new variables from custom calculations / formulas • Existence of predefined functions. Functions for the calculation of% growth, trends, inclusion of financial functions, temporary functions, etc. With InfoAssist or Application Studio we have the possibility to create fields or calculated formulas. In addition, it has a wide collection of functions to manage: characters, dates, numbers, system functions, input / output functions, etc. (see http://datacenter.ucr.edu/focususing.pdf). Forecasting IIt allows making predictions based on predefined algorithms For this purpose, Information Builders has the product WebFOCUS RStat that, leaning on the bookshop R, allows the creation of statistical models. In addition to this product, has other solutions: Marketing Mix Modelling, oriented to activities of prediction on data of marketing, Optimisation of Prices and Planning of Sales and Operations. All of them, allow to simulate different stages, being able to see like this, how react some variables in base to some modifications on the variables that can occur (see http://www.informationbuilders.es/solutions/predictive-analytics). Key Features - Explores & Discovers Information Builders
  • 116.
    Information Builders 116 Analytical functionality Statistical tools/dates mining Integrationwith external tools that allow to add predictive functionalities (R, Weka, Python) As previously mentioned, with the WebFOCUS RStat product, there is a graphical interface that is supported by the R library. Through this tool, you can explore the data, create visualizations, build statistical models, etc. It dates Discovery • Interactivity between the graphics and the rest of the components. As the user selects certain parts of the Dashboard, the graphics will be updated as appropriate The possibility of performing Data Discovery in a simple way has been included in the latest versions of the tool. Specifically, in InfoAssist Plus, there are integrated technologies that will allow the user to analyze and navigate the data (see webfocus-date-discovery). Key Features - Explores & Discovers Information Builders
  • 117.
    Information Builders 117 Analytical functionality Integrationwith Maps • Possibility of showing data in maps in a simple way. • The maps can be integrated through: country, city, postal code, latitude & longitude • Interactivity of the map. Possibility of clicking on the locations shown on the map and that these modify the content of other components within the Dashboard / Panel • Heat maps. Possibility of establishing certain color intensities based on the underlying values. Information Builders and ESRI - one of the leading developers of geographic information systems - have created a solution to analyze geospatial information (see http://www.informationbuilders.com/solutions/ESRI). There is also, through the WebFOCUS add-on for Google Maps, the possibility of mapping geographic information on Google Maps (see http://www.informationbuilders.com/new/newsletter/9-2/04_lotrowski). Both points are included within the InfoAssist and Application Studio products Key Features - Explores & Discovers Information Builders
  • 118.
    Information Builders 118 Multiplataforma Mobile platforms • Availabilityin the different mobile platforms: Android, iOS, Windows Phone The mobile version of the tool, provides the user with sharing / collaboration features with other users The Information Builders BI platform, WebFOCUS offers dashboards, reports, maps and other visualizations on all mobile platforms, including iOS, Android and BlackBerry, without specific coding devices. This is possible, thanks to the WebFOCUS Mobile product. This will provide solutions based on HTML5, adaptable to the different screen sizes of the devices, with possibilities to save, classify or subscribe, etc. (see http://www.informationbuilders.com/products/webfocus/mobile). Key Features - Explores & Discovers Information Builders
  • 119.
    Information Builders 119 Social capacitiesand of collaboration Alerts and notifications Possibility of receiving alerts or notifications. It must be reported, for example, when a pre-configured threshold has been exceeded. It allows the generation of automatic alerts, in real time, based on certain events or, when certain business rules are met. To achieve this, we can, based on WebFOCUS ReportCaster, based on certain alerts or defined notifications, distribute the information related to the event to the appropriate people. Another way to be aware of possible errors or alerts is through the Business Activity Monitoring, which monitors in real time the business activities (see http://www.informationbuilders.com/products/webfocus/real_time and http://www.informationbuilders.com/products/webfocus/operational_dashboard). Key Features - Share & Collaborate Information Builders
  • 120.
    Information Builders 120 Social capacitiesand of collaboration Export • Export charts/dashboard PDF, PNG • Export values to CSV, XLS/XLSX • Share dashboard with other users without need that these have access to the origins of data. The data will be packed/included inside the own Dashboard • The tool allows to export the data sources, so that these can be uploaded later The WebFOCUS platform BI , allows to hand the information in a wide variety of formats: HTML, Excel, PDF or PowerPoint. Planificador Distribution • Delivery of reports/dashboards via mail WebFOCUS ReportCaster, allows to carry out the relevant procedures for the distribution of information. This product allows the programming of this distribution or the format in which it will be sent, including: HTML, Excel, PDF, etc. In addition, this distribution can be done safely, thanks to the possibility of encryption, compression of said information (See http://www.informationbuilders.com/products/webfocus/delivery_manage). Key Features - Share & Collaborate Information Builders
  • 121.
    Information Builders 121 Security &Administration Security • Permissions at the level of Report / Dashboard • Data level permissions • Application of Statistical Secrecy (LOPD). Hiding sensitive information • Security integration via JDBC Integration in application servers • Integration with third-party authentication services (CAS, LDAP, AD, etc.) • The information is always shown based on the roles to which the users belong, limiting the information to be displayed when appropriate.ermissions to level of Report/Dashboard Security within the Information Builders environment is given at different levels: application-based security, data-level security, so that users only see what they are authorized to do, and external security, which refers to security systems. external authentication such as LDAP, ADS or Entrust (see http://www.informationbuilders.com/products/webfocus/security). Information Builders WebFOCUS can be fully integrated into application servers, through WebFOCUS Open Portal Services, also providing customization possibilities and supporting the integration also at the security level, so that users within the application server can be authorized to receive information (see http://www.informationbuilders.com/products/webfocus/wf_ibm). Regarding the issue of application of statistical secrecy, it can be achieved through procedures and data restriction rules (see encrypt) and through the WebFOCUS Resource Analyzer module Key Features - Administration Information Builders
  • 122.
    Information Builders 122 Security &Administration Roles of user/group • Possibility to setup roles for users/groups As already mentioned in the Security section, one of the levels on which security can be applied is the level of Application Access, where administrators, within WebFOCUS Portal can manage and define accesses based on user groups, departments or roles. Key Features - Administration Information Builders
  • 123.
    Information Builders 123 Installation &Implementation Citrix • Possibility of development in virtualized servers (Citrix MetaFrame, XenApp) WebFOCUS Developer Studio can be integrated into virtualized environments. For this they have to be configured with the appropriate hardware and operating system. Volumetry • Working capacity with large data volumes We have already seen in some previous point the possibilities offered by WebFOCUS when working with Big Data technologies. Currently, the huge volumes of data that can be handled today are not a problem, since they can be treated with technologies such as Hadoop or the Hortonworks data platform. Once these data have been processed, they can be viewed through the tools provided by WebFOCUS. (See Information-Builders-Hortonworks-Solution-Brief). It should also be noted, within the WebFOCUS environment, the WebFOCUS Hyperstage tool. It is an integrated data warehouse that dramatically improves the performance of the BI environment. For this, it is based on an internal structuring of the columnar database, making that, for databases that have a large number of columns, of which a few are consulted, with WebFOCUS Hyperstage it is possible to simplify this operation, improving well the response times. The tool in question, supports up to 50TB with a single server and, in addition to improvements in performance, will also reduce the use of the disk in large databases (webfocus-hyperstage). Key Features - Administration Information Builders
  • 124.
  • 125.
    Evaluation of thetool Information Builders 125 Section Information Builders Access 36,0 Connect to Data 52,8 Transformation/Modelación Data 38,0 Integration 48,0 Analytical functionality 53,6 Creation Dashboards 26,6 Reports 72,0 Visualisations 56,0 Multiplataforma 36,0 Analysis of stages 27,0 Social capacities and of collaboration 41,5 Important content 27,0 Security & Administration 58,0 Installation & Implementation 46,7 Pricing 24,0 Multilenguaje 36,0 Total 679,2 Information Builders
  • 126.
  • 127.
  • 128.
    Introduction SAS SAS Institute isthe world's largest private equity software company, leader in Business Analytics. It was founded in the United States 40 years ago and has a presence throughout the world. It has more than 14 thousand employees in the world that offer support services to the 90 companies of the Fortune Top 100 list, who are customers of SAS 128 SAS
  • 129.
    Introduction SAS is alsoa programming language developed by SAS Institute to finals of the years sixty. The language SAS operates mainly on tables of data (reading, transformation, combination, creation of reports). There are procedure modules that expand the capacities of the basic language. SAS/IML: implements an alternative language to Matlab or R. SAS/STAT: procedures to make statistical analyses (regressions, etc.) SAS/ETS: statistical analysis of temporary series SAS/OR: resolution of problems of operative investigation SAS/GRAPH: charts creation 129 SAS
  • 130.
    Introduction Within the multipleapplications, services and platforms we can distinguish groups of tools that SAS markets as Products SAS Enterprise BI Server  Complete suite with development tools: ETL, SAS code, reporting and analytics SAS Visual Analytics  Suite integrated of web applications that offers an intuitive interaction drag & drop. This set of applications are oriented to the analytical visualisation allow to do reporting and exploration of data. It GOES it uses technology SAS LASR by what executes in memory. SAS Enterprise Miner  Tool that streamlines the process of data mining to create high-precision predictive and descriptive models based on the analysis of large amounts of data across the company. Use cases: detect fraud, stop the loss of customers ... 130 SAS
  • 131.
    Introduction PREPARATION OF DATA •Monitors the Analytical Server SAS® LASR™ • Load and joins data • Creation of columns calculated EXPLORER • Ad hoc analysis • Data discovery DESIGNS • Creates pictures of controls to be visualised in the web or in mobiles from the Visual Analytics Designer BI MOBILE • Native application for iOS and Android that offers the interactive reports created in the Visual Analytics Designer SAS Visual Analytics Powerful analytical solution for all types of users: business users with limited technical skills, statistics, data scientists .. 131 SAS
  • 132.
    Introduction It DATES PREP ENVIRONMENT ADMIN EXPLORER DESIGNER REPORTS FINDER MOBILE FINDER WEB IT/ DATES MANAGER HUB ANALYST It DATES PREP ENVIRONMENT ADMIN EXPLORER DESIGNER HUB REPORTS FINDER MOBILE FINDER WEB USER OF BUSINESSES It DATES PREP ENVIRONMENT ADMIN EXPLORER DESIGNER HUB REPORTS FINDER MOBILE FINDER WEB Visual Analytics: For all the roles: User of Businesses Analyst IT/Dates Manager 132 SAS
  • 133.
    Introduction SAS Visual Analytics:Analytical visualization tool in memory, allows reporting and data exploration. Visual Analytics includes state-of-the-art graphics, mobile support and a large number of predefined predictive capabilities. Use SAS LASR technology to run in memory.. SAS BI Dashboard: Web tool that allows users to create dashboards. Easy-to-use interface and has role-based security. SAS Dates Integration Studio: ETL Tool with interface of visual development . SAS Enterprise Guide: Client application to run on Windows environments that allows a guided way to execute SAS programs and publish the results dynamically throughout the entire organization SAS Information Map Studio: Creator of maps of information (areas of metadatos). The maps of information represent a layer that isolates to the final users of the complexities of the databases. 133 SAS Creator of information maps (metadata areas). Information maps represent a layer that isolates end users from the complexities of databases
  • 134.
    Introduction SAS OLAP Server: OLAP Server that manages the access to OLAP cubes of SAS. These cubes can query using the standard MDX. SAS OLAP Cube Studio : Graphical tool to create cubes OLAP of SAS. From it can define aggregations. SAS Web Report Studio: Web report designer (for example, you can use an OLAP SAS cube as a source SAS Information Delivery Portal: Web tool to access a wide variety of information (reports, stored processes, information maps, web applications, files ..) SAS Dates Management: Tool oriented to integration processes, quality and data governance. SAS Management Console: Tool to administer all the platform (administration of servers, programming of works, administration of roles and users, repository of metadata) 134 SAS
  • 135.
    Introduction SAS Enterprise Miner:Tool with a powerful visual interface to perform data mining tasks. It allows generating advanced models for descriptive and predictive analytical processes. Includes data preparation and exploration features and integration with R.. SAS LASR Analytic Server: Multiuser Analytical platform that stores the data in RAM memory. SAS Dates Loader for Hadoop: Tool to manage Big Data environments. It allows to load data in memory in SAS LASR Analytic Server. It allows to copy data to Hadoop from Oracle, Teradata or a SAS Server and execute SAS and Hadoop SQL programs from a graphical interface. It includes access, cleaning and profiling functions of the data. JMP SAS: Tool for statistical Data Discovery. Visualization tool with extensive statistical capabilities. 135 SAS
  • 136.
    SAS Introduction Tools by functionality: Dashboards,Reporting/Queries and Analysis: Information Delivery Portal, Web Report Studio, Enterprise Guide, Visual Analytics. OLAP: OLAP Cube Studio, Web OLAP Viewer Analytical integrated: Enterprise Guide Metadata Management : Information Map Studio Administration and Management: Management Console ETL: Data Integration Studio Minería de Datos: Enterprise Miner Big Data: Data Loader for Hadoop Data Discovery Estadístico: JMP 136 SAS
  • 137.
  • 138.
    Architecture of VisualAnalytics Under Level  Server SAS LASR : Storage in Memory Half Level  Servers: Metadata ,Workspaces and Visual Analytics Mid-Tier High Level Clients: Desktop, Web and Mobile 138 SAS
  • 139.
    Architecture SAS EnterpriseBI Data Sources: RDBMS, Cubes and set of data SAS, ERP…. Low Level  Application Server : OLAP, Metadatos, Processes Stored... Half Level  Web Server: Information Delivery Portal, BI Dashboard, Web Report Studio… High Level  Desktop Clients: Enterprise Guide, GAVE Studio, Information Map Studio… 139 SAS
  • 140.
    Architecture SAS EnterpriseBI SAS Under Level Server of Applications: OLAP Server Spaces of work Management Server Processes Management Server of Connection to SAS Server 140 SAS
  • 141.
    Architecture SAS EnterpriseBI SAS Half Level  Server Web: SAS Web Report Studio SAS Information Delivery Portal SAS Web OLAP Viewer for Java SAS BI Dashboard SAS Web Infrastructure Platform (Login, Preferences, Objects shared, processes stored…) 141 SAS
  • 142.
    Architecture SAS EnterpriseBI SAS High Level  Clients of Desk: SAS Enterprise Guide SAS Enterprise Miner SAS Dates Integration Studio SAS Information Map Studio SAS OLAP Cube Studio SAS Management Console SAS Add-in For Office 142 SAS
  • 143.
  • 144.
    Technical Review SAS ManagementConsole (Documentation): It is the unique and centralized control place from where resources are managed within SAS: • Definition of servers and bookshops. • Definition of users, groups and roles • Control of access to the different resources • Metadata Repositories • Job Programming 144 SAS
  • 145.
    Technical Review SAS Register externalconnections in SAS Tutorial 1. Configure the Compound Server so that it communicate with the source 2. Define a source ODBC 3. Register the server of BBDD 4. Register the bookshop of BBDD 145 SAS
  • 146.
    Technical Review SAS LASRAnalytic Server: Analytical platform in RAM memory used in SAS Visual Analytics with the following characteristic System of Massive Parallel Process (MPP) and mullti thread Possibility of deployment distributed with Teradata DW or Greenplum Reading data from HDFS 146 SAS
  • 147.
    Technical Review SAS VisualAnalytics Hub for users Administrators. From the SAS Visual Analytics Administrator we can manage which elements will be loaded into memory. There is also a tab to check mobile connections. 147 SAS
  • 148.
    Technical Review SAS DatesIntegration Studio ETL desktop tool in which develops data integration processes visually. In its latest version, a component that allows loading tables in SAS LASR Analytic Server has been added. 148 SAS
  • 149.
    Technical Review SAS EnterpriseGuide: Desktop tool that allows analysts and statisticians from a graphical interface and without the need of programming knowledge in SAS the following capacities: Access to data from multiple platforms, operating systems and databases Create and share stored processes Share reports and datasets Perform correlation analysis and build predictive models Viewing SAS OLAP Cubes 149 SAS
  • 150.
    Technical Review SAS OLAPCube Studio Desktop tool designed to create SAS OLAP cubes. From this editor we can create aggregations, update cubes and add new members calculated in cubes that will be exploited by other SAS applications (Enterprise Guide, Web OLAP Viewer ...). 150 SAS
  • 151.
  • 152.
    User Features SAS VisualAnalytics Hub: Point of entry to SAS GOES from which can: Prepare the data Create Reports Explore the data Open a report saved Open a query saved Open an exploration saved 152 SAS
  • 153.
    User Features SAS VisualAnalytics Hub: Prepare the data using the Visual Dates Builder 153 SAS
  • 154.
    User Features SAS VisualAnalytics Explorer: Exploration of simple data: • The variables are interpreted as categories or metric. • To create a visualisation drag a variable to the central area and select the type of chart 154 SAS
  • 155.
    User Features Analysis ofStages (video) with SAS Visual Analytics Procedure • Deploys the tab of Analysis of Stages. • For each measure selects the values of future data and updates to see the new results 155 SAS
  • 156.
    SAS User Feature Visual Analyticsexample of Dashboard 156 SAS
  • 157.
    User Feature SAS WebReport Studio: Web tool oriented to business users that allows end users:: Visualise, create and share reports Include views of cubes of SAS OLAP 157 SAS
  • 158.
    Connects with SAS SAS Supportfor clients SAS Community Facebook Twitter Linkedin Google+ Blogs RSS SAS User Features 158 SAS
  • 159.
  • 160.
    SAS 160 Key Features -Access & Connection to Data Connect to Data Archive • Possibility to configure it as data files source. For example: Excel, CSV, XML, Text. SAS Enterprise Guide: It allows to read all type of text files . It also allows to integrate Excel files . SAS Dates Integration Studio: This ETL tool allows us to work with all type of files of text (.txt, .csv, .xml) And Excel. Databases • Connections to databases. For example: Oracle, SQL Server, MySQL, PostgreSQL, Teradata, IBM DB2, etc. SAS Enterprise Guide: Using the bookshop SAS/ACCESS Interface to ODBC will be able to connect to all the databases that use this standard. Specific documentation of the bookshop SAS/Access for Oracle. SAS Dates Integration Studio: In addition to the ODBC connection standard there are pre-configured libraries to connect to DB2, Sybase, Teradata, Oracle. These connections will be registered in the SAS metadata server by the administrator that will make them accessible to the rest of the suite's tools. SAS
  • 161.
    SAS 161 Key Features -Access & Connection to Data Connect to Data Files SAS • Reading of files SAS7BDAT of SAS SAS7BDAT means “SAS system dates set” . This extension is the standard format of SAS and all the applications allow to export and import in this format. Cloud / Big Dates • Possibility to connect with Big Data environments or Cloud, such as Hadoop, Spark, Microsoft Azure, etc. SAS Dates Loader for Hadoop: Copies data to Hadoop from Oracle, Teradata or a Server SAS. It executes SAS programs and Hadoop SQL programs from a graphic interface. Functionalities of access, cleansing and profiling of the data. It provides secure access to HortonWorks / Cloudera and can integrate with LDAP or Actuate Directory for the authentication of users.. There are also other ways to connect to Hadoop from SAS for example by means of SAS/ACCESS to Hadoop that allows to extract data of Hadoop via libname or proc sql connecting with HiveQL. SAS
  • 162.
    SAS 162 Key Features -Access & Connection to Data Connect to Data Cubes OLAP • Connection to OLAP cubes It is evident that there is connectivity from the visualization tools to the SAS own cubes. Also through the use of SAS / ACCESS to OLE DB libraries we can connect to cubes Microsoft SQL Server Analysis Services. Other Services • In addition to the aforementioned data sources, the possibility of connecting to other environments such as: web pages, social networks, code repositories, CRMs (Salesforce, Microsoft Dynamics, etc.), Google Analytics Using the ODBC standard, we can register a connection to Salesforce within the SAS application and data servers and then use it from SAS Data Integration Studio. SAS Visual Analytics has a functionality to connect Google Analytics directly. Off-line way • Availability to have data in memory for agility in time of response • Possibility to consult data without connection SAS Visual Analytics it includes the possibility in its mobile version to visualize the offline control panels using a network anchoring or tethering. SAS LASR Analytic Server is the multiuser analytic platform that stores the data in RAM that Visual Analytics uses below. SAS
  • 163.
    SAS 163 Key Features -Access & Connection to Data Transformation/Modelación Data Interface of development • The development and modeling will be simple and, will not require the end user of advanced programming knowledge. In addition, an interface for its development will be provided, either via the web or through a desktop application. . SAS Visual Analytics: End-user web tool in which technical knowledge is not required. Advanced analytics have been seamlessly integrated, including decision trees, network diagrams, on-the-fly projection and scenario analysis with easy-to-use features such as automatic diagram creation and drag-and-drop capabilities. SAS BI Dashboard: Web tool for end users that allows to create dashboards including all kinds of existing elements in SAS: graphics, OLAP views, tables, trend lines. Combination of different origins of data • Possibility to combine several data sources SAS Dates Integration Studio:ETL tool that allows to graphically combine and combine information flows from a wide spectrum of sources (files, database records ...). SAS Enterprise Guide:Lightweight integration tool with the ability to combine data sources from different sources but with more limited capabilities than DI Studio. SAS
  • 164.
    SAS 164 Key Features -Access & Connection to Data Integration Personalised portal • Possibility of integration in an external portal (Liferay, Sharepoint, etc) Document of integration of elements of SAS BI Dashboard with Sharepoint. SAS
  • 165.
    SAS 165 Visualisations Charts • Possibilityto format/configure the charts • Types of advanced charts: bubbles, maps of heat, Gantt, waterfall, funnel, etc. SAS Visual Analytics includes a wide range of available graphics: Bars, lines, tart, Waterfall, Treemap, funnel, bubbles, dispersion, crossed table, speedometers ... All the components have a section from which we will configure their format and properties Tendencies/ Reference Possibility to visualize or generate trend lines in a simple way, allowing the configuration of these (average, linear, etc.) and, reference lines (markers), with different customization options SAS Visual Analytics: allows you to add trend lines by configuring the time axis and the measure that the line to be displayed will represent. It also allows to create lines of adjustment (Fit Lines) the data of the following types: • Linear • Quadratic • Cubic • B-Spline With penalty To level of code can also generate lines of tendency using SAS GRAPH. Key Features – Explores & Discovers SAS
  • 166.
    SAS 166 Analytical functionality Formulas •Possibility of incorporation of new variables from calculations/customized formulas • Existence of predefined functions. Functions for the calculation of% growth, trends, inclusion of financial functions, temporary functions, etc. SAS Visual Analytics includes an expression editor that offers us the opportunity to create new members based on operations on the source columns. In this editor there are operators: numeric, boolean, comparison and temporary (date / time). From the editor of aggregated metrics we will be able to create new indicators using the common aggregation functions (Average, Maximum, Count, Count Different, Minimum ...). We can also work with annual accumulation calculations and Period-To-Date calculations. At the platform level SAS provides the FINANCE function available for use from the different tools of the suite that performs financial calculations such as depreciation, interest, savings and rates of return. Forecasting • It allows to make predictions in base to algorithms predefinidos In SAS Visual Analytics: Exists the possibility to make a chart by means of the right click the functionality to show the prediction. It is possible to configure the metric that wants that they take part in the generation of our predictions. There is also the possibility of carrying out simple decision trees. Key Features – Explores & Discovers SAS
  • 167.
    SAS 167 Analytical functionality Statistical tools/dates mining • Integrationwith external tools that allow to add predectives functionalities (R, Weka, Python) There are several ways to run Python and R programs within SAS code: SAS IML (Interactive Matrix Language) Studio allows you to integrate R code through a PROC IML procedure. Another valid option for R and Python would be to install a Java class (SASJavaExec.jar) and use this java object in a SAS DATA step, see tutorial. In SAS Enterprise Miner we could also execute Python code within a SAS program. It dates Discovery • Interactiveness among the charts and the rest of components. To measure that the user selects some parts of the dashboard, the charts will go updating as it correspond. There is a solution called SAS Visual Data Discovery that provides high technical knowledge and advanced visualization capabilities using different platform tools, among which we can highlight JMP to visualize graphics. . Key Features – Explores & Discovers SAS
  • 168.
    SAS 168 Multiplataforma Mobile platforms • Availability inthe different mobile platforms: Android, iOS, Windows Phone • The mobile version of the tool, provides the user with sharing / collaboration features with other users SAS Mobile BI is the application that from the different mobile platforms (itunes, Google Play) will allow us to access the business reports and dashboards of SAS Visual Analytics from Apple® iOS and Android devices. Within the application there is a table of contents view from which the different elements of the miniature control panel are displayed. You can include comments at the report level or at the element level (charts, tables) from a section where comments and alerts are available. The feature of adding comments is very useful to collaborate with other team members. Within a comment we can attach elements (for example images). Key Features – Explores & Discovers SAS
  • 169.
    SAS 169 Social capacities andof collaboration Alerts and notifications • Possibility of receiving alerts or notifications. It must be notified, for example, when a previously configured threshold has been exceeded SAS Visual Analytics offers us the functionality to create alerts for the different elements of a report and notify certain users if certain criteria are met. In the configuration of the alert we will specify the column, the condition, the threshold value, the frequency of the check and the recipients thereof.. Export • Export charts/dashboard PDF, PNG • Export values to CSV, XLS/XLSX • Share dashboard with other users without need that these have access to the origins of data. The data will be packed/included inside the own Dashboard. • The tool allows to export the data source, so that these can be uploaded later SAS Visual Analytics allows us export/save the elements of a chart to formats Excel 2007 xlsx, separate text by tabs tsv or separate text by commas csv. SAS7BDAT data files are used on the SAS platform, this extension is the standard SAS format and all applications allow exporting and importing in this format.. Key Features – Share & Collaborate SAS
  • 170.
    SAS 170 Social capacities andof collaboration Planificador Distribution • Delivery of reports/dashboards via mail SAS Visual Analytics provides a simple wizard for the distribution of reports called New Report Job. SAS Web Report Studio allows launching queries to generate static reports to users, in addition it allows us to carry out planning and distribute reports.. If we go down to SAS code level there are also by using complicated macros in which the generated reports are distributed to a series of recipients. Key Features – Share & Collaborate SAS
  • 171.
    SAS 171 Security & Administration Security• Integration security via JDBC • Integration in servers of applications • Integration with services of authentication of third (CAS, LDAP, AD, etc) • Permissions to level of Report/Dashboard and permissions to level of data • Application of Statistical Secret (LOPD). Concealment of sensitive information. SAS supports deployment with WebSphere Application Server and WebSphere Application Server Network. There is a wizard to easily perform the deployment with WebSphere Application Server Network, for WebSphere Application Server manual configuration steps are needed. SAS allows to use as an authentication system IBM Tivoli Access Manager, this complete network security and authorization policy management solution. SAS does not have JDBC connectivity to perform an existing role mapping in an external tool. SAS Visual Analytics allows you to control security at the row level from your administration tool. This document explains how to make this configuration in which we can establish some formulas with the conditions of access to the data. Before applying this type of security we must ensure that the user or group exists in the SAS management console (SAS Management Console) SAS Federation Server provides data access control, auditing and encryption functions. In this document we will see how encryption techniques are used to hide sensitive data from personally identifiable information. Key Features – Administration SAS
  • 172.
    SAS 172 Security & Administration Rolesof user/group • Possibility to setup roles for users/groups • Integration with third-party authentication services and the possibility of creating custom authentication mechanisms (CAS, LDAP, AD, etc.) From the user management plugin (User Manager) located within the SAS management console (SAS Management Console) centrally provides the management of user metadata within the platform. When the user manager registers a new user / group in the system, an entity of type SAS Open Metadata Architecture is created for this user / group. The function of these entities is the following: Authorize users or groups to access certain resources or metadata Allow applications to retrieve the appropriate access credentials for servers and other resources In this plugin the following definitions will be created Users (User Metadata Identity): At this point users are created and assigned access to the different servers. Groups (Group Metadata Identity): Groups are created here and assigned to users. Access (Login Definitions): An access definition contains the access credentials for a specific account within a specific authentication provider (Windows Local or Network Account, Microsoft Active Directory account, LDAP account, UNIX oz / OS account) ...) Key Features – Administration SAS
  • 173.
    SAS 173 Installation & Implementation Citrix• Possibility of development in virtualized servers (Citrix MetaFrame, XenApp) All SAS products starting in version 9.2 and above are supported in a virtualized presentation environment (see official documentation): • Terminal Services in Windows Server 2003 • Terminal Services for Windows Server 2008 • Remote Desktop Services Windows Server 2008 R2 • Remote Desktop Services Windows Server 2012 • Remote Desktop Services Windows Server 2012 R2 • Citrix Presentation ServerTM 4.0 • Citrix Presentation ServerTM 4.5 • Citrix XenAppTM 5.0 and upper Volumetry • Capacity of work with high data volumes SAS Dates Loader for Hadoop: Tool for managing Big Data environments. It allows to load data in memory in SAS LASR Analytic Server. It allows to copy data to Hadoop from Oracle, Teradata or a SAS Server and execute SAS and Hadoop SQL programs from a graphic interface. It includes access, cleaning and profiling functions of the data. SAS Visual Analytics also uses SAS LASR memory technology. Key Features – Administration SAS
  • 174.
  • 175.
    Tool Review SAS 175 Section SAS Access45,0 Connect to Data 64,8 Transformation/Modelación Data 48,0 Integration 58,5 Analytical functionality 60,0 Creation Dashboards 30,0 Reports 48,0 Visualisations 72,0 Multiplataform 36,0 Analysis of stages 27,0 Social capacities and of collaboration 40,5 Important content 18,0 Security & Administration 52,7 Installation & Implementation 47,3 Pricing 24,0 Multilenguaje 32,0 Total 703,8 SAS
  • 176.
  • 177.
  • 178.
    Introduction QlikView One of QlikView'sslogans is that it allows you to discover and visualize data autonomously (self-service), which allows intuition to go ahead. QlikView aims to simplify the analysis for all types of users. • It consolidates information quickly of any data source • Search for data with ease • The information is displayed with high quality graphics 178 QlikView
  • 179.
    QlikView QlikView is aplatform for Business Discovery. Business Discovery is the term that gives name to Business intelligence defined by the user, simplifying decision making. It is the original tool of the company Qlik. Introduction 179 QlikView
  • 180.
    Qlik Sense isa new generation self-service data visualization application that allows users to easily create a range of interactive visualizations that lead to exploration and discovery using our intuition. Introduction 180 QlikView
  • 181.
    • Leading platformin the BI and Business Discovery market. • Used for the development and deployment of very powerful and complex analytical control panels for exploration & discovery that we call guided analytics. • State-of-the-art technology designed for Visualization and Self-Service that we call self-service visualization. • It allows an end user to create flexible and interactive visualizations using his intuition. Introduction 181 QlikView
  • 182.
    • Version forinstallable standalone Windows of Qlik Sense. • Includes all features to create visualizations and consume information • Sharing local files • Allows you to export applications to Qlik Sense Cloud • Free download, no application limit or information sharing restrictions • New platform for Qlik cloud services • This service allows you to share visualization applications created with QlikView Sense Desktop. • Interactive search and information exploration. • Web tool that supports access from any type of device including mobile. • Full Enterprise Version of Qlik Sense • Deployment available in own servers or private cloud • All user capabilities available in a unified client • Robust set of available business features • Licensing system based on tokens 182 QlikView
  • 183.
    QlikView • Instructions ofArmed • Interaction with the pieces guided • Complex results Box Rasti Rasti Blocks • Without Instructions • Each user has high flexibility to create his own models Introduction 183 QlikView
  • 184.
    • Qlik NPrintingis an application for the creation, distribution and programming of reports in QlikView (tutorial). Purchased by Qlik to Vizubi in 2015. • Web and pixel perfect reports that are exported to all Office tools (Word, Excel, PowerPoint). Drag & Drop elements from QlikView. • We will be able to add to our reports data, pivot tables, graphics, existing sheets sheets in QlikView applications. • Distribution and planning of sending reports (Report Bursting) Introduction 184 QlikView
  • 185.
  • 186.
    QlikView QlikView Developer Development toolto create: 1) Data extractions and transformations 2) Graphical interface layer (dashboards) Generates QVW files (.qvw) Architecture QlikView Server (QVS) Access point via web Analytical engine in memory Manage the connection between the server and the Qlikview client QlikView Publisher It has two main functions: 1. Reload the data (.qvw) and execute the transformations 2. Distribute the documents to the different existing servers 186 QlikView
  • 187.
    Architecture QlikView Main components ofQlikView: QlikView Desktop (Back End), QlikView Server (Front End), QlikView Publisher (Back End) TWe should also mention QlikView Access Point (Front End), a web page hosted on QlikView Server that shows the documents available to the user connected to the platform. 187 QlikView
  • 188.
    Architecture QlikView Back end Architecture Containssource documents created by QlikView Developer Typical file types QVW, QVD and LOG QlikView Publisher is the main component of the back end Security at the file level is always handled by Windows 188 QlikView
  • 189.
    Architecture QlikView Front end Architecture Containsuser documents generated and distributed by Publisher Typical front end file types: QVW, META and SHARED Main Components QlikView Server and QlikView Web Server or Internet Information Services The security of the client and the file system are in charge of the QlikView Server 189 QlikView
  • 190.
    Architecture QlikView Cluster Servers Additional serverscan be added to create an Active / Active cluster (2 servers working simultaneously) that allows high availability Automatically raise different applications in each node to achieve an optimal memory balance If one of the servers fails, the other server can respond to the users guaranteeing the service QlikView Server Clúster 190 QlikView
  • 191.
    Architecture QlikView Publishers Cluster Additional serverscan be added to create an Active / Active cluster that allows high availability of the service. The tasks of Publisher will be distributed among the nodes according to a formula we will configure of occupied memory and CPU in use. QlikView Server Publisher 191 QlikView
  • 192.
    Architecture QlikView QlikView Escalation Scale separatingQlikView Server and Publisher into 2 different servers Scale by adding more clustered QlikView Server / Publisher servers Add extra web servers, using load balancers. 192 QlikView
  • 193.
  • 194.
    Technical Review QlikView Associative technologyin memory 1. Easily consolidates information from multiple data sources 2. Load all information in memory 3. Allows analysis and associative searches in real time 4. Compress the data to 10% of its original size 5. Optimize processor power 194 QlikView
  • 195.
    QlikView Aasociative Technology inmemory • Automatically maintains all associations between all analyzed fields • Calculate aggregations on the fly as needed Technical Review 195 QlikView
  • 196.
    Technical Review File Extensionsin QlikView • QVW (QlikView Worksheet): Application file that includes: data, reports, graphs, scripts, data model and connection strings. • QVD (QlikView Data): QlikView's patent is used to extract and store the input and output data; it has a reading speed 100 times higher compared to other sources due to its optimized storage format. One of the main advantages of using QVD files is that, once you have a QVD on your disk, the information can be exploited by more than one QlikView application. This reduces the load on the database and optimizes resources and development time. • QVX (QlikView Data Exchange): It is used for data entry from external systems to QlikView (for example if you are not using ODBC / OLEDB connections). The main difference with respect to QVD files is that QVX is a public format and can be created from external interfaces. It can be considered as the format in which the custom data sources send the QlikView data through the custom connector. 196 QlikView
  • 197.
    Technical Review QlikView Analyticalcapacity It dependYOU It depends of the User of Company Power and simplicity: IT department independence and high analytical capacity 197 QlikView
  • 198.
    Technical Review QlikView ARCHITECTURE BASEDON REPORTS (Controlled by IT) ARCHITECTURE BUSINESS DISCOVERY (Guided by the corporate user, self-service) New role of the IT department 198 QlikView
  • 199.
    Ratios Of ITin implementations of systems BI QlikView Query Based QlikView Disk Space 7- 20 X in DW+Cubes+Inform 0,02-0,1 X in Associative Query Language Query Exec. Time Variable (Second to Hours) Consistent (Instantaneous) Project Time 4 to 24 Months 1 to 3 Months Time for changes Weeks/Months Hours/Days Calculation T1: Disk to CPU T2: Selection T3: Calculation T4: Visualisation (another tool) T1= 0 T2= 0 T3: Calculation and Visualisation optimised Expertise Requirements Experts in ETLs, DW and other tools of visualisation 1 Expert in QlikView + functional users Technical Review 199 QlikView
  • 200.
    Technical Feaures QlikView Dimensional modelsin QlikView Advantages and disadvantages of various types of modeling schemes in relation to QlikView 200 QlikView
  • 201.
  • 202.
    User Features QlikView QlikView isthe leader in the Magic Quadrant of Gartner Two well differentiated segments: Report-oriented BI and Data Discovery Business Discovery: BI directed by the business user 202 QlikView
  • 203.
    User Features QlikView Value addedin little time Experience asociativa Analysis to the speed of our thought Access to business data from any place Interactiveness centred in the user Business Discovery QlikView 203
  • 204.
    The associative searchallows users to manage Traditional Asociativa • Linear thinking, pre-defined • Knowledge lost in hidden data • Months to implement changes • Centered on the data • The user decides where to start • All the data, always visible • Minutes to implement changes • Focused on knowledge User Features 204 QlikView
  • 205.
    User Features QlikView QlikView AccessPoint: It is the web portal to which the end users will connect to see the available QlikView documents. 205 QlikView
  • 206.
    User Features QlikView Inmobile devices : The HTML5 advantages • Identical QlikView experience on mobile devices • You will not receive a mobile QlikView report, but a complete and comprehensive Business Discovery experience. • Secure system since the data is stored on the server and not on the device • All supported platforms: Apple, Android, Blackberry 206 QlikView
  • 207.
    User Features QlikView Inmobile devices: Optimized for small devices • Grid Visualisation • Interactivity with graphics in full screen • Swipe to switch between different graphics 207 QlikView
  • 208.
    User Features Qlik Market:Find an infinite number of extensions for the products of the Qlik family grouped by the following categories: • Best rated • Recent • Most downloaded 208 QlikView
  • 209.
    Qlik Sense DashboardExample QlikView User Features 209 QlikView
  • 210.
  • 211.
    QlikView 211 Key Features –Access & Data Connection Connect to Data Archive • Possibility to configure lit as data source. For example: Excel, CSV, XML, Text. QlikView includes a wizard to import files of type: delimited, fixed length, Excel xls and xlsx, html, xml ... that allows to visualize the content and adjust parameters such as the delimiter or the existence of headers Databases • Connections to databases. For example: Oracle, SQL Server, MySQL, PostgreSQL, Teradata, IBM DB2, etc. From QlikView and Qlik Sense we can connect through ODBC, OLE DB type connections to all the databases for which there are these standards of connection to database, in practice they are the majority (SQL Server, MySQL, Oracle, PostgreSQL, Teradata, IBM DB2, Vertica). Files SAS • Reading SAS7BDAT of SAS files Through an ODBC connection we can connect directly to SAS libraries and obtain data. Cloud / Big Dates • Possibility to connect Big Data or Cloud environments, such as Hadoop, Spark, Microsoft Azure, etc. There are some external JDBC connectors in the Qlik Market, tailored to connect to sources: Hive, Hbase, Cassandra, Amazon Redshift, Neo4J, MongoDB, HP Vertica, Cloudera Impala, Google Cloud SQL, FoxPro, etc. QlikView
  • 212.
    QlikView 212 Key Features –Access & Data Connection Connect to Data Cubes OLAP • Connection to cubes OLAP Desta Tool (QlikView) using the standard OLE DB will be able to make surgeries MDX to cubes of Analysis Services. Also they exist external connectors like TM1Qonnect that allows us connect us to cubes of Cognos TM1 and import the security and the metadatos. Other Services • In addition to the origins of data already mentioned, possibility of connection to other surroundings eat: web pages, Social nets, repositories of code, CRMs (Salesforce, Microsoft Dynamics, etc), Google Analytics It exists a native connector to Salesforce designated Qlik for Salesforce.com that provides a transparent and intuitive access to the objects of Salesforce ( Accounts, personalised fields..) . Regarding Google Analytics exist connectors and staff of pictures of controls to import directly from the tool and visualise the statistics of our different portals web. Off-line way • Availability to have data in memory for agility in time of response • Possibility to consult data without connection QlikView allows you to work offline by using qvw files that include data along with documents that can include dashboards in one or more. There are also qvd and qvx files that allow us to save only data. Qvd files allow incremental loading and are recommended by the manufacturer QlikView
  • 213.
    QlikView 213 Key Features –Access & Data Connection Transformation/Data Modeling Interface of development • The development and modeling will be simple and, will not require the end user of advanced programming knowledge. It will also provide an interface for its development, either via the web or, through a desktop application One of the main assets of QlikView is that it allows us to discover and visualize the data autonomously, which allows our intuition to go ahead. From the desktop development tool we can develop our dashboards and reports without the need for programming knowledge Combination of different origins of data • Possibility to combine several data sources. QlikView automatically connects the data sources using the name of the columns. From the Script Editor we import any data source and if necessary, aliases will be included so that the column names are coincident. • Join sources of different sources • Join sources of different sources with different columns names QlikView
  • 214.
    QlikView 214 Key Features –Access & Data Connection Integration Personalised portal • Possibility of integration with an external portal (Liferay, Sharepoint, etc) There is the possibility to connect and extract data from both Liferay and Sharepoint, but within these there is no predefined clear integration with QlikView documents. QlikView
  • 215.
    QlikView 215 Visualisations Tendencies/ Reference • Possibility tovisualize or generate trend lines in a simple way, allowing the configuration of these (average, linear, etc.) and, reference lines (markers), with different customization options.. QlikView Includes by defect the possibility to add to the original data the following lines of tendency: • Average • Linear • Polynomials of 2º, 3º and 4º degree • Exponential It also allows us to visualize the equation of the previous lines and the value of R2 (coefficient of determination) is the% of variability that is explained by the linear equation that we have. And this goes from 0 to 1. 1 when the model explains all reality. Charts • Possibility to give format/configure the charts • Types of advanced charts : bubbles, maps of heat, Gantt, waterfall, funnel, etc. We will be able in QlikView and Qlik Sense to easily change the following properties referring to the graphics: appearance, orientation, colors, titles, arrangement, font type ... QlikView includes predefined a wide type of graphics (bars, lines, pie, funnel, dispersion, speedometers, blocks, mekko, radar), selectors and dynamic tables. Key Features – Explores & Discovers QlikView
  • 216.
    QlikView 216 Analytical functionality Formulas •Possibility of incorporating new variables from custom calculations / formulas • Existence of predefined functions. Functions for the calculation of% growth, trends, inclusion of financial functions, temporary functions, etc. ns, etc. There is an expression editor within the tool to generate new columns based on existing ones. From this editor we select the fields to perform the formula and the aggregation function (Sum, Average, Fashion, Maximum, Minimum, Total Counter, Null Counter ...). In an extra tab we will find a wide range of predefined functions grouped within the following Categories: • Aggregation • Chain • Date and Hour • Financial • Logical Forecasting • It allows to make predictions based on predefined algorithms Functionality no available in QlikView Key Features – Explores & Discovers QlikView
  • 217.
    QlikView 217 Analytical functionality Statistical tools/dates mining • Integrationwith external tools that allow to add predictive functionalities (R, Weka, Python) To run Python from Qlikview it is necessary to add 2 libraries to Python (win32com and Pythoncom). Once configured these libraries from the Module Editor of the tool using a Visual Basic script we use the function defined in Python. ATK R Connector for QlikView is a connector developed by an external company that allows the incorporation of prediction capabilities thanks to the use of neural networks and econometric models provided by R libraries. It dates Discovery • Interactivity between the graphics and the rest of the components. As the user selects certain parts of the dashboard, the graphics will be updated accordingly. This is one of the strengths of QlikView since associative technology is used in memory so that all associations between all analyzed fields are automatically maintained. By default, any selection in a graphic, drop-down or element of our Scorecard will be reflected in all the components of our document Key Features – Explores & Discovers QlikView
  • 218.
    QlikView 218 Multiplataforma Mobile platforms • Availability inthe different mobile platforms: Android, iOS, Windows Phone • The mobile version of the tool, caters to the user of functionalities of compartición/collaboration with other users QlikView is a multiplatform tool in which we can access the server via web browser. From the server we will access the Access Point where we will see the different documents that we have available for our user. There is also QlikView for iOS, this application available in the Apple App Store, complements access to previously connected QlikView. The application offers a native user experience for the QlikView AccessPoint portal, while extending and improving QlikView's HTML5 capabilities for analytical applications. With QlikView for iOS, there is no difference between functionality with or without connection, the user has a true Business Discovery in both ways. Qlik Sense s mobile by nature (it is not necessary to download any application) and was created from the beginning to offer a fully analytical functionality on all devices. There are no differences between the mobile version and the desktop version. Qlik Sense includes the following key capabilities for mobility • Mobile analysis without restrictions • Creation in any place • User interfac based in gestures • Responsive Design • Small devices look and feel Key Features – Explores & Discovers QlikView
  • 219.
    QlikView 219 Social capacities andof collaboration Alerts and notifications • Possibility of receiving alerts or notifications. It must be reported, for example, when a pre-configured threshold has been exceeded. There is an alert editor (Tools> Alerts) that will be executed when opening a document or when reloading the information and in which we can configure: • Condition: Expression that has to evaluate to true or dud to shoot the alarm • Description: Title that describes us the operation of the alarm • Message: Body of message for the alarm • Receptors of Post: List of emails receptors of the notice Export • Export graphics / dashboard PDF, PNG • Export values ​​to CSV, XLS / XLSX • Share dashboard with other users without needing them to access the data sources. The data will be packaged / included within the Dashboard itself. • The tool allows you to export the data sources, so that they can be loaded later In a graphic we will be able to send your values ​​to Excel format and its content (data) to QlikView's own formats (.qvo and .qvd), csv, txt, html and also in image formats (JPG, BMP, PNG and GIF) ). At the level of the control panel we can export a capture of the same in the previously mentioned image formats and the design of the document to use it as a template in future work. In Qlikview the document export format is the .qvw, this will be the extension of our work and it includes everything (data, reports, graphics, scripts, data model and connections). Key Features – Share & Collaborate QlikView
  • 220.
    QlikView 220 Social capacities andof collaboration Planificador Distribution • Delivery of reports/dashboards via mail From the QlikView NPrinting report generation tool it is possible to distribute reports to users using a wizard in which the following steps are performed: 1. Define a task of report and configure it (name, description, connection, folder allocate..) 2. Select reports 3. Add Addressees of the reports 4. Add Filters 5. Program the task Key Features – Share & Collaborate QlikView
  • 221.
    QlikView 221 Security & Administration Security• Integration security via JDBC • Integration with application servers • Integration with third authentication services (CAS, LDAP, AD, etc) QliKView Can not deploy in IBM Websphere and needs any of the following servers web (see requests): • QlikView Web server • Microsoft IIS 6, 7, 7.5, 8 or 8.5 QliKView Is NOT compatible with IBM Tivoli Access Manager becuase his security only can be integrated with (see requests): • Microsoft Actuate Directory • Microsoft NTLM Key Features – Administration QlikView
  • 222.
    QlikView 222 Security & Administration Security• Permits at the level of Report / Dashboard and data level permissions In QlikView you can configure a security mechanism in two different ways: It can be embedded in the QlikView document script, or it can be configured by using QlikView Publisher. To apply security we must load the IDUSER, PASSWORD, SERIES, NTNAME (user or group name corresponding to a Windows NT domain), OMIT (Contains a list of unauthorized fields and therefore should be omitted for this specific user). You can use external authentication services by mapping using the previous fields, for example using NTNAME as the Active Directory group, NTNAME = DOMAIN AD_GROUP_1. • At the sheet level in a document we can allow or restrict the following tasks from Sheet Properties Security: Add Sheet Objects, Delete Sheet Objects, Copy / Clone Sheet Objects, Access Sheet Object Properties, Delete Sheet. • We can also play with the visibility of a sheet in Sheet Properties General there is a Show Sheet section (Always or Conditional) Key Features – Administration QlikView
  • 223.
    QlikView 223 Security & Administration Rolesof user/group • Possibility of establishing roles for users / groups • Application of Statistical Secrecy (LOPD). Hiding sensitive information. mation. To complement the security view information it is recommended to visualize this whitepaper that includes a view of the architecture at the security level and where the roles / users and the permissions at file level are managed. The tool does not directly include functionality to hide sensitive information and apply the statistical system. There is a possibility that it would be the encryption of those sensitive fields using CryptoJS cryptographic algorithms. Key Features – Administration QlikView
  • 224.
    QlikView 224 Installation & Implementation Citrix• Possibility of development in virtualized servers (Citrix MetaFrame, XenApp) On PCs with low performance it is possible to connect to external virtualized Citrix servers and develop (use of QlikView Desktop) on these. Although possible, this option is not recommended for QlikView Server since it can be managed from the web console remotely. Key Features – Administration QlikView
  • 225.
    QlikView 225 Installation & Implementation Volumetry• Capacity of work with high data volumes QlikView stores the information in memory and uses data compression algorithms based on columns (reduce to 10% the original 50 GB size would be 5GB). 1 million rows for the treatment column (Mr., Ms., Ms.) will take up much less memory than a column in which you save the phone number. To recharge a QlikView document, the script is executed and it recharges the information in memory. There is a formula to calculate the necessary memory based on the concurrent users: RAM = (User RAM × Number of concurrent users) + Initial RAM Initial RAM = QVW tam. on disk × File size multiplier; Minimum initial RAM for 1 application User RAM = initial RAM × userRAMratio; RAM consumed by each incremental user QVW size on disk = Original Data × (1-Ratio of Compression); Size on disk QlikView file Example: Original data = 50GB, Compression ratio = 90%, File size multiplier = 4, UserRamratio = 5%, Number of concurrent users = 30. QVW disk size = 50GB x (1-0.9) = 5GB Initial RAM = 5 GB x 4 = 20 GB User RAM = 20GB x 5% = 1GB RAM = (1GB x 30) +20 GB = 50GB required to have 30 concurrent users and 50 GB of information Key Features – Administration QlikView
  • 226.
  • 227.
    Tool Review QlikView 227 Section QlikView Access45,0 Connect to Data 58,2 Transformation/Data Modeling 46,0 Integration 34,5 Analytical functionality 49,8 Dashboards Creation 33,4 Reports 48,0 Visualisations 64,0 Multiplataforma 36,0 Analysis of stages 18,0 Social capacities and of collaboration 40,0 Important content 22,5 Security & Administration 32,0 Installation & Implementation 44,7 Pricing 48,0 Multilenguaje 28,0 Total 648,1 QlikView
  • 228.
  • 229.
    Index Introduction Architecture Technical Review User Features KeyFeatures Tool Review Amazon QuickSightAmazon QuickSight 229
  • 230.
  • 231.
    Introduction Amazon QuickSight Its mottois to provide business intelligence very fast, easy to use and managed in the cloud for a tenth of the cost of traditional business intelligence solutions. 100% cloud tool under the AWS infrastructure. It is a tool in private Beta phase so it has not been possible to prove and of which there is a scarce documentation, One of his slogans is that we will be able to create our first analysis in 60 seconds. Amazon QuickSight 231
  • 232.
  • 233.
    Architecture QuickSight Is aweb BI tool 100% oriented to final user Amazon QuickSightAmazon QuickSight 233
  • 234.
    Architecture Tools of recolecciónof data Tools of storage Tools of analysis Amazon QuickSightAmazon QuickSight 234
  • 235.
  • 236.
    Technical Review Amazon QuickSight Uploadfiles or connect to AWS data services Easily connect Amazon QuickSight to AWS data services, including Amazon Redshift, Amazon RDS, Amazon Aurora, Amazon EMR, Amazon DynamoDB, Amazon S3 and Amazon Kinesis; Upload CSV, TSV and spreadsheets files or connect to third-party data sources, such as Salesforce. Amazon QuickSight 236
  • 237.
    Technical Review Amazon QuickSight Performance AmazonQuickSight uses SPICE – a superfast, parallel, memory-optimized calculation engine compiled from scratch to generate responses on large datasets. SPICE: Engine of calculation in parallel memory ultrarrápido Amazon QuickSight 237
  • 238.
    Amazon QuickSight Memory engine,parallel and super fast ("SPICE") Created from scratch for the cloud, Amazon QuickSight's memory, parallel, and super-fast computing engine ("SPICE") uses a combination of memory storage technologies in columns enabled through the latest hardware innovations, machine code generation and data compression to allow users to execute interactive queries on large datasets and get quick responses. SPICE supports rich calculations that help customers obtain valuable information from their their analyzes, so they never have to worry about provisioning or managing the infrastructure. SPICE automatically replicates the data to provide high availability and, in addition, enables QuickSight to scale thousands of users who can perform rapid interactive analyzes at a time on a wide variety of AWS data sources. Technical Review Amazon QuickSight 238
  • 239.
    Amazon QuickSight Use BIsolutions from AWS partners with Amazon QuickSight Amazon QuickSight offers partners a simple SQL-like interface to query data stored in This allows customers to continue to use the existing business intelligence tools of AWS business intelligence partners and benefit from the faster performance delivered by SPICE. Technical Review Amazon QuickSight 239
  • 240.
  • 241.
    User Features Amazon QuickSight Easyto use. Smart graphics are dynamically optimized for data. Amazon QuickSight automatically derives data types and relationships, and offers suggestions on the best possible visualizations (optimized for data) to help you get useful and fast business information. Visualise in minutesPoint to a data source Amazon QuickSight 241
  • 242.
    Amazon QuickSight Ease ofuse. The intelligent charts optimise of dynamic way for the data. Amazon QuickSight deduces automatically the types of data and the relations, and offers suggestions on the best possible visualisations (optimised for the data) with the end to help him to obtain useful business information and fast. User Features Amazon QuickSight 242
  • 243.
    User Features Amazon QuickSight Shareand collaborate Amazon QuickSight allows you to share business information easily by grouping it into interactive stories that can be shared with others. With the Amazon QuickSight whiteboard feature, you can combine visualizations on business panels, add comments and share them securely with a user or with large groups of users in the organization. Amazon QuickSight 243
  • 244.
    User Features Amazon QuickSight Nativeaccess in the main mobile platforms You can access Amazon QuickSight data using native apps for iPad, iPhone, and Android tablets and phones. You can also control the availability of analyzes, stories, and panels for offline viewing, as well as create offline annotations, so that they synchronize when the device reconnects to the Internet. Amazon QuickSight 244
  • 245.
  • 246.
    Amazon QuickSightAmazon QuickSight 246 Connectto Data Archive • Possibility to configure files as data source. For example: Excel, CSV, XML, Text. QuickSight allows to read text structured files. Databases • Connections to databases. For example: SQL Server, MySQL, PostgreSQL, Teradata, IBM DB2, etc. This tool does not allow you to connect to databases external to Amazon Services Key Features – Access & Data Connection
  • 247.
    Amazon QuickSightAmazon QuickSight 247 KeyFeatures – Access & Data Connection Transformation/Data Modeling Interface of development • The development and modeling will be simple and, will not require the end user of advanced programming knowledge. In addition, an interface for its development will be provided, either via the web or through a desktop application. Amazon QuickSight automatically infers the data types and relationships in its simple interface of web development, and offers tips on the best possible displays (optimized for data) in order to help you obtain information business quick and useful. Smart graphics are optimized for data dynamically. Combination of different origins of data • Possibility to combine several data sources. QuickSight allows to combine pertinent data of : • Archives of text • Databases • Amazon Elastic MapReduce • Amazon Kinesis • Amazon S3 • Amazon Redshift • Amazon DynamoDB
  • 248.
    Amazon QuickSightAmazon QuickSight 248 Visualisations Charts• Possibility of formatting / configuring the graphics • Types of advanced graphics: bubbles, heat maps, Gantt, waterfall, funnel, etc. One of the most interesting features of Amazon QuickSight is that it suggests the type of graphic we should choose for our input data. QuickSight has a reduced set of graphics: • Bar graphic • Boards • Scatter plot • Lines graphics • Pie Graphics • Heat maps Within the graphics the possibilities of configuration and format are limited. Amazon QuickSight does not have maps or waterfall or funnel Key Features – Explores & Discovers
  • 249.
    Amazon QuickSightAmazon QuickSight 249 Analyticalfunctionality It dates Discovery • Interactivity between the graphics and the rest of the components. As the user selects certain parts of the dashboard, the graphics will be updated as appropriate First steps. Start quickly since you only have to log in, point to a data source and create the first display in minutes. Log in to QuickSight and point to a data source or upload a file to start visualizing the data with useful information in just over a minute. Key Features – Explores & Discovers
  • 250.
    Amazon QuickSightAmazon QuickSight 250 Multiplataforma Mobile platforms •Availability in the different mobile platforms: Android, iOS, Windows Phone • The mobile version of the tool, provides the user with sharing / collaboration features with other users. You can access Amazon QuickSight data using native apps for iPad, iPhone, and Android tablets and phones. You can also control the availability of analyzes, stories, and panels for offline viewing, as well as create offline annotations, so that they synchronize when the device reconnects to the Internet. Key Features – Explores & Discovers
  • 251.
    Amazon QuickSightAmazon QuickSight 251 Security& Administration Security • Integration security via JDBC • Integrationwith application server QuickSight does not allow the deployment neither integration with any of these tools. Key Features – Administration
  • 252.
    Amazon QuickSightAmazon QuickSight 252 Installation& Implementation Citrix • Possibility of development in virtualized servers (Citrix MetaFrame, XenApp) It does not allow working in virtualized servers since it is a 100% cloud tool Volumetry Working capacity with large data volumes Through the use of the SPICE parallel, super-fast, memory-based calculation engine, Amazon QuickSight uses a combination of memory-enabled, columnar storage technologies through the latest hardware innovations, machine code generation, and data compression to enable Users run interactive queries on large data sets and get quick responses. SPICE automatically replicates the data to provide high availability and, in addition, enables QuickSight to scale thousands of users who can perform rapid interactive analyzes at a time on a wide variety of AWS data sources. Key Features – Administration
  • 253.
  • 254.
    Tool Review Amazon QuickSight 254 SectionAmazon QuickSight Access 54,0 Connect to Data 21,6 Transformation/Data Modeling 32,0 Integration 3,0 Analytical functionality 16,6 Dashboards Creation 17,1 Reports 0,0 Visualizations 48,0 Multiplatform 24,0 Analysis of stages 0,0 Social capacities and of collaboration 23,0 Important content 4,5 Security & Administration 5,3 Installation & Implementation 34,7 Pricing 72,0 Multilenguaje 32,0 Total 387,8
  • 255.
  • 256.
  • 257.
    Introduction BI Suite developedunder the philosophy of open source Developed on Java, it makes Pentaho a very flexible and multiplatform solution. Within this analytical solution, solutions are available to perform ETLs, reporting, both interactive and pixel-perfect, OLAP web viewers and other tools. 257 Pentaho
  • 258.
  • 259.
    Architecture Pentaho Pentaho is distributedin 3 levels: Light Clients Server Desktop Tools 259 Pentaho
  • 260.
    Architecture Pentaho In turn, thearchitecture of Pentaho, consists of several layers Data layer: used to connect to any data source. 260 Pentaho
  • 261.
    Architecture Pentaho Server layer: intermediatelayer within the architecture, the application "runs" on the server and acts as an intermediate layer. Here, we have: BA Server, Pentaho User Console and Pentaho Data Integration Server. BA Server: Main container where to publish the dashboards and reports that develop, so that, later are accessible by the users. Pentaho User Console: It allows us to establish the security level of users / roles and defines which content to see in function of the roles to which belongs. Pentaho Dates Integration Server: it allows to administer and program the works ETL. 261 Pentaho
  • 262.
    Architecture Pentaho Client Layer: basedon two main types: Thin Client: it runs on the server and, among others, we could have applications for the creation of dashboards with the Community Dashboard Editor or, tools to exploit the information underlying the system through the OLAP web viewers. Thick Client: represents the applications that do not run within the Pentaho environment but do have full interactivity with it, allowing you to publish works developed with these applications. Some of these applications are: Pentaho Data Integration, Pentaho Report Designer or Schema Workbench. 262 Pentaho
  • 263.
  • 264.
    Pentaho is anopen platform, which incorporates the main tools of the Open Source market. It has a large development community that allows the platform to improve and expand constantly. It is a standards-based Web solution that supports a large set of databases and is integratable with other tools through Web services. Technical Review Pentaho 264 Pentaho
  • 265.
    Pentaho offers onits platform a wide variety of connectors to Big Data sources, as well as components and tools, to perform an effective processing of data from them. Technical Review Pentaho 265 Pentaho
  • 266.
  • 267.
    OLAP web viewer OLAPdrag & drop viewer with geographic capabilities. Ability to perform calculations "on the fly", formula editor and many other new features.Finder web OLAP 267 Pentaho User Features
  • 268.
    User Features Interactive Reporting Webtool that allows the creation of tabular drag & drop reports It allows to include filters, sections and export to several formats (Excel, PDF, etc) 268 Pentaho
  • 269.
    Dashboards Possibility of creatingattractive dashboards in a few minutes 269 Pentaho User Features
  • 270.
    Scorecards Tool to manageScorecards, being able to: edit objectives, indicators, export results, etc. 270 Pentaho User Features
  • 271.
    User Features Pentaho Mobile:allows access to the platform from all types of mobile devices 271 Pentaho
  • 272.
    User Features Pentaho DatesIntegration: Visual ETL tool that connects to all kinds of bases: databases (JDBC, ODBC), Big Data sources (Hadoop, NoSQL), OLAP cubes, text files, ERPs, Google Analytics, Salesforce, Web Services 272 Pentaho
  • 273.
    User Features Pentaho ReportDesigner: Desktop tool for the creation of pixel-perfect static reports. It allows us to add filters and export the reports to the usual work formats. 273 Pentaho
  • 274.
  • 275.
    275 Key Features –Access & Data Connection Connect to Data Archive • Possibility to configure files as data source. For example: Excel, CSV, XML, Text. Through the integration tool included in the Pentaho platform, it is possible to connect to a wide variety of files (see column with Input value in the link: Pentaho-Data-Integration-Steps). Some of the possibilities are: csv files, flat text files, JSON files, XML files or Excel files. In addition, certain actions can be specified on the files to which it is connected, such as: range of rows to read, Excel tabs on which to process the information or file coding. There is also a plugin available in PDI and in the BA Server user console (Agile BI) to read csv data sources and integrate them into the platform. Databases • Connections to databases. For example: Oracle, SQL Server, MySQL, PostgreSQL, Teradata, IBM DB2, etc. As for the connection against databases, we have several tools that can undertake this purpose, among them: Pentaho Report Designer, BA Server, Pentaho Data Integration, Schema Workbench. The main databases to which it will be possible to connect are: Oracle, MySQL, PostgreSQL, Teradata, SQL Server or MS Access.. Pentaho
  • 276.
    276 Key Features –Access & Data Connection Connect to Data Files SAS • Reading the SAS7BDAT of SAS files One of the input steps present within Pentaho Data Integration gives the possibility to read sas7bdat files (see SAS-Input). There are certain limitations when using this step within the tool: all the files that are read for each copy of the step, must have the same format (same number of columns, with the same names and types) and, for data of numerical type with NaN values, they will be automatically converted to null. Cloud / Big Dates • Possibility to connect to Big Data or Cloud environments, such as Hadoop, Spark, Microsoft Azure, etc. Within the integration tool, Pentaho Data Integration, there is a wide variety of connectors for communication with Big Data sources. Among the main ones, it has the ability to connect to tools in the Hadoop environment, such as Cloudera, Hortonworks or Spark, connections to NoSQL databases such as MongoDB, Hbase or Cassandra. (You can see the complete list of steps that connect with Big data data sources in Pentaho-Data-Integration-Steps, where the category column has the Big Data value) Pentaho
  • 277.
    277 Key Features –Access & Data Connection Connect to Data Cubes OLAP • Connection to OLAP cubes The connection to OLAP cubes can be done through the integration tool, thanks to the steps Mondrian Input (see Mondrian-Input) and OLAP Input for cubes of MSAS (see OLAP-Input). From the reporting tool, Pentaho Report Designer (see use-analysis-cubes-in-report-designer), there will also be the possibility of creating reports from data coming from OLAP cubes. Similarly, within the BA Server, the dashboards created in the Dashboard Designer can include data from views created in the OLAP viewer - Saiku or JPivot. In the case of the Pentaho platform, the OLAP server used is Mondrian (see mondrian). Other Services • In addition to the aforementioned data sources, the possibility of connecting to other environments such as: web pages, social networks, code repositories, CRMs (Salesforce, Microsoft Dynamics, etc.), Google Analytics In Pentaho Data Integration there is the possibility of connecting to other data sources that are not so usual. Within this group, we have steps for the connection with Open ERP (see OpenERP-Object-Delete, OpenERP-Object-Input and OpenERP-Object-Output), the connection with web analytics services, such as Google Analytics (Google-Analytics ), tools in the cloud, such as Google Docs, CRMs such as Salesforce (SalesForce-Input, Salesforce-Delete, Salesforce-Insert, Salesforce-Update and Salesforce- Upsert) or integration with middleware such as IBM Websphere (IBM-Websphere-MQ- Consumer, IBM- Websphere-MQ-Producer). Pentaho
  • 278.
    278 Key Features –Access & Data Connection Connect to Data Off-line way • Availability of having data in memory for agility in response time • Possibility to consult data without connectionn Regarding the possibility of consulting data without connection, within Pentaho, no mechanism is offered to obtain this purpose. As for having data in memory that speeds up the times, yes. By default, the Mondrian analysis engine does not include any caching components, but it does include the possibility of including third-party caching systems. The Enterprise version, has by default configured the distributed cache of JBoss Infinispan. Other possibilities would be: Memcached and Pentaho Platform Delegating Cache (see mondrian-cache- control). Pentaho
  • 279.
    279 Key Features –Access & Data Connection Transformation/Data Modeling Interface of development • The development and modeling will be simple and, will not require the end user of advanced programming knowledge. It will also provide an interface for its development, either via the web or, through a desktop application In the architecture we saw that the client layer was subdivided into two main types: Thin Client and Thick Client. In both cases, independently of being an application executed directly on the server or, being a desktop tool, the development and modeling will require certain knowledge at the data level and, in the tools more related to the visualization part, it could require certain knowledge in Web programming.. Combination of different origins of data • Combination of different data sources With Pentaho Data Integration, one of the most powerful ETL tools on the market is available. With this, we can combine different data sources. To do this, you simply have to use the steps that the tool brings, for example: we could have a Table Input, which brings information from a database, Oracle for example, a CSV file Input, that reads records from a file and , later a Merge Join or other union components could be used to cross the data flows by the common column or columns that had those data sources. Pentaho
  • 280.
    280 Key Features –Access & Data Connection Integration Personalised portal • Possibility of integration in an external portal (Liferay, Sharepoint, etc) When we develop visualizations within the BA Server, these allow then to be embedded in other portals, since they are accessible under a specific URL. So, if you wanted to include Pentaho content, for example in Liferay, this could be done without problems since, each display responds to a URL. Obviously, it would be necessary to manage the authentication mode, perhaps through a Single Sign On mechanism, since in order to be able to visualize said contents, it must first be authenticated within the Pentaho platform. Pentaho
  • 281.
    281 Visualisations Charts • Possibilityof formatting / configuring the graphics • Types of advanced graphics: bubbles, heat maps, gantt, waterfall, funnel, etc. In Pentaho Report Designer, we have the possibility to create reports with a high level of detail. Regarding graphics, different types of graphics can be included, such as bar charts, series charts, areas, sectors, thermometers, waterfalls, etc. These can be highly customizable, both in appearance and behavior. Community Dashboard Editor, the tool for the development of dashboards allows us to include a wide spectrum of graphics, maps and OLAP views on which we can modify numerous options of format and style (see ccc-charts). Tendencies/ References Possibility to visualize or generate trend lines in a simple way, allowing the configuration of these (average, linear, etc.) and, reference lines (markers), with different customization options. In the case of Community Dashboard Editor dashboards, it is also possible to show trend lines and it will also be possible to perform certain configurations on them: select type, color, show underlying area, etc. Among the types of selectable trend lines are: linear, moving-average or weighted-moving-average(see types-trend-lines). Key Features – Explores & Discovers Pentaho
  • 282.
    282 Analytical functionality Formulas •Possibility of incorporating new variables from custom calculations / formulas • Existence of predefined functions. Functions for the calculation of% growth, trends, inclusion of financial functions, temporary functions, etc. New variables can be incorporated from calculations / formulas in the OLAP viewers present in the Community version of Pentaho. To do this, the definition of these variables must be specified directly in the MDX language. As for the existence of predefined functions, we could extend the functionality of our visualizations and calculations through the power of the MDX language. As we already know, Pentaho uses OLAP Mondrian server. He is able to interpret this language, so we could make use of the extensive list of present functions to create more complex calculations (see documentation-mdx). Forecasting • It allows to make predictions in base to predefined algorithms Pentaho Dates Integration includes a plugin from which can make tasks of predictive analysis using the algorithm of WEKA TimeSeries Forecasting. Also it includes a step designated WEKA Forecasting that allows us use the .model , with models of minería created by WEKA. Key Features – Explores & Discovers Pentaho
  • 283.
    283 Analytical functionality Statistical tools/dates mining • Integrationwith external tools that allow to add functionalities predicitivas (R, Weka, Python) Weka is the mining tool that Pentaho integrates into its suite. A: There is the possibility to run R scripts from a Pentaho Data Integration step Pentaho recently announced a native integration with Python (see newsletter). (see bulletin). It dates Discovery • Interactivity between the graphics and the rest of the components. As the user selects certain parts of the Dashboard, the graphics will be updated accordingly When checking the data through analytical reports through the OLAP viewers within the Pentaho environment, the visualizations included in them, have a certain degree of interactivity, being able to change the type of graph, select subsets of data or filter in a simple way. Community Dashboard Editor allows, down to the level of code, the interaction between graphics, tables, selectors and other elements that we include in dashboards made. Key Features – Explores & Discovers Pentaho
  • 284.
    284 Analytical functionality Integration with Maps •Possibility to show data in maps of a simple way. The maps will be able to integrate through: country, city, postal code, latitude & longitude • Interactivity of the map. Possibility of clicking on the locations shown on the map and that these modify the content of other components within the Dashboard / Panel • Heat maps. Possibility of establishing certain color intensities based on the underlying values. In the case of the integration of maps, Pentaho is more limited compared to other tools of the competition. However, Pentaho allows the integration in your dashboards, maps of Google Maps or any map application. These can be dynamic and interact with the rest of the components of the dashboard responding to certain events or actions. To achieve this, it would be necessary to rely on the events that originated within Pentaho, and coordinate them with the functionality of the selected map application. Key Features – Explores & Discovers Pentaho
  • 285.
    285 Multiplataforma Mobile platforms • Availability inthe different mobile platforms: Android, iOS, Windows Phone • The mobile version of the tool, provides the user with sharing / collaboration features with other users. Pentaho does not have official native applications. However, if you have an interface optimized for mobile devices, Pentaho Mobile, which allows access from all sizes of devices. In addition, as an example, dashboards designed with Community Dashboard Editor are responsive. Key Features – Explores & Discovers Pentaho
  • 286.
    286 Possibility of receivingalerts or notifications. It must be reported, for example, when a pre-configured threshold has been exceeded. Possibility of receiving alerts or notifications. It must be reported, for example, when a pre- configured threshold has been exceeded. • Possibility of receiving alerts or notifications. It must be reported, for example, when a pre-configured threshold has been exceeded. Pentaho has a large community behind it that makes the platform extend and improve quickly. One of the tools that helps to promote that this fact is fulfilled, is the Pentaho Marketplace, thanks to which, we can access a large number of plugins. Well, one of them is the Community Data Validation. It is a data validator that will periodically make a set of questions about our data and perform certain actions based on the answers to the questions given. (see http://www.webdetails.pt/ctools/cdv/#section=notifications). Key Features – Share & Collaborate Pentaho
  • 287.
    287 Social capacities andof collaboration Export • Export graphics / dashboard PDF, PNG • Export values ​​to CSV, XLS / XLSX • Share dashboard with other users without needing them to access the data sources. • The data will be packaged / included within the dashboard itself • The tool allows you to export the data sources, so that they can be loaded later When we run reports created with Pentaho Reporting from the Pentaho BA Server we will be able to export the reports in one of the following formats: PDF, HTML, CSV, Excel, RTF and Text. Also from the Pentaho Interactive Reporting we can export the tabular reports to the usual formats. In the Community Dashboard Editor there is the possibility to export to Excel the data of the graphics and also to image format the graphics thanks to the plugin CGG. Key Features – Share & Collaborate Pentaho
  • 288.
    288 Social capacities andof collaboration Planificador Distribution • Delivery of reports/dashboards via mail Within the Pentaho BA Server user console, located in the directory browser, if we position ourselves on Pentaho Reporting reports, we can access the available Schedule page through the File Actions panel.The steps to make to program the sending of reports are: • We chose the period of time. Something similar to what we would do with the CRON in Linux or the task scheduler in Windows. • It would also be necessary to select the types of files that should be taken into account for planning. To have the possibility of planning via email, it is necessary that the email server has been configured and enabled on the platform. • The planning would already be created • (See schedule-reports and set-up-an-email-server) Key Features – Share & Collaborate Pentaho
  • 289.
    289 Security & Administration Security• Security integration via JDBC • Integration with third-party authentication services (CAS, LDAP, AD, etc.) • The information is always shown based on the roles to which the users belong, limiting the information to be displayed when appropriate. • Permissions at the level of Report / Dashboard • Data level permissions • Application of Statistical Secrecy (LOPD). Hiding sensitive information • Integration in application servers The Pentaho security configuration can be done either via the platform or through external providers. In the first case, security would be achieved through the management of users / roles that Pentaho provides, allowing for the management of existing roles the permissions that will be available to users under them. In the case of security via external providers, we have several options: LDAP, Single Sign-On, Microsoft AD and also via JDBC. The Pentaho security configuration can be done either via the platform or through external providers. In the first case, security would be achieved through the management of users / roles that Pentaho provides, allowing for the management of existing roles the permissions that will be available to users under them. In the case of security via external providers, we have several options: LDAP, Single Sign-On, Microsoft AD and also via JDBC (see security-for-ba-server and date-access-object). Based on this basis, it is possible to achieve security at the report / dashboard level without problems. Data-level permissions can be achieved through layers of metadata between the views and the underlying data. With these, based on the users / roles that are authenticated, we could limit the data to be displayed in the views (see dynamic-schema-processor-modify-mondrian-schema-in-run-time, mondrian- access_control and Multi-Tenancy). Pentaho can be deployed in the most popular application servers such as: Jboss, Apache Tomcat, etc. Key Features – Administration Pentaho
  • 290.
    290 Security & Administration Rolesof user/group • Possibility to define roles for users/groups In the Pentaho platform, through the user console, roles and users can be managed. To do this, the user administrator, through the administration tab, can create users, roles and assign roles to users. By default, there are 4 different types of roles: Administrator, Business Analyst Role, Power User Role and Report Author Role. These, have a series of associated permissions (execution, reading, programming, etc.) that can be modified if desired, or create new roles with the permissions that are desired (see pentaho-security). Key Features – Administration Pentaho
  • 291.
    291 Installation & Implementation Citrix• Possibility of development on virtualized servers (Citrix MetaFrame, XenApp) Pentaho products work in virtualized environments when configured with the appropriate hardware and operating system. We would install the desired tool or tools and we could work with them in the virtual environment.. Key Features – Administration Pentaho
  • 292.
    292 Installation & Implementation Volumetry• Working capacity with large data volumes When dealing with large volumes of data, in Pentaho different approaches can be adopted to try to handle such a situation. At BA Server level, it is possible to configure a cluster of these so that, in association with a load balancer, the load is distributed evenly and we can have better response times. At the level of OLAP analysis, we have already seen in Access & Connection to Data, the different options that are allowed in Mondrian to optimize the use of the cache. At the level of data integration, with Pentaho Data Integration you have several options to handle large volumes of data. With this tool, in addition to having steps that allow you to connect and work with the main Big Data tools: Hadoop, Spark, Cassandra, MongoDB, etc., at the design level of the solution, several scenarios are proposed that adapt perfectly to the handling of quantities huge amounts of data. Within the tool, for this purpose, we can rely on the techniques of clustering and partitioning, which allow the load or data handling can be distributed through several nodes (performance-and-scalability and pdi- performance-tuning). Key Features – Administration Pentaho
  • 293.
  • 294.
    Tool Review 294 Section Pentaho Access45,0 Connect to Data 51,0 Transformation/ Data Modeling 44,0 Integration 58,5 Analytical functionality 50,8 Dashboards Creation 25,7 Reports 72,0 Visualisations 56,0 Multiplataforma 12,0 Analysis of stages 18,0 Social capacities and of collaboration 31,0 Important content 18,0 Security & Administration 55,3 Installation & Implementation 44,0 Pricing 72,0 Multilenguaje 36,0 Total 689,4 Pentaho
  • 295.
  • 296.
    Final Comparison –final scores Analysis Tools BI 296 666.4 601.0 679.2 648.1 387.8 703.8 689.4 0.0 100.0 200.0 300.0 400.0 500.0 600.0 700.0 800.0 TABLEAU POWER BI INFORMATION BUILDERS QLIKVIEW AMAZON QUICKSIGHT SAS ANALYTICS PENTAHO Tableau Power BI Information Builders Qlikview Amazon QuickSight SAS Analytics Pentaho
  • 297.
    Analysis Tools BI 297 FinalComparison – Detail final scores Section Tableau PowerBI Information Builders SAS QlikView Amazon QuickSight Pentaho Access 36,0 36,0 36,0 45,0 45,0 54,0 45,0 Connect to Data 58,2 46,8 52,8 64,8 58,2 21,6 51,0 Transformation /Data Modeling 50,0 46,0 38,0 48,0 46,0 32,0 44,0 Integration 34,5 34,5 48,0 58,5 34,5 3,0 58,5 Analytical functionality 63,2 59,3 53,6 60,0 49,8 16,6 50,8 Dashboards Creation 36,0 36,9 26,6 30,0 33,4 17,1 25,7 Reports 24,0 24,0 72,0 48,0 48,0 0,0 72,0 Visualisations 72,0 64,0 56,0 72,0 64,0 48,0 56,0 Multiplataforma 36,0 36,0 36,0 36,0 36,0 24,0 12,0 Analysis of stages 18,0 0,0 27,0 27,0 18,0 0,0 18,0 Social capacities and of collaboration 39,5 32,5 41,5 40,5 40,0 23,0 31,0 Important content 27,0 27,0 27,0 18,0 22,5 4,5 18,0 Security & Administration 39,3 20,7 58,0 52,7 32,0 5,3 55,3 Installation & Implementation 52,7 33,3 46,7 47,3 44,7 34,7 44,0 Pricing 48,0 72,0 24,0 24,0 48,0 72,0 72,0 Multilenguaje 32,0 32,0 36,0 32,0 28,0 32,0 36,0 Total 666,4 601,0 679,2 703,8 648,1 387,8 689,4
  • 298.
    Analysis Tools BI 298 FinalComparison – Detail final scores 0% 10% 20% 30% 40% 50% 60% 70% 80% 90% 100% Tableau Power BI Information Builders Qlikview Amazon QuickSight SAS Analytics Pentaho Acceso Transformación/Modelación Datos Integración Funcionalidad Analítica Creación Dashboards Informes Visualizaciones Análisis de escenarios Capacidades sociales y de colaboración Contenido Importante Seguridad & Administración Instalación & Implementación Multilenguaje Pricing
  • 299.
    Bigdata.stratebi.com info@stratebi.com www.stratebi.com Information Phone: + 34917883410 Madrid: Avenida de Brasil, 17 Barcelona: C/ Valencia, 63 Spain Contact

Editor's Notes

  • #132 Explorador is an easy-to-use interface that allows users to perform ad-hoc analysis, data discovery and visualizations. By dragging and dropping a combination of categories and measures onto a visualization pane, users can take advantage of intelligent auto-charting capabilities to visually understand and derive insight from massive amounts of data. Built-in hierarchy creation capabilities allow users to slice-and-dice information based on all of the data…without depending on IT.
  • #300 Referencias y Datos de Contacto