Download as PDF, PPTX
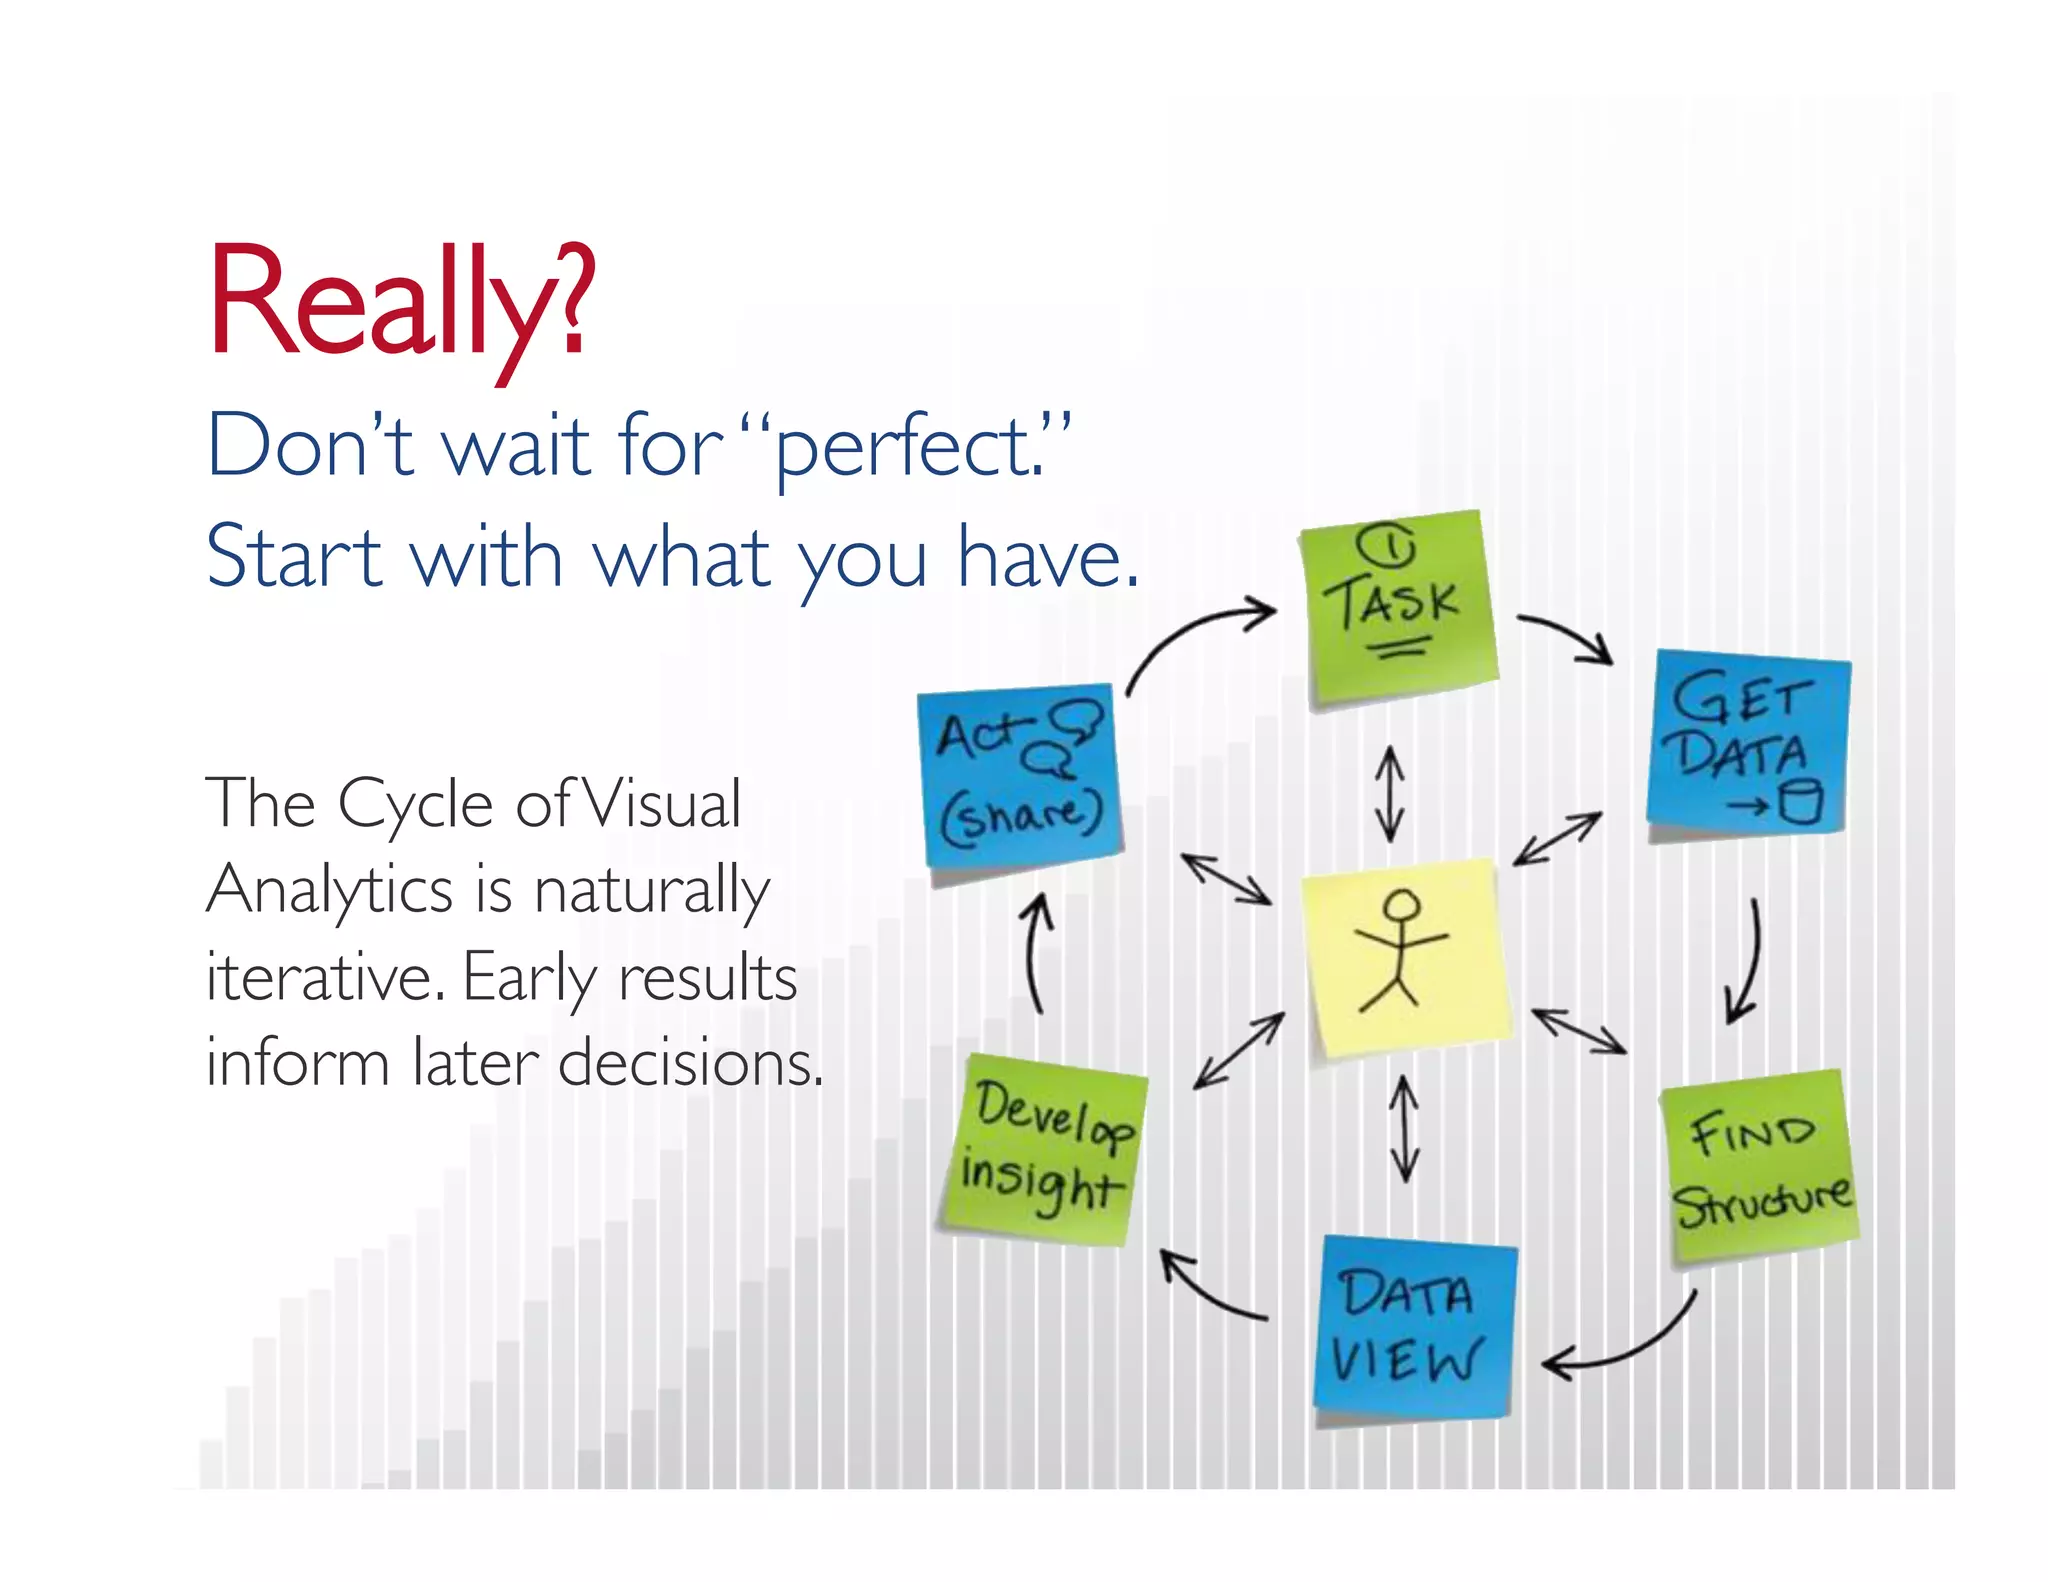
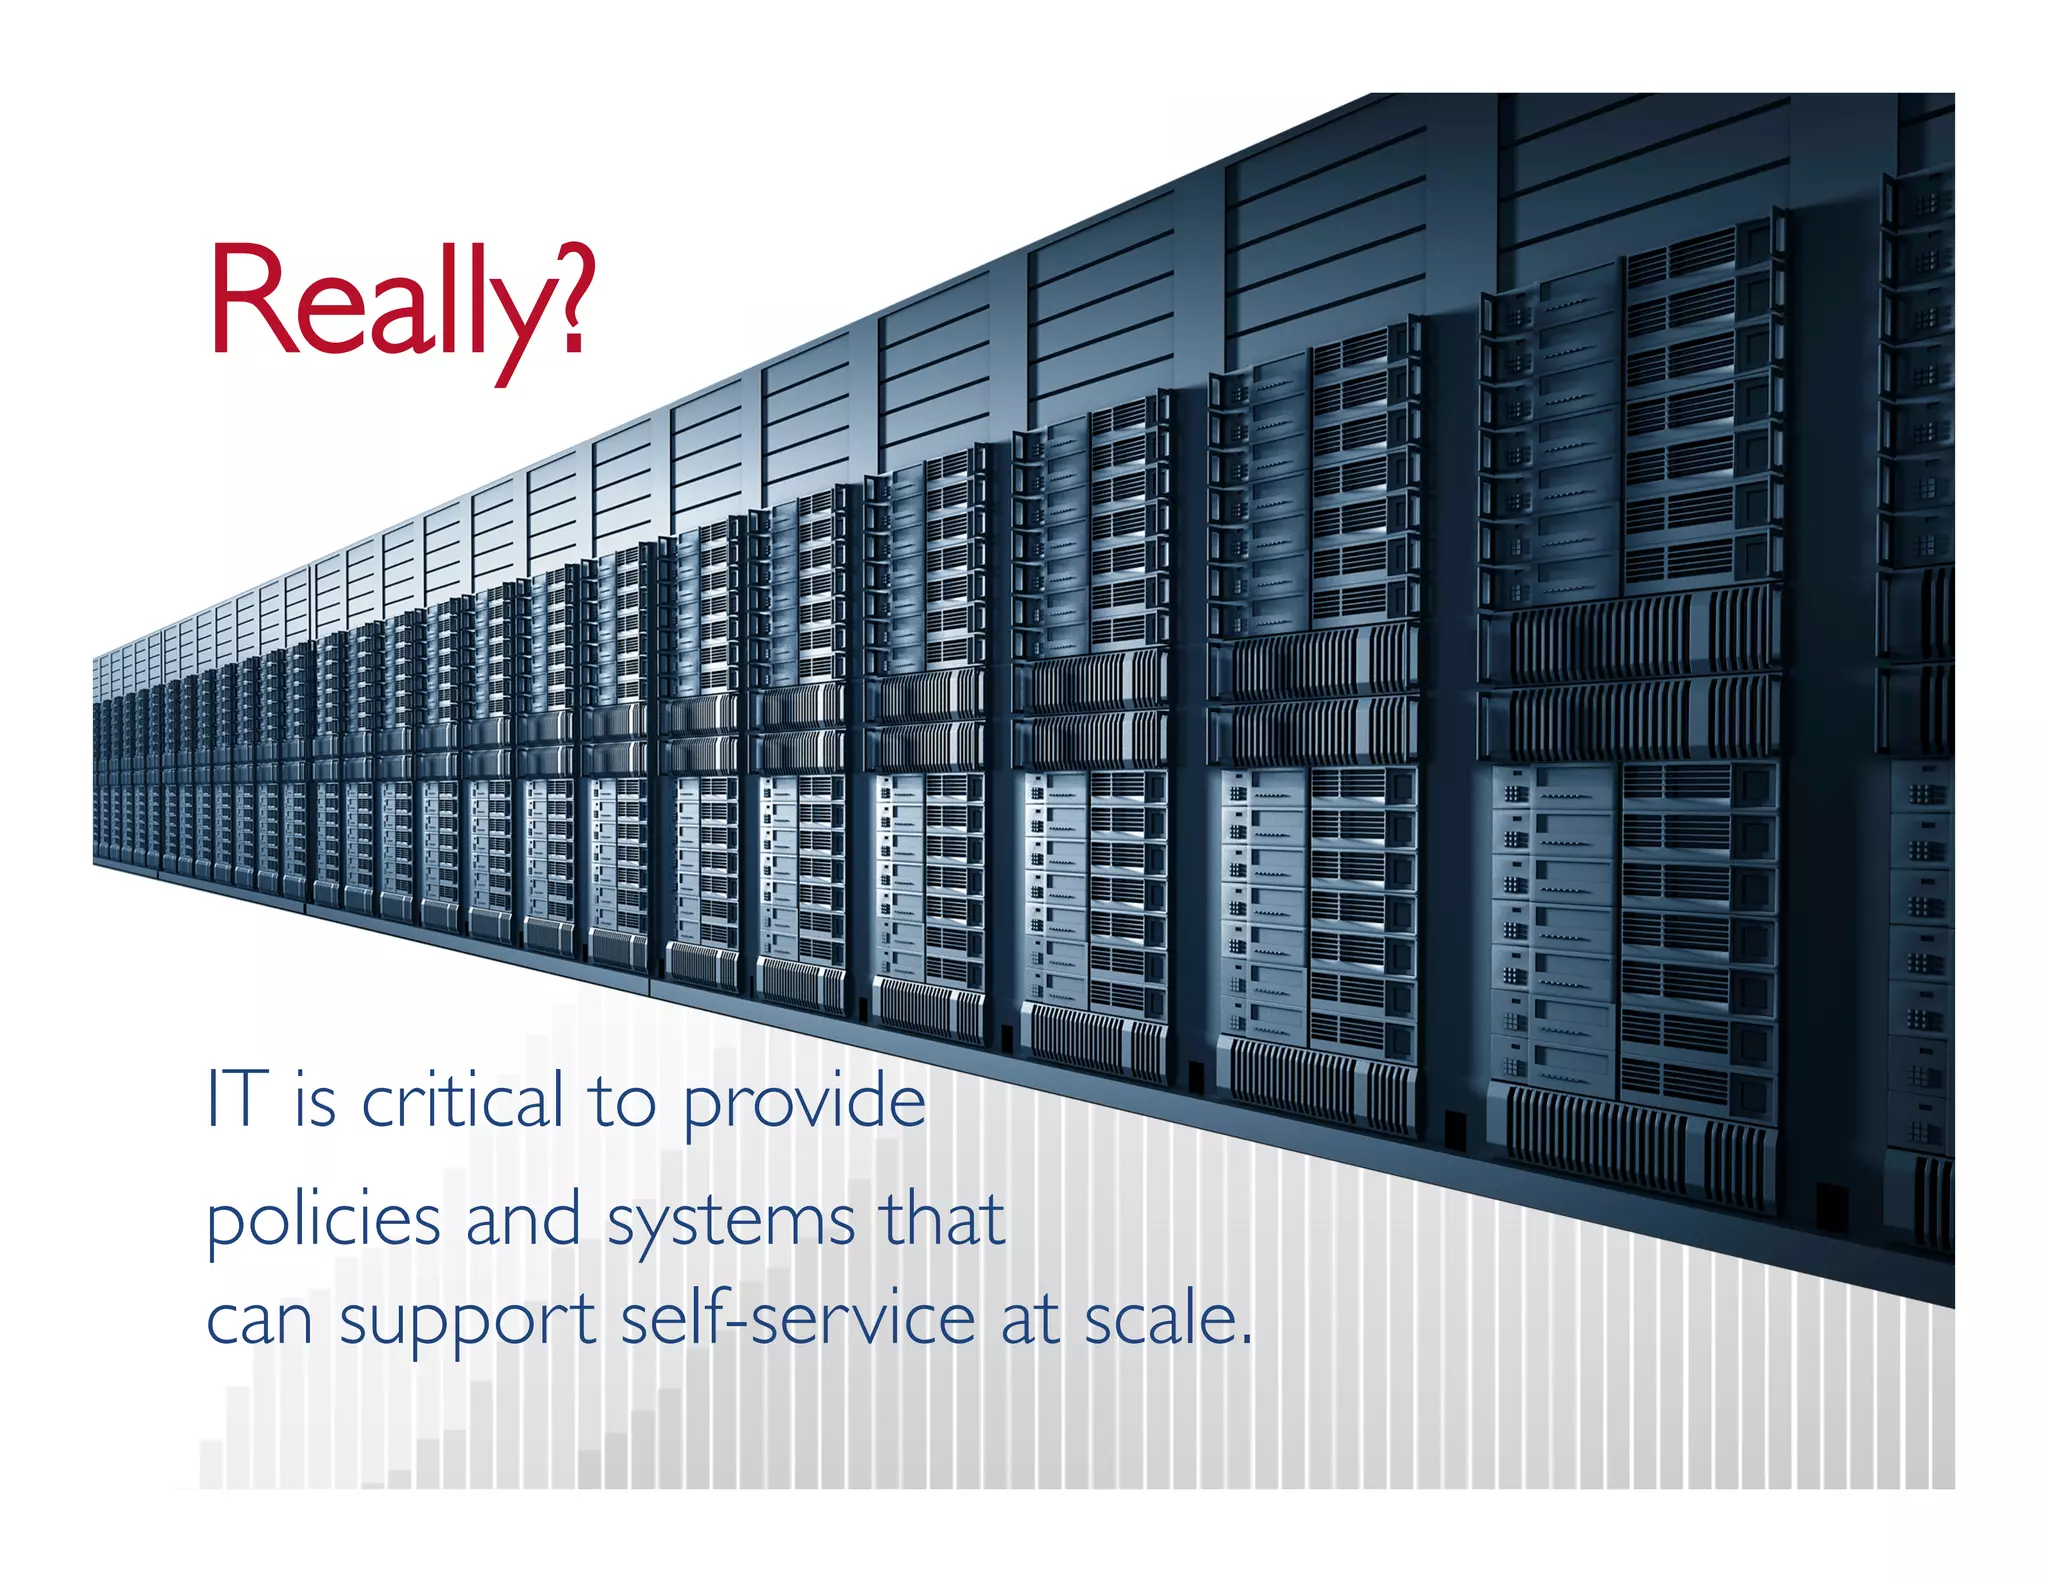
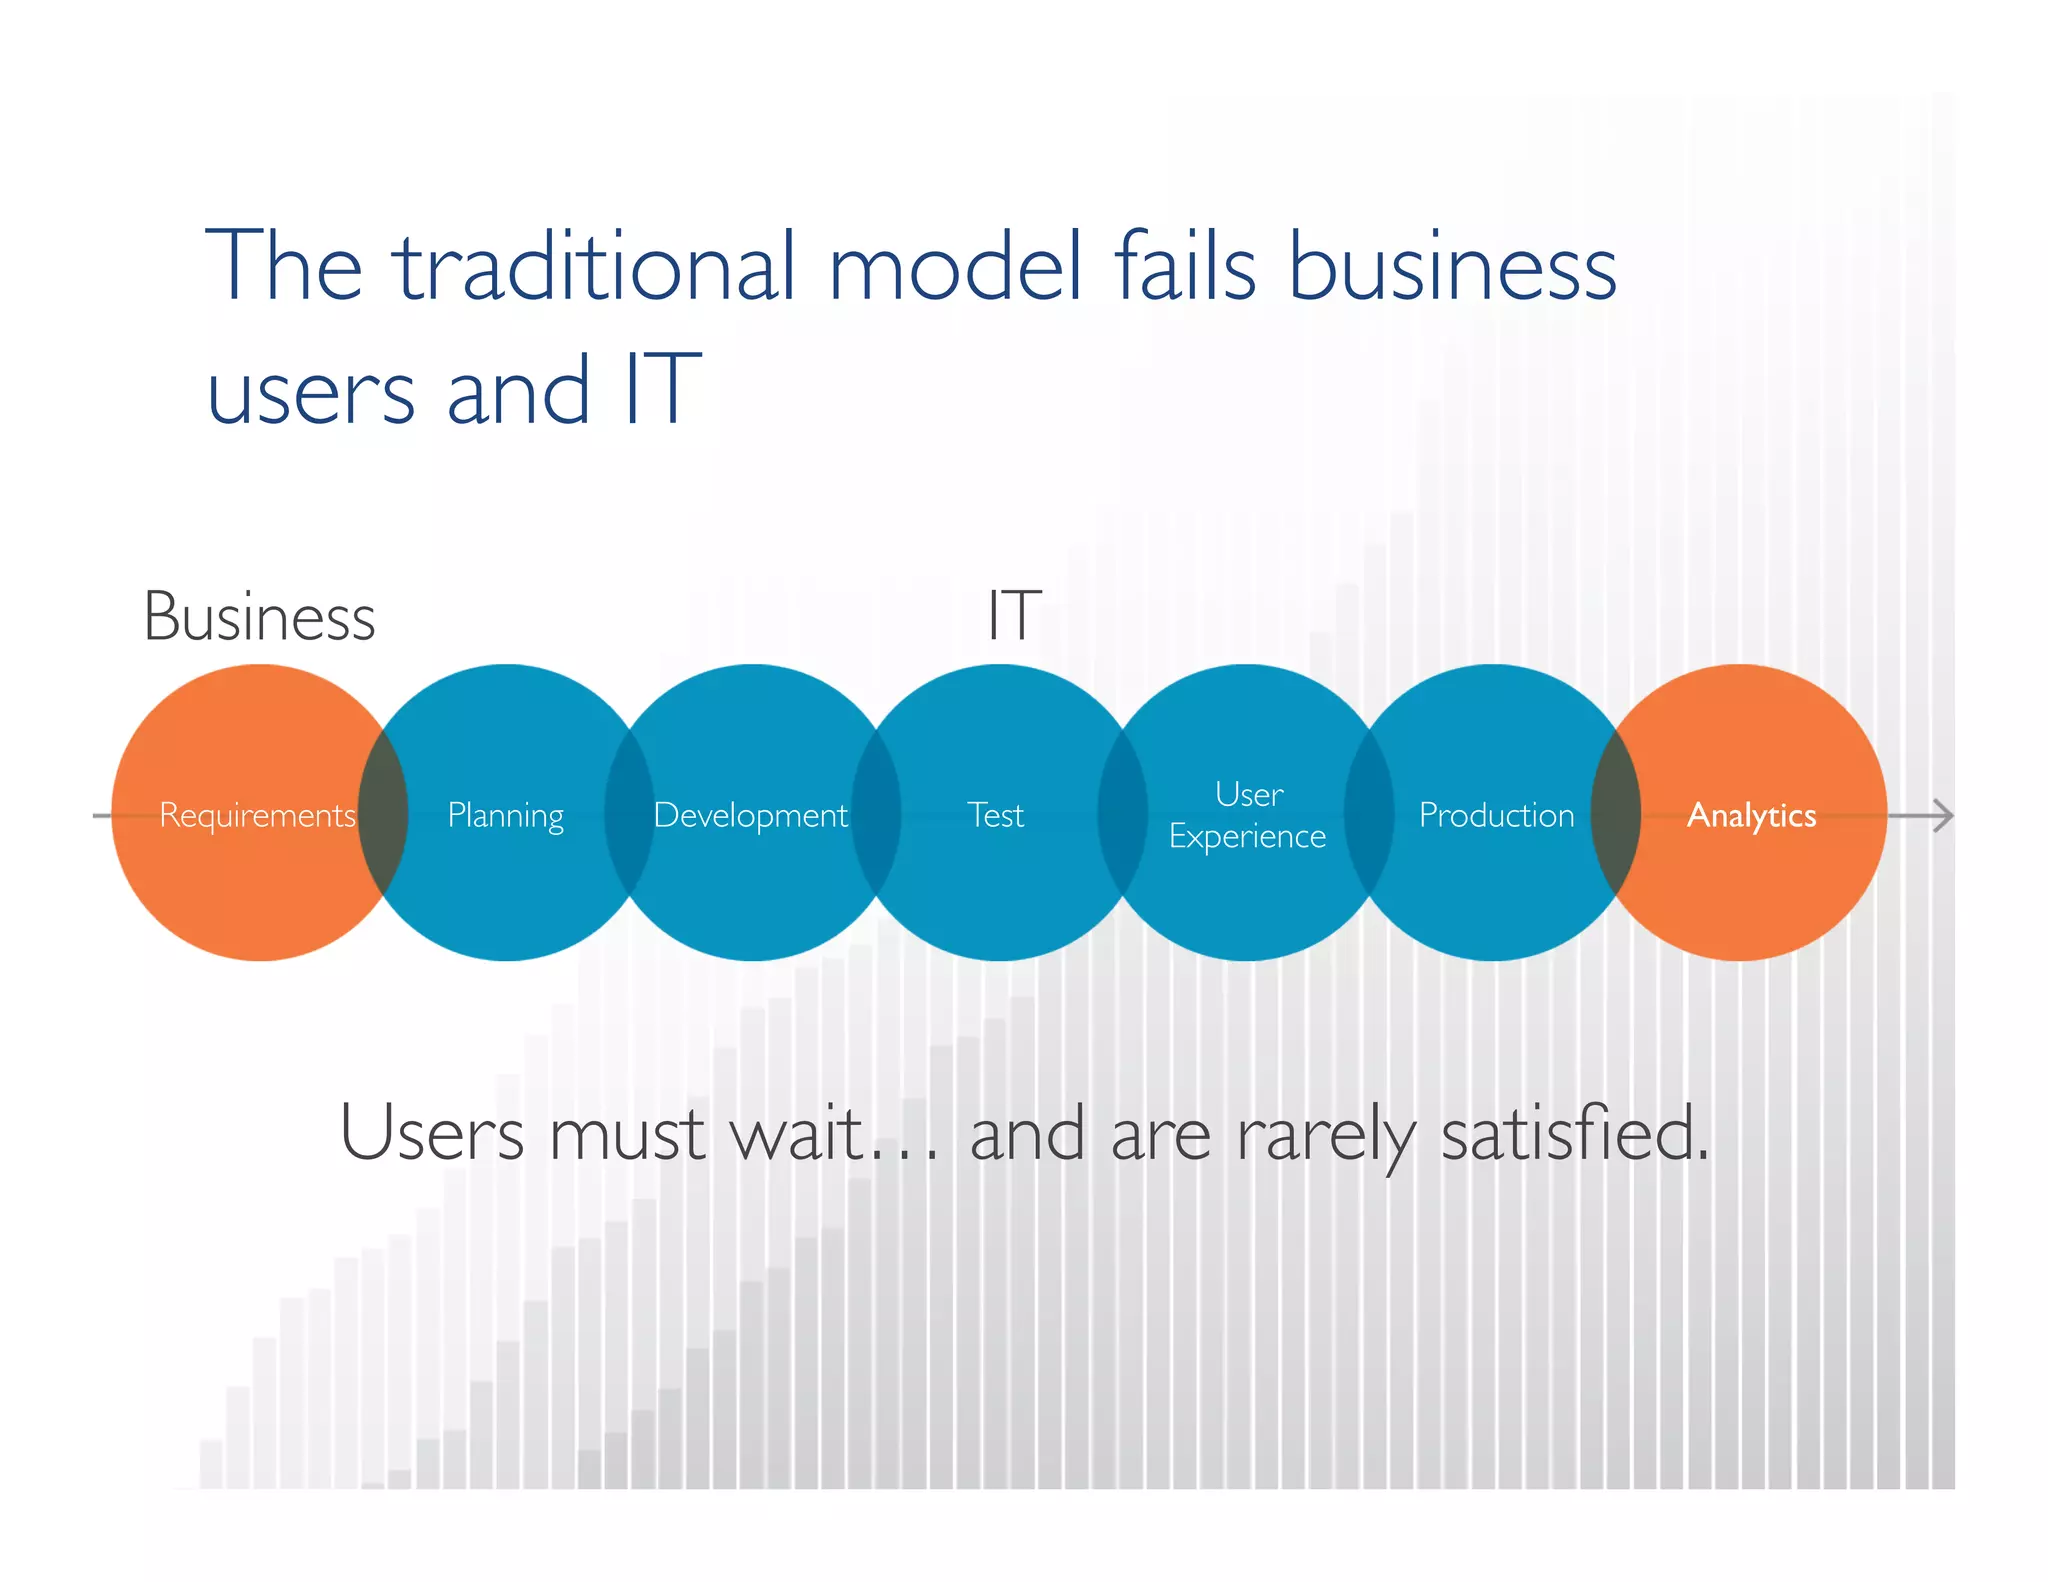
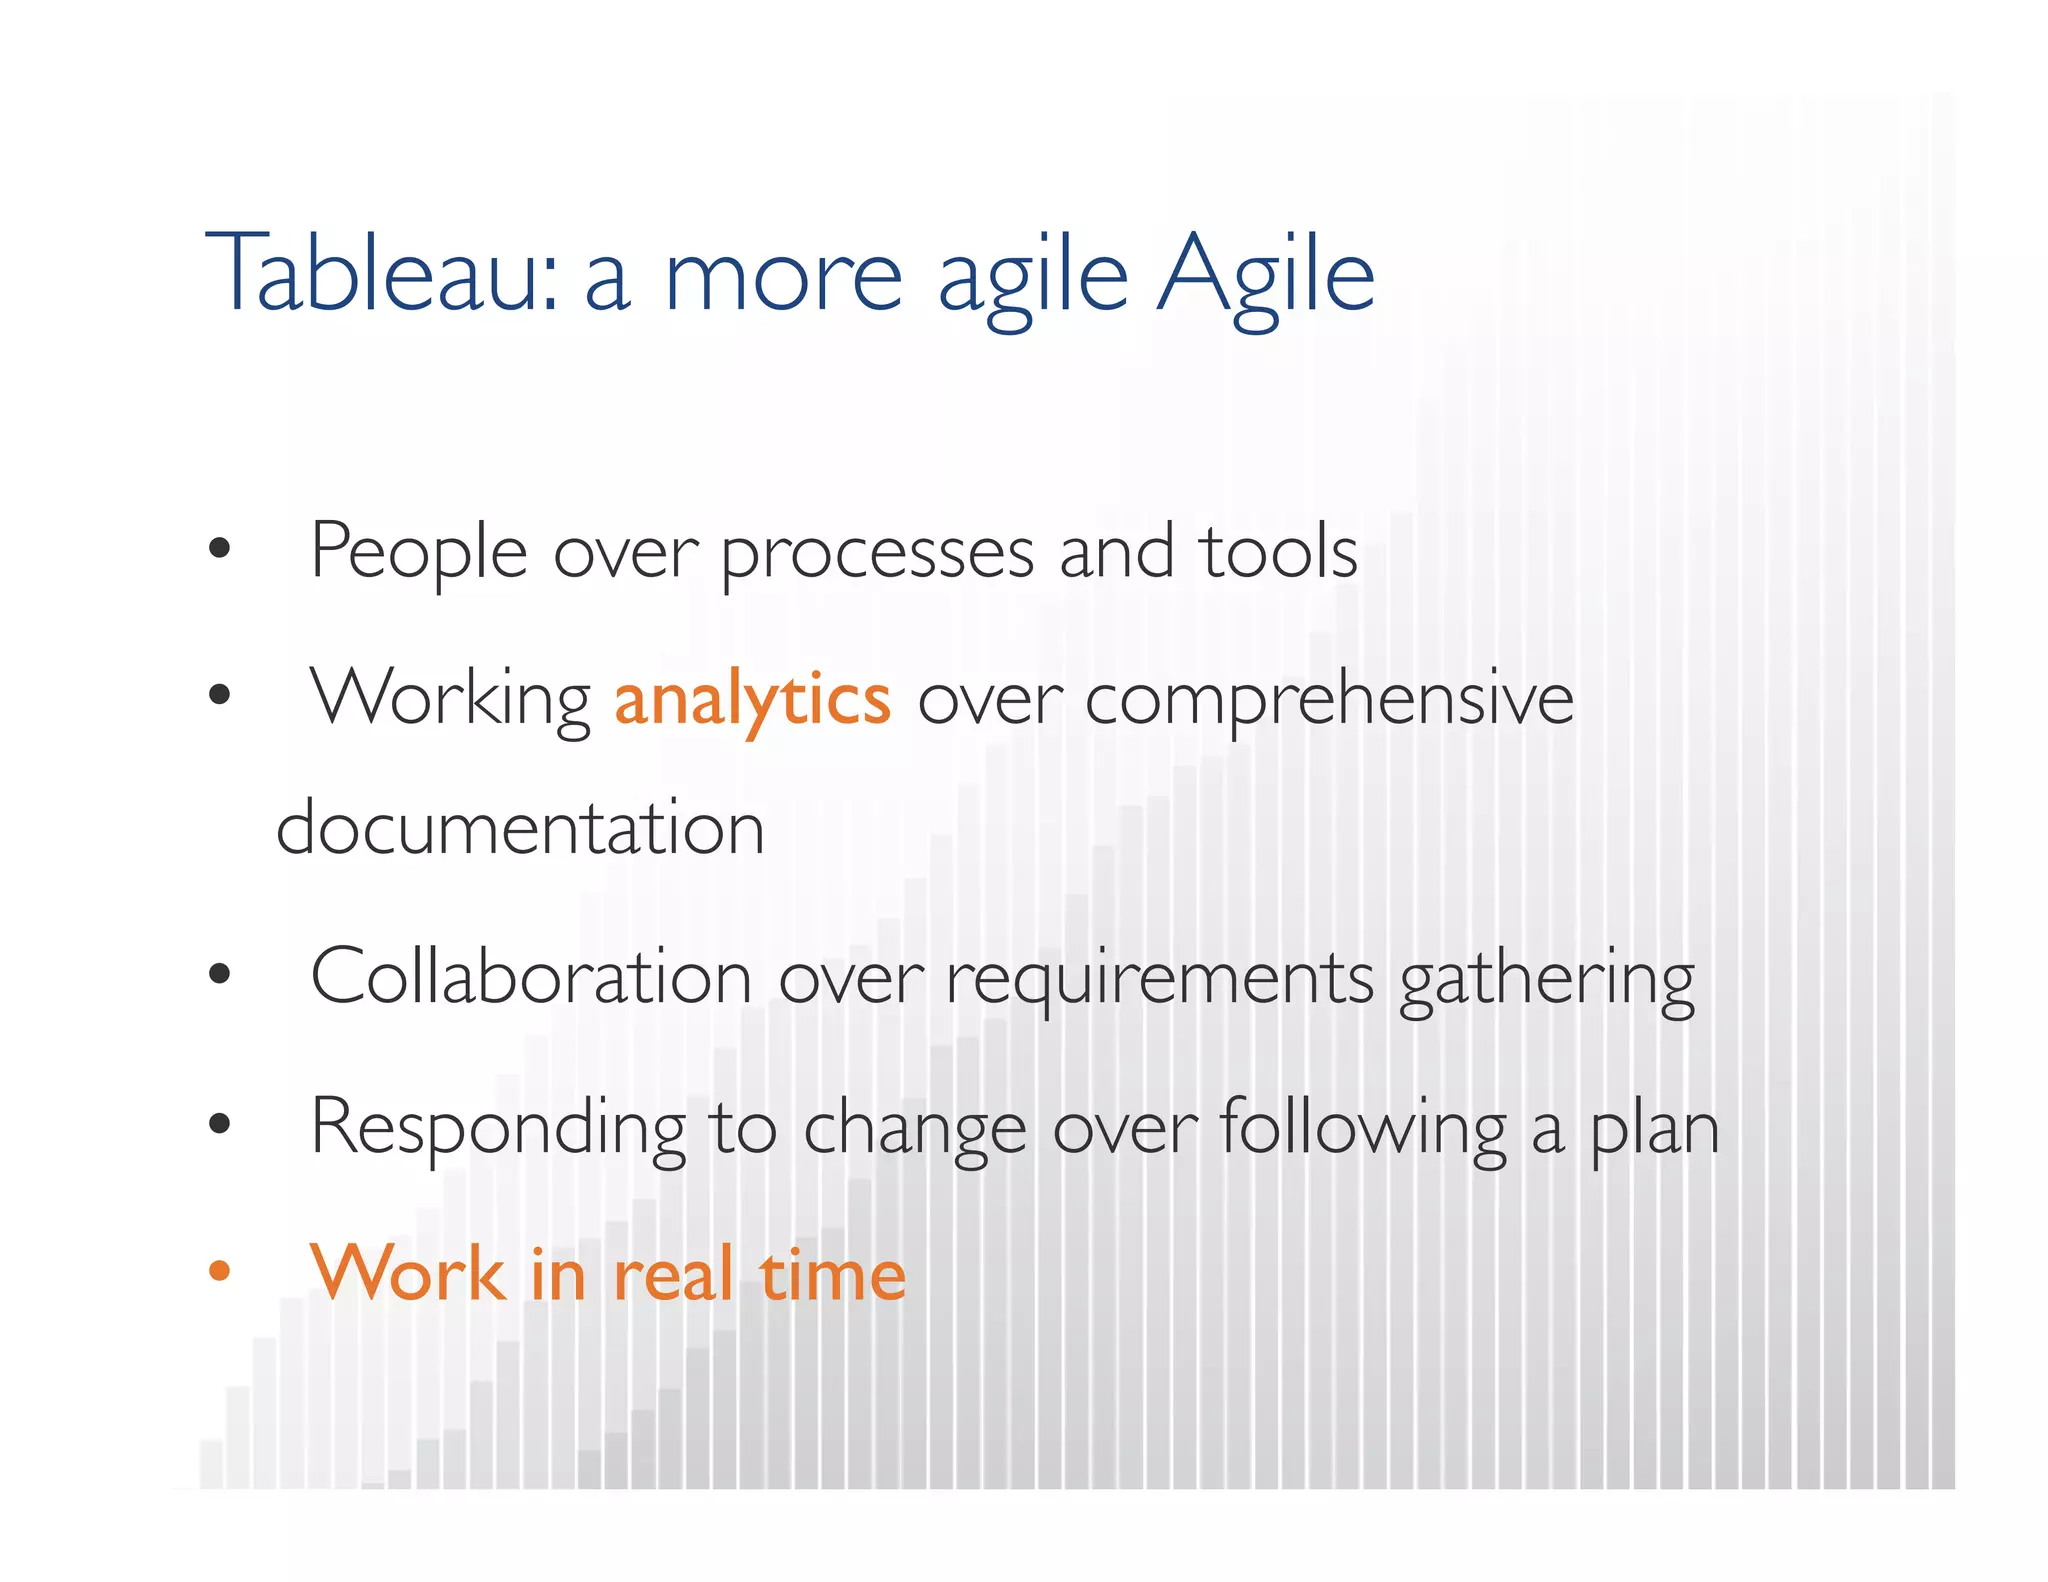
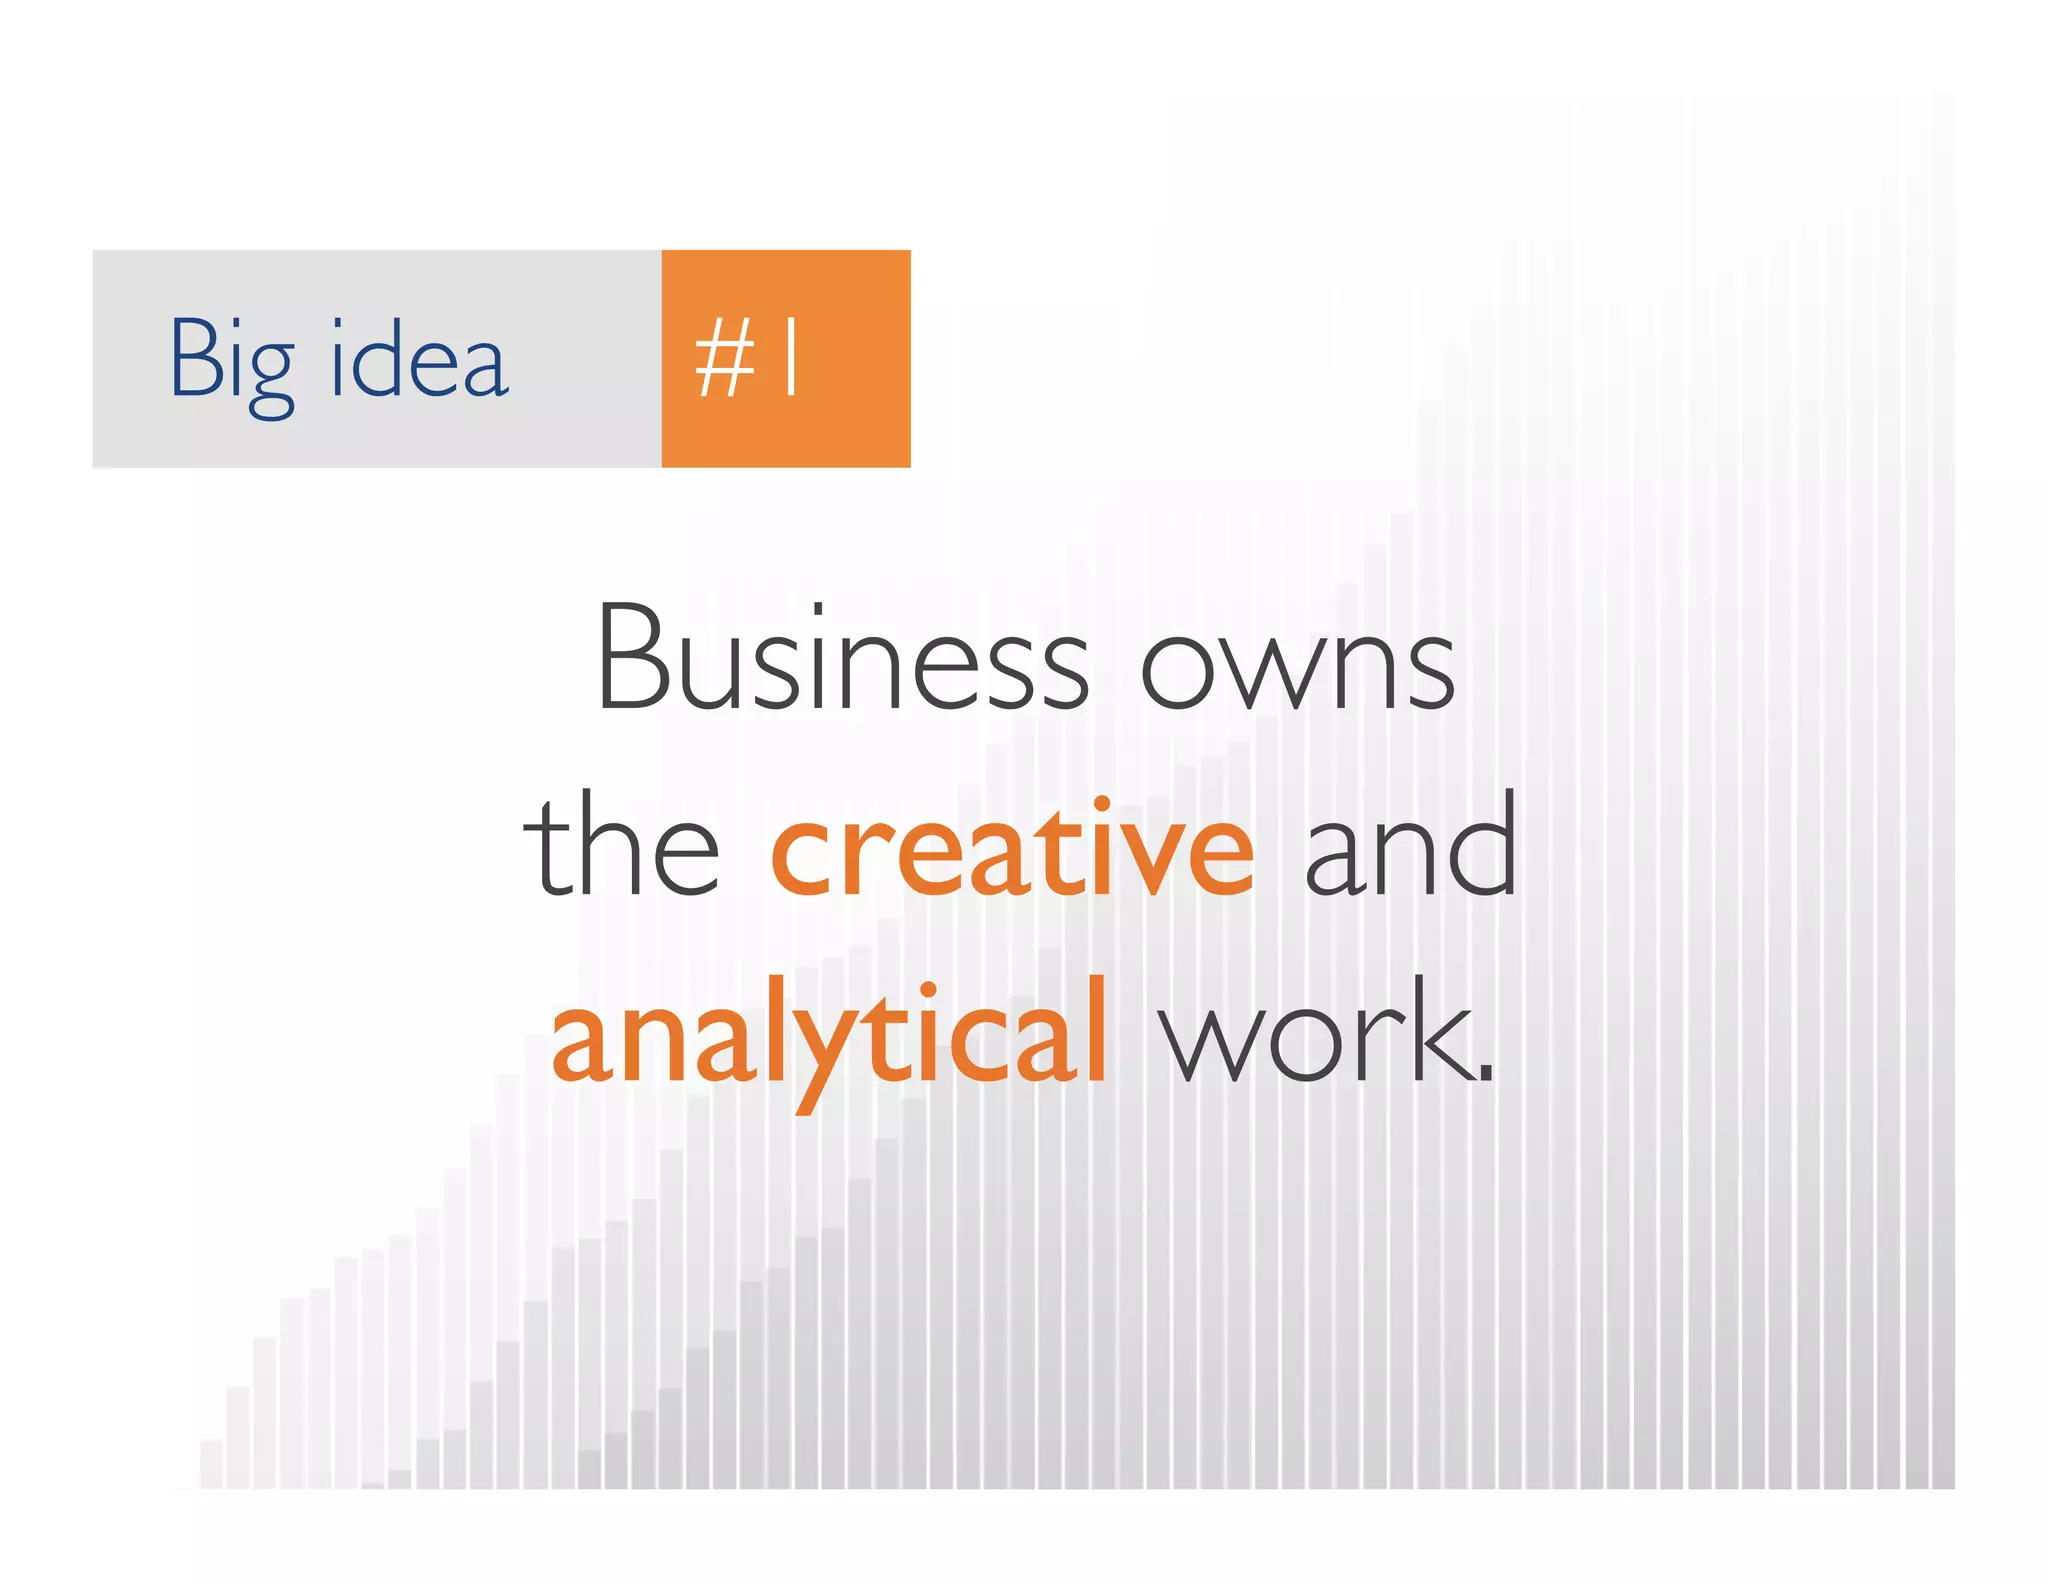
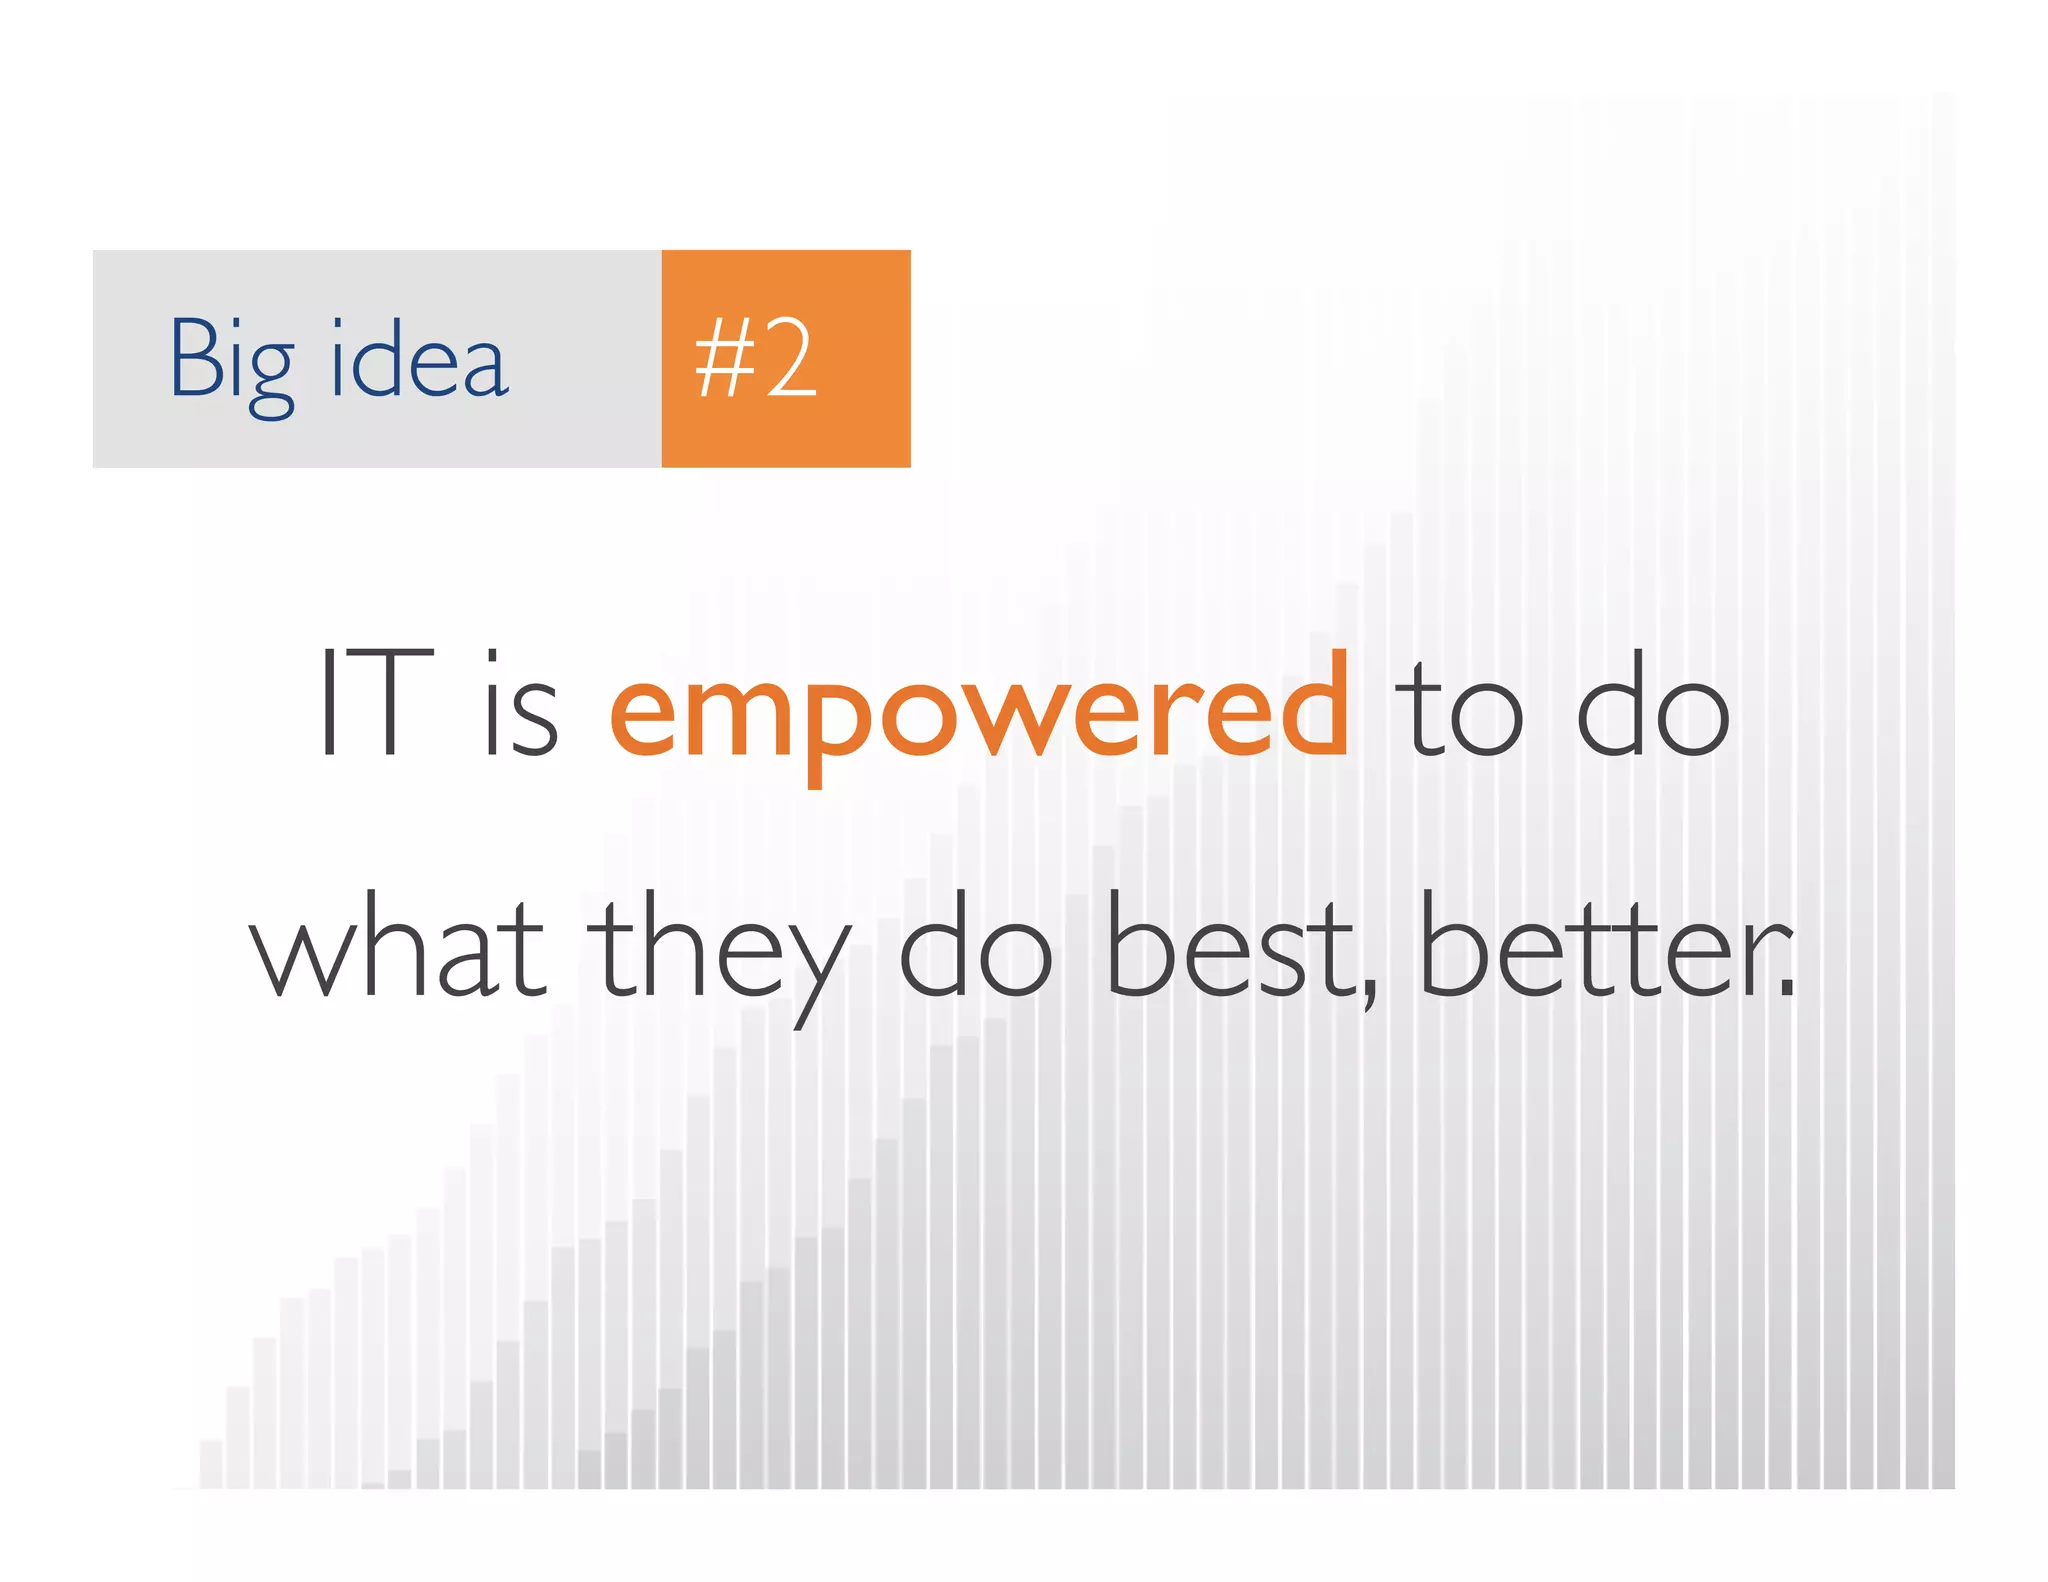
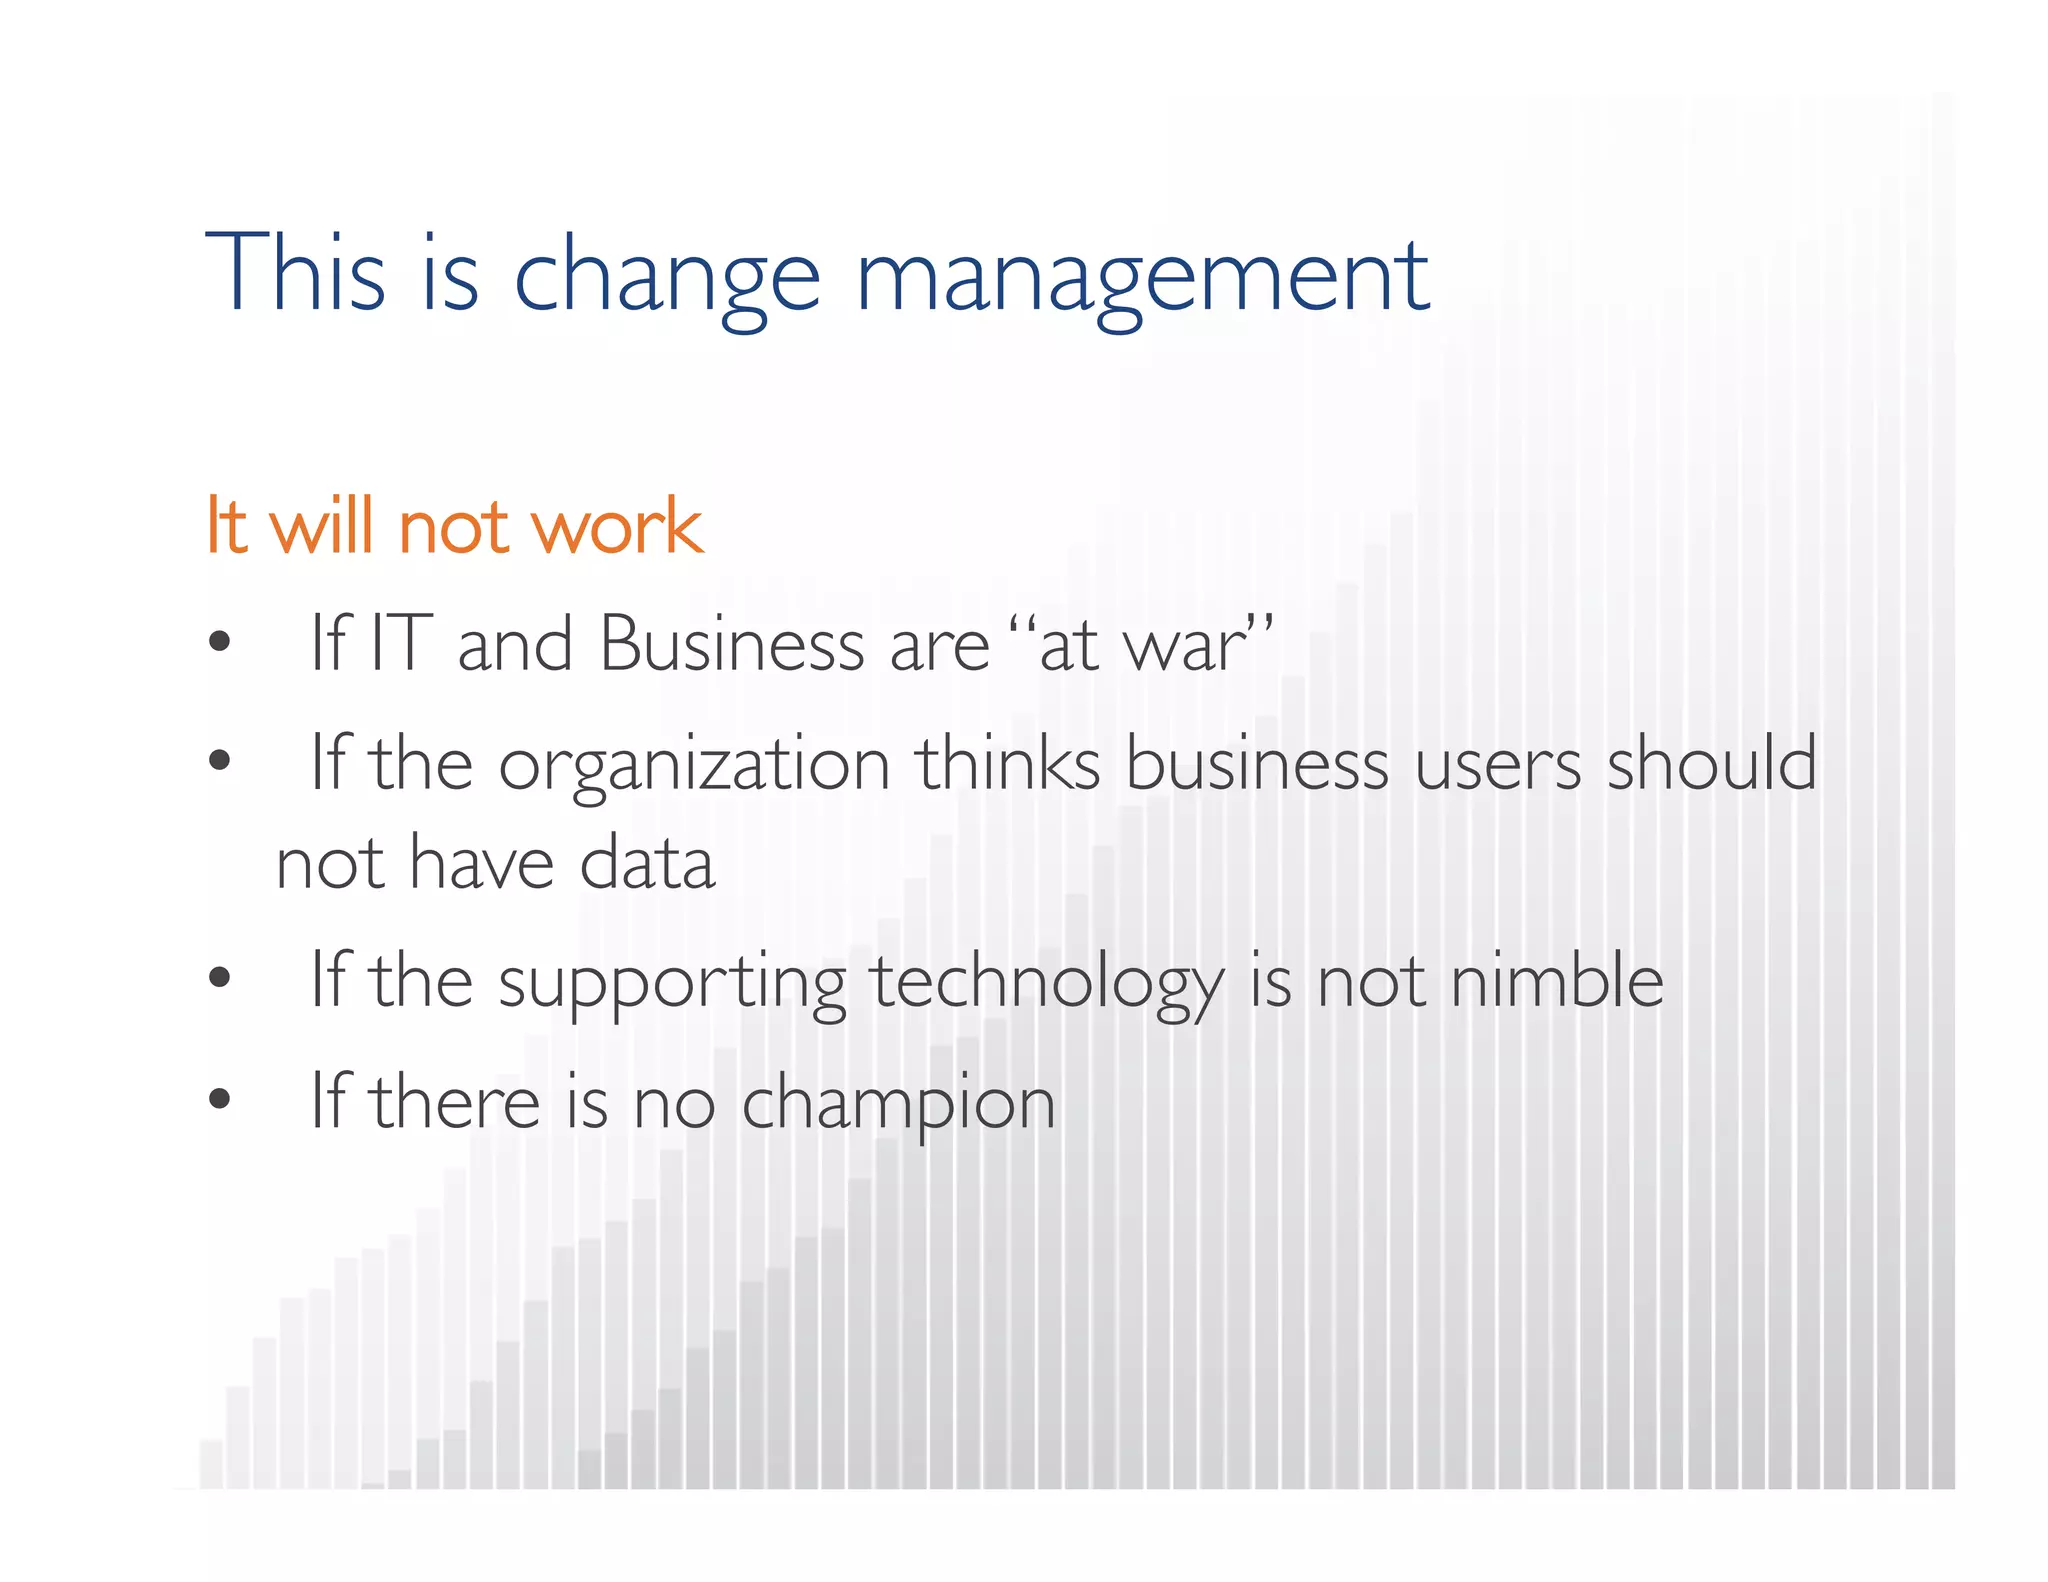
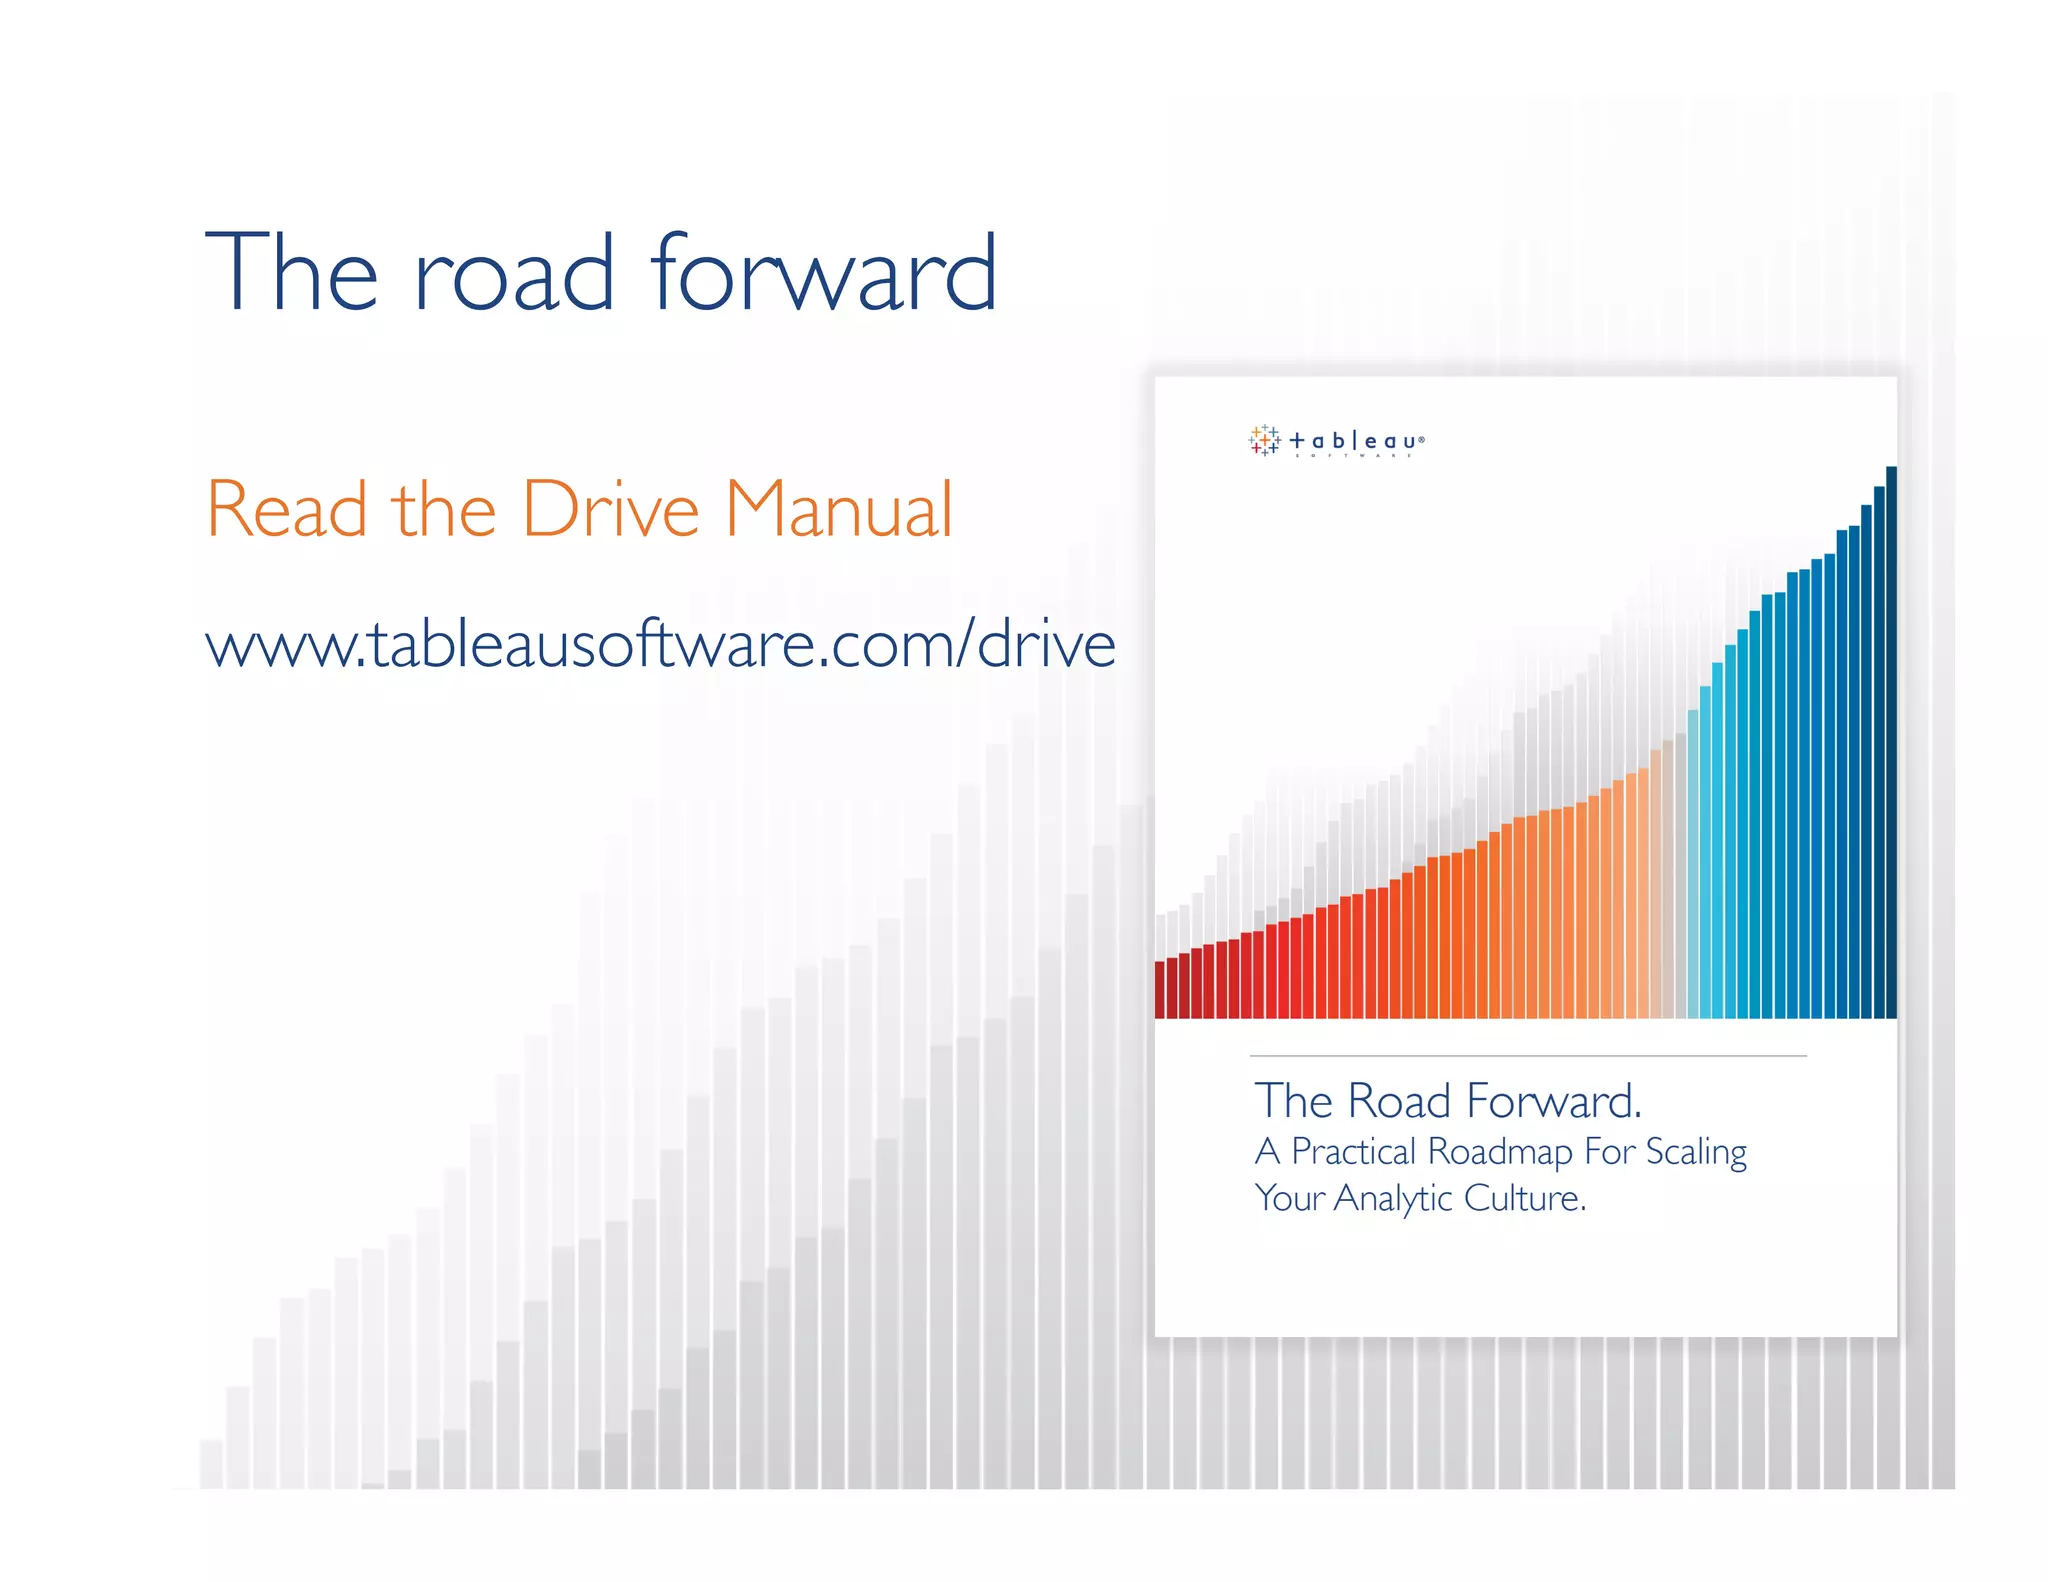

The document discusses scaling analytic culture through self-service analytics and outlines critical strategies for effectively deploying analytics within organizations. It emphasizes the need for collaboration between IT and business, the iterative nature of visual analytics, and the importance of overcoming obstacles that hinder adoption. The Tableau Drive methodology is presented as a solution to enhance real-time iteration and empower business users to solve problems independently.