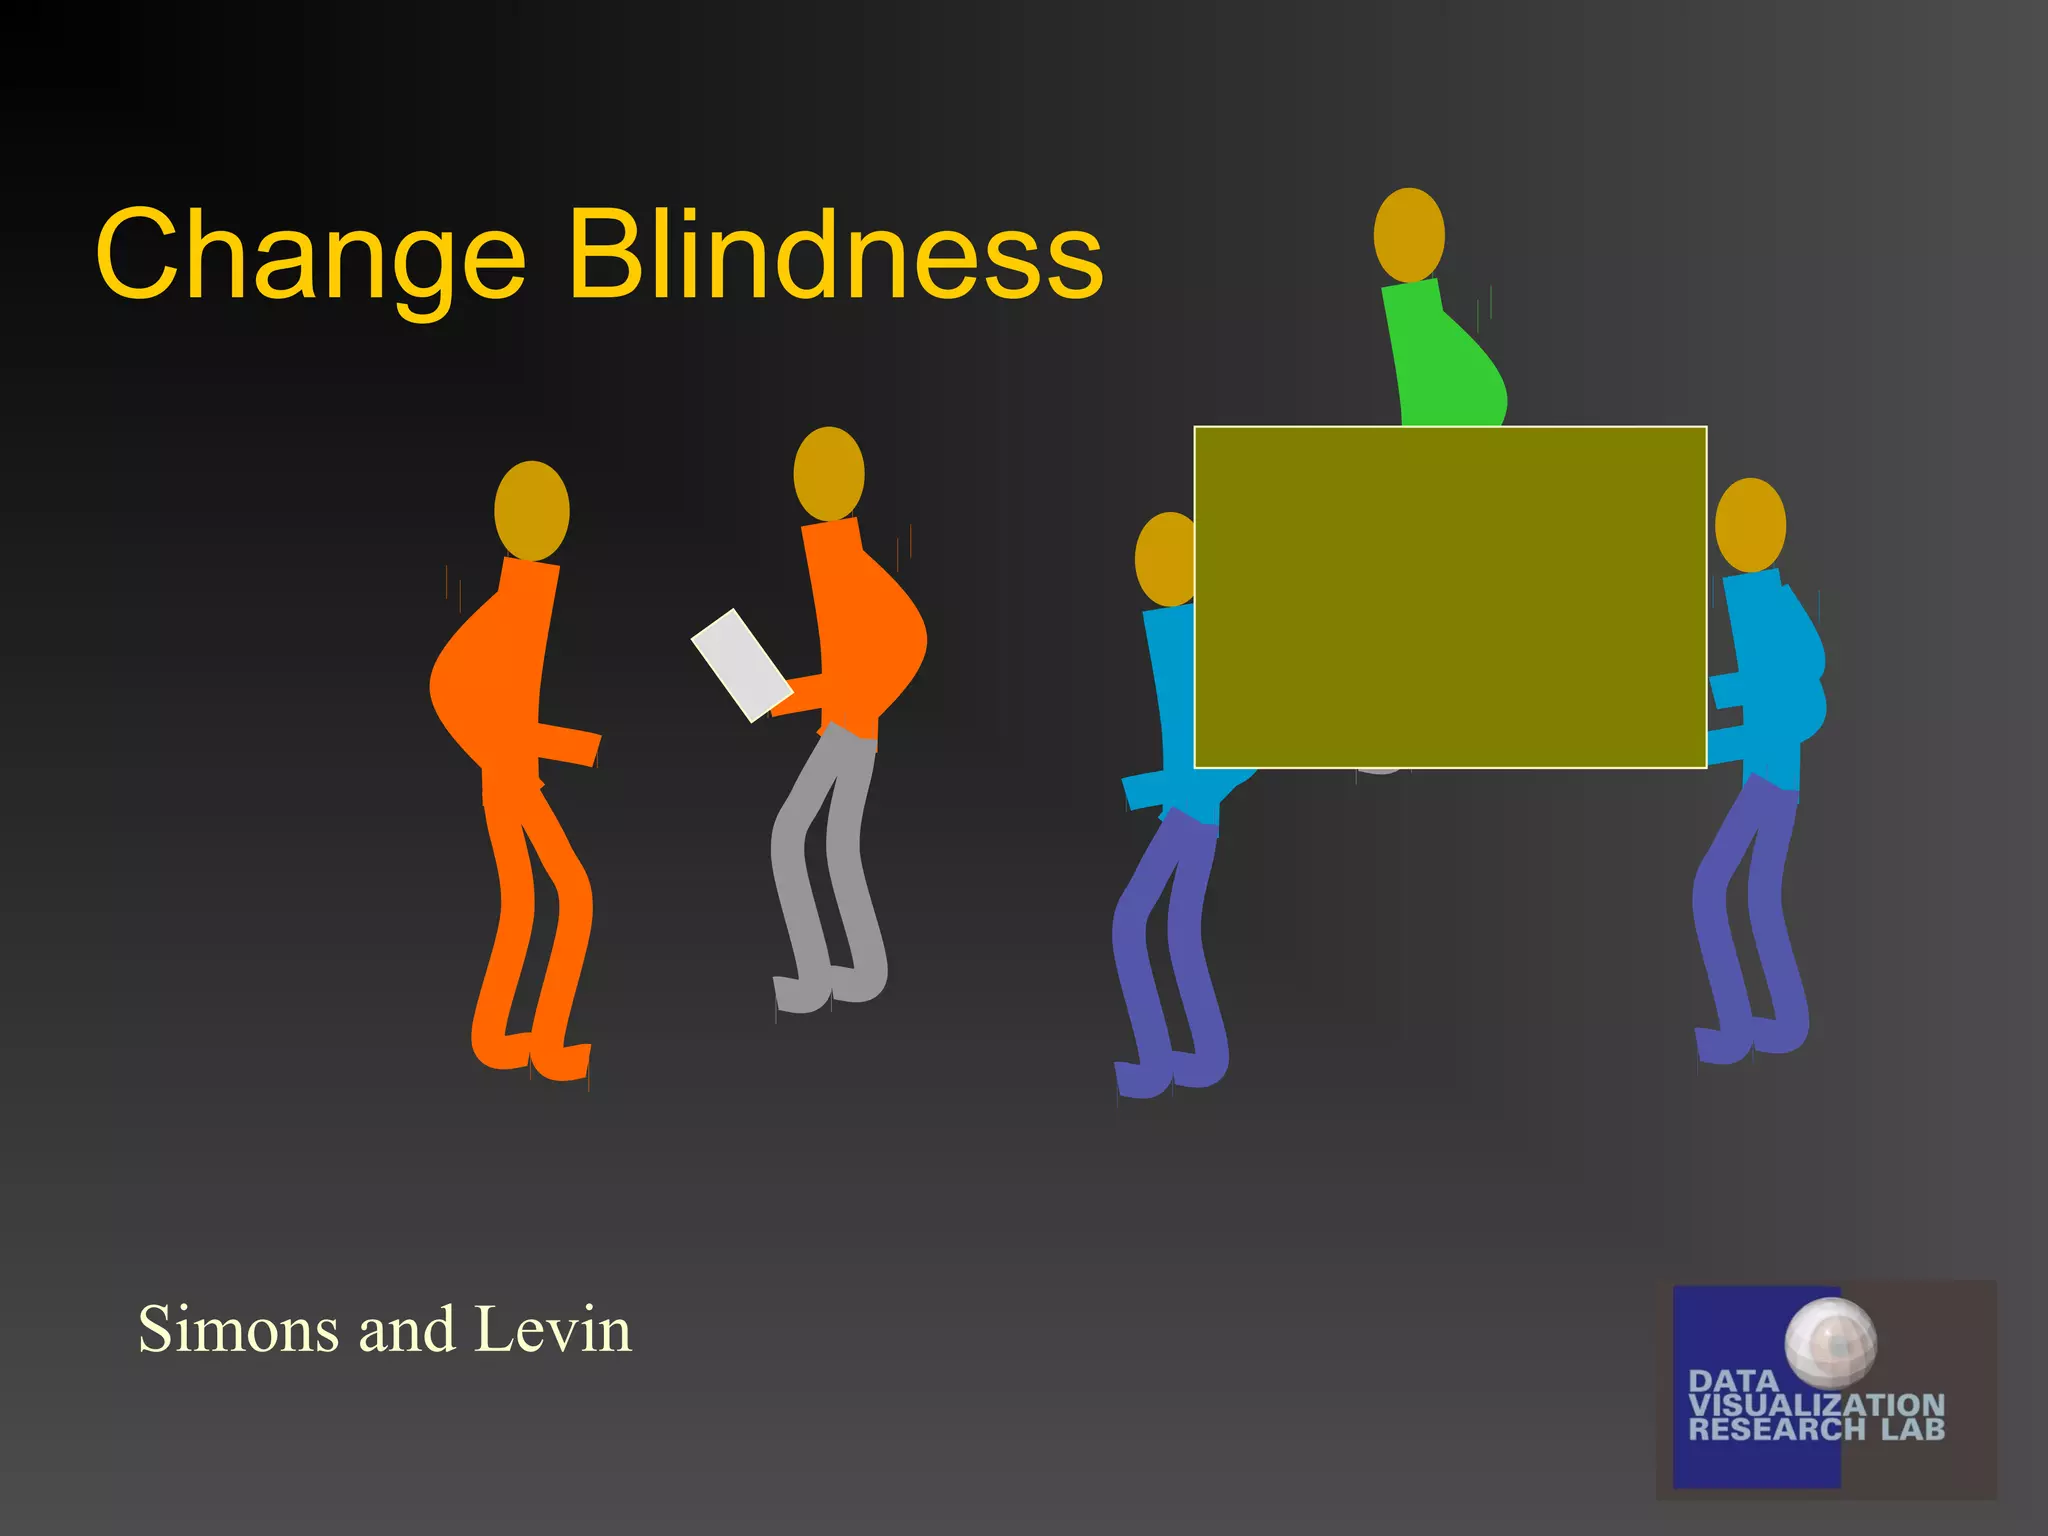
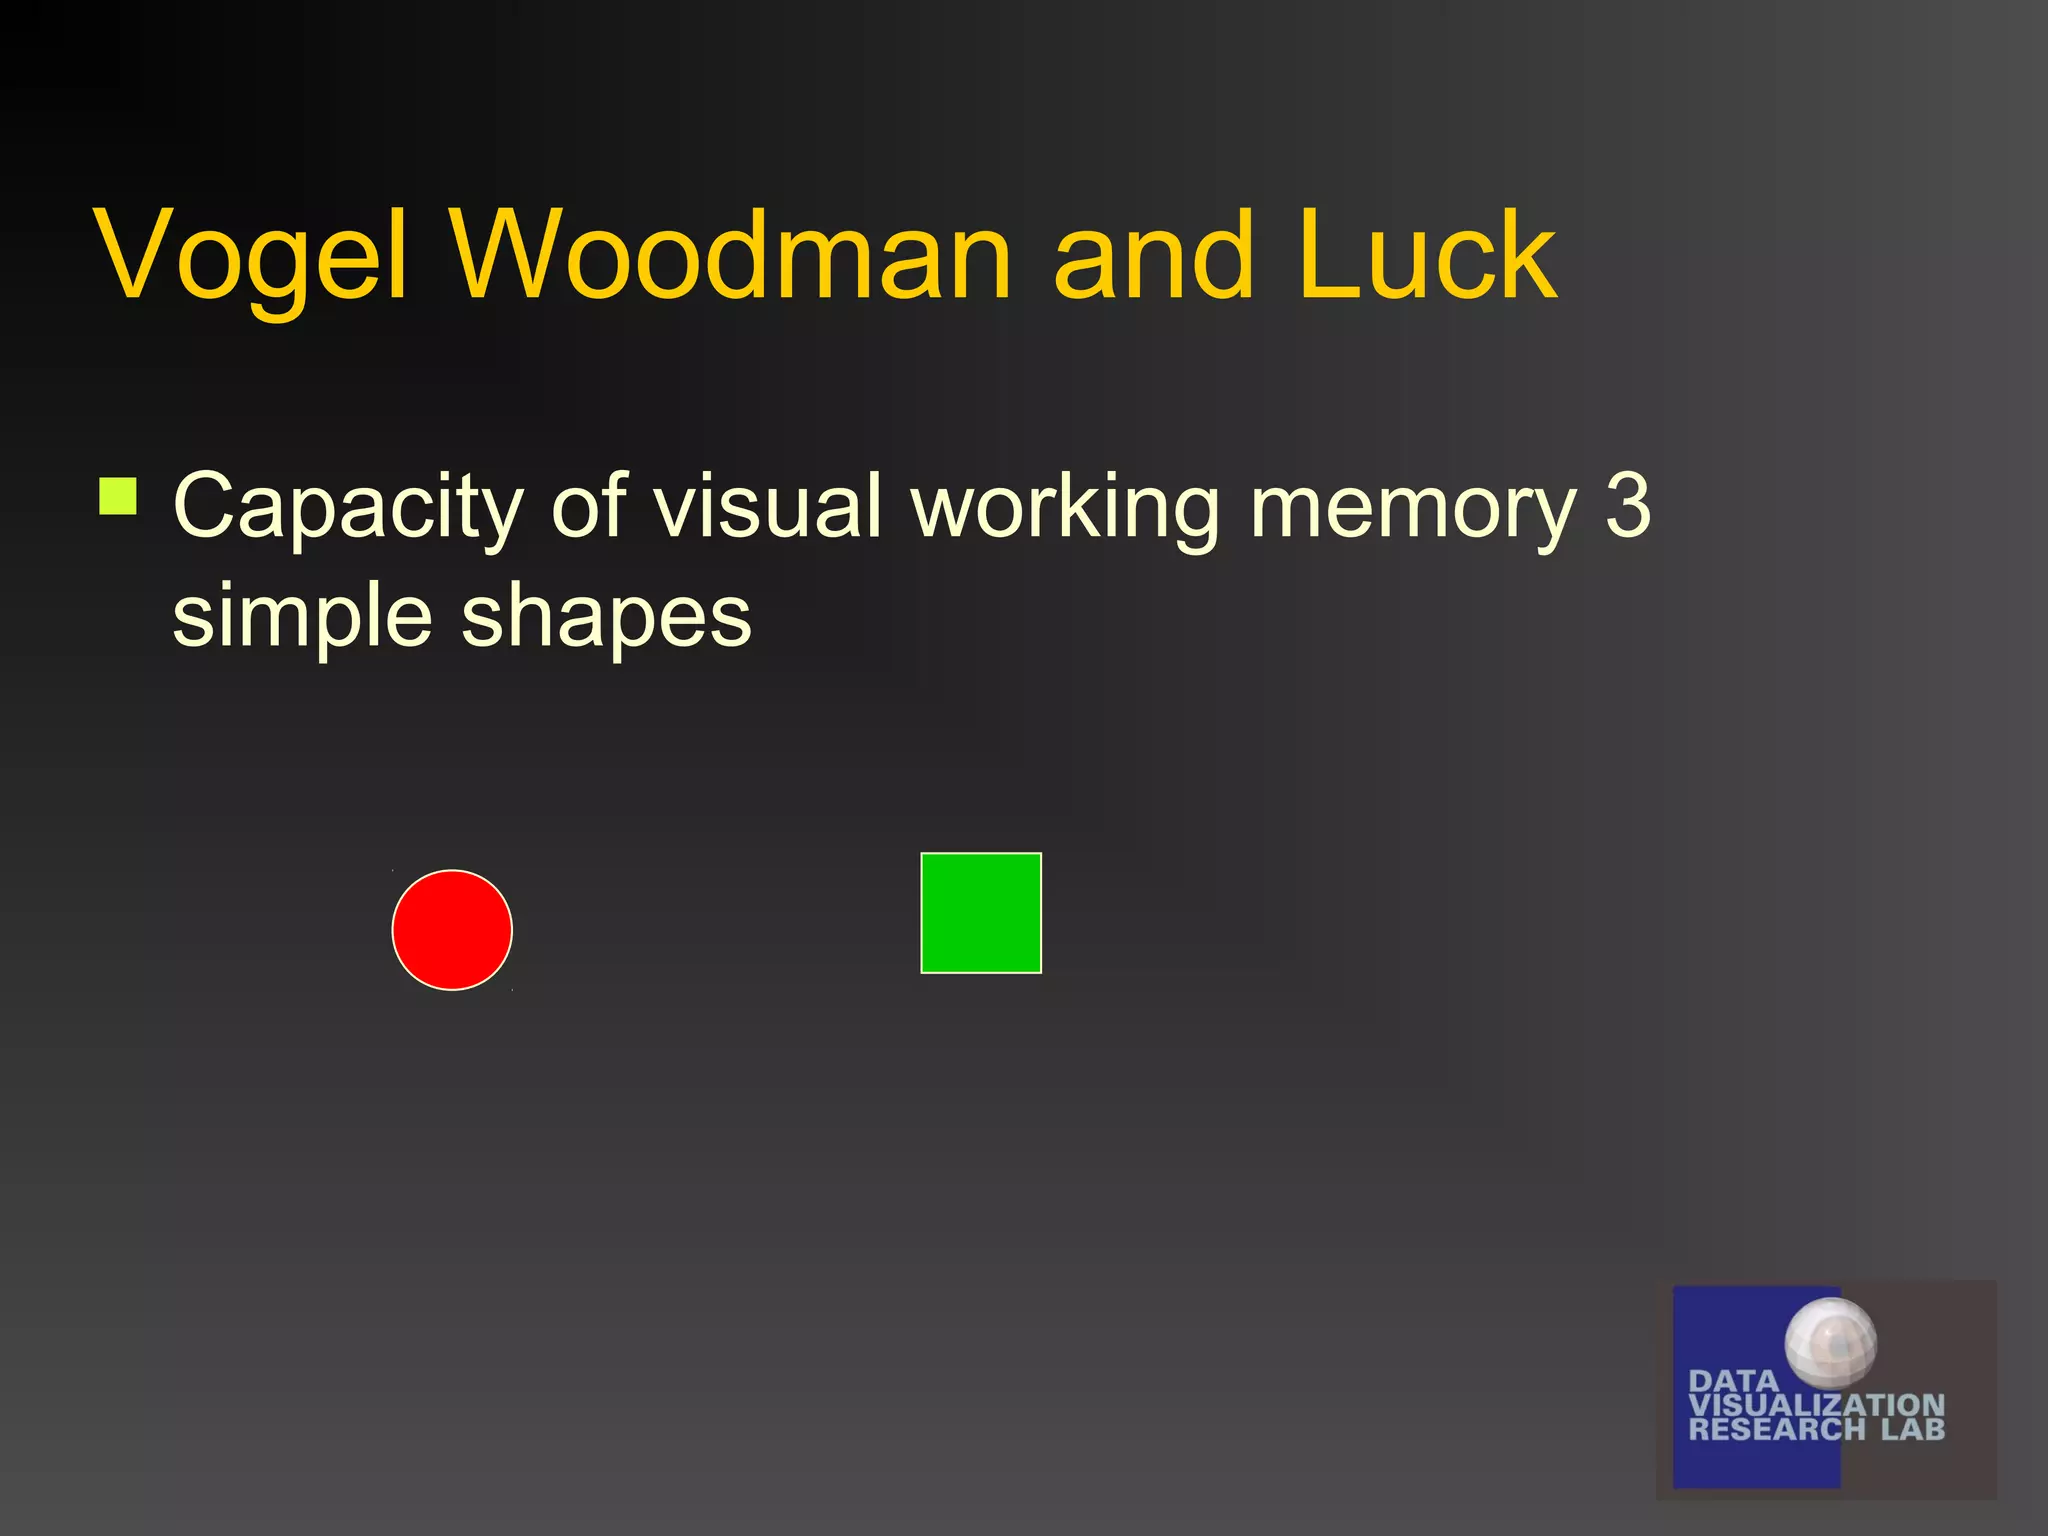
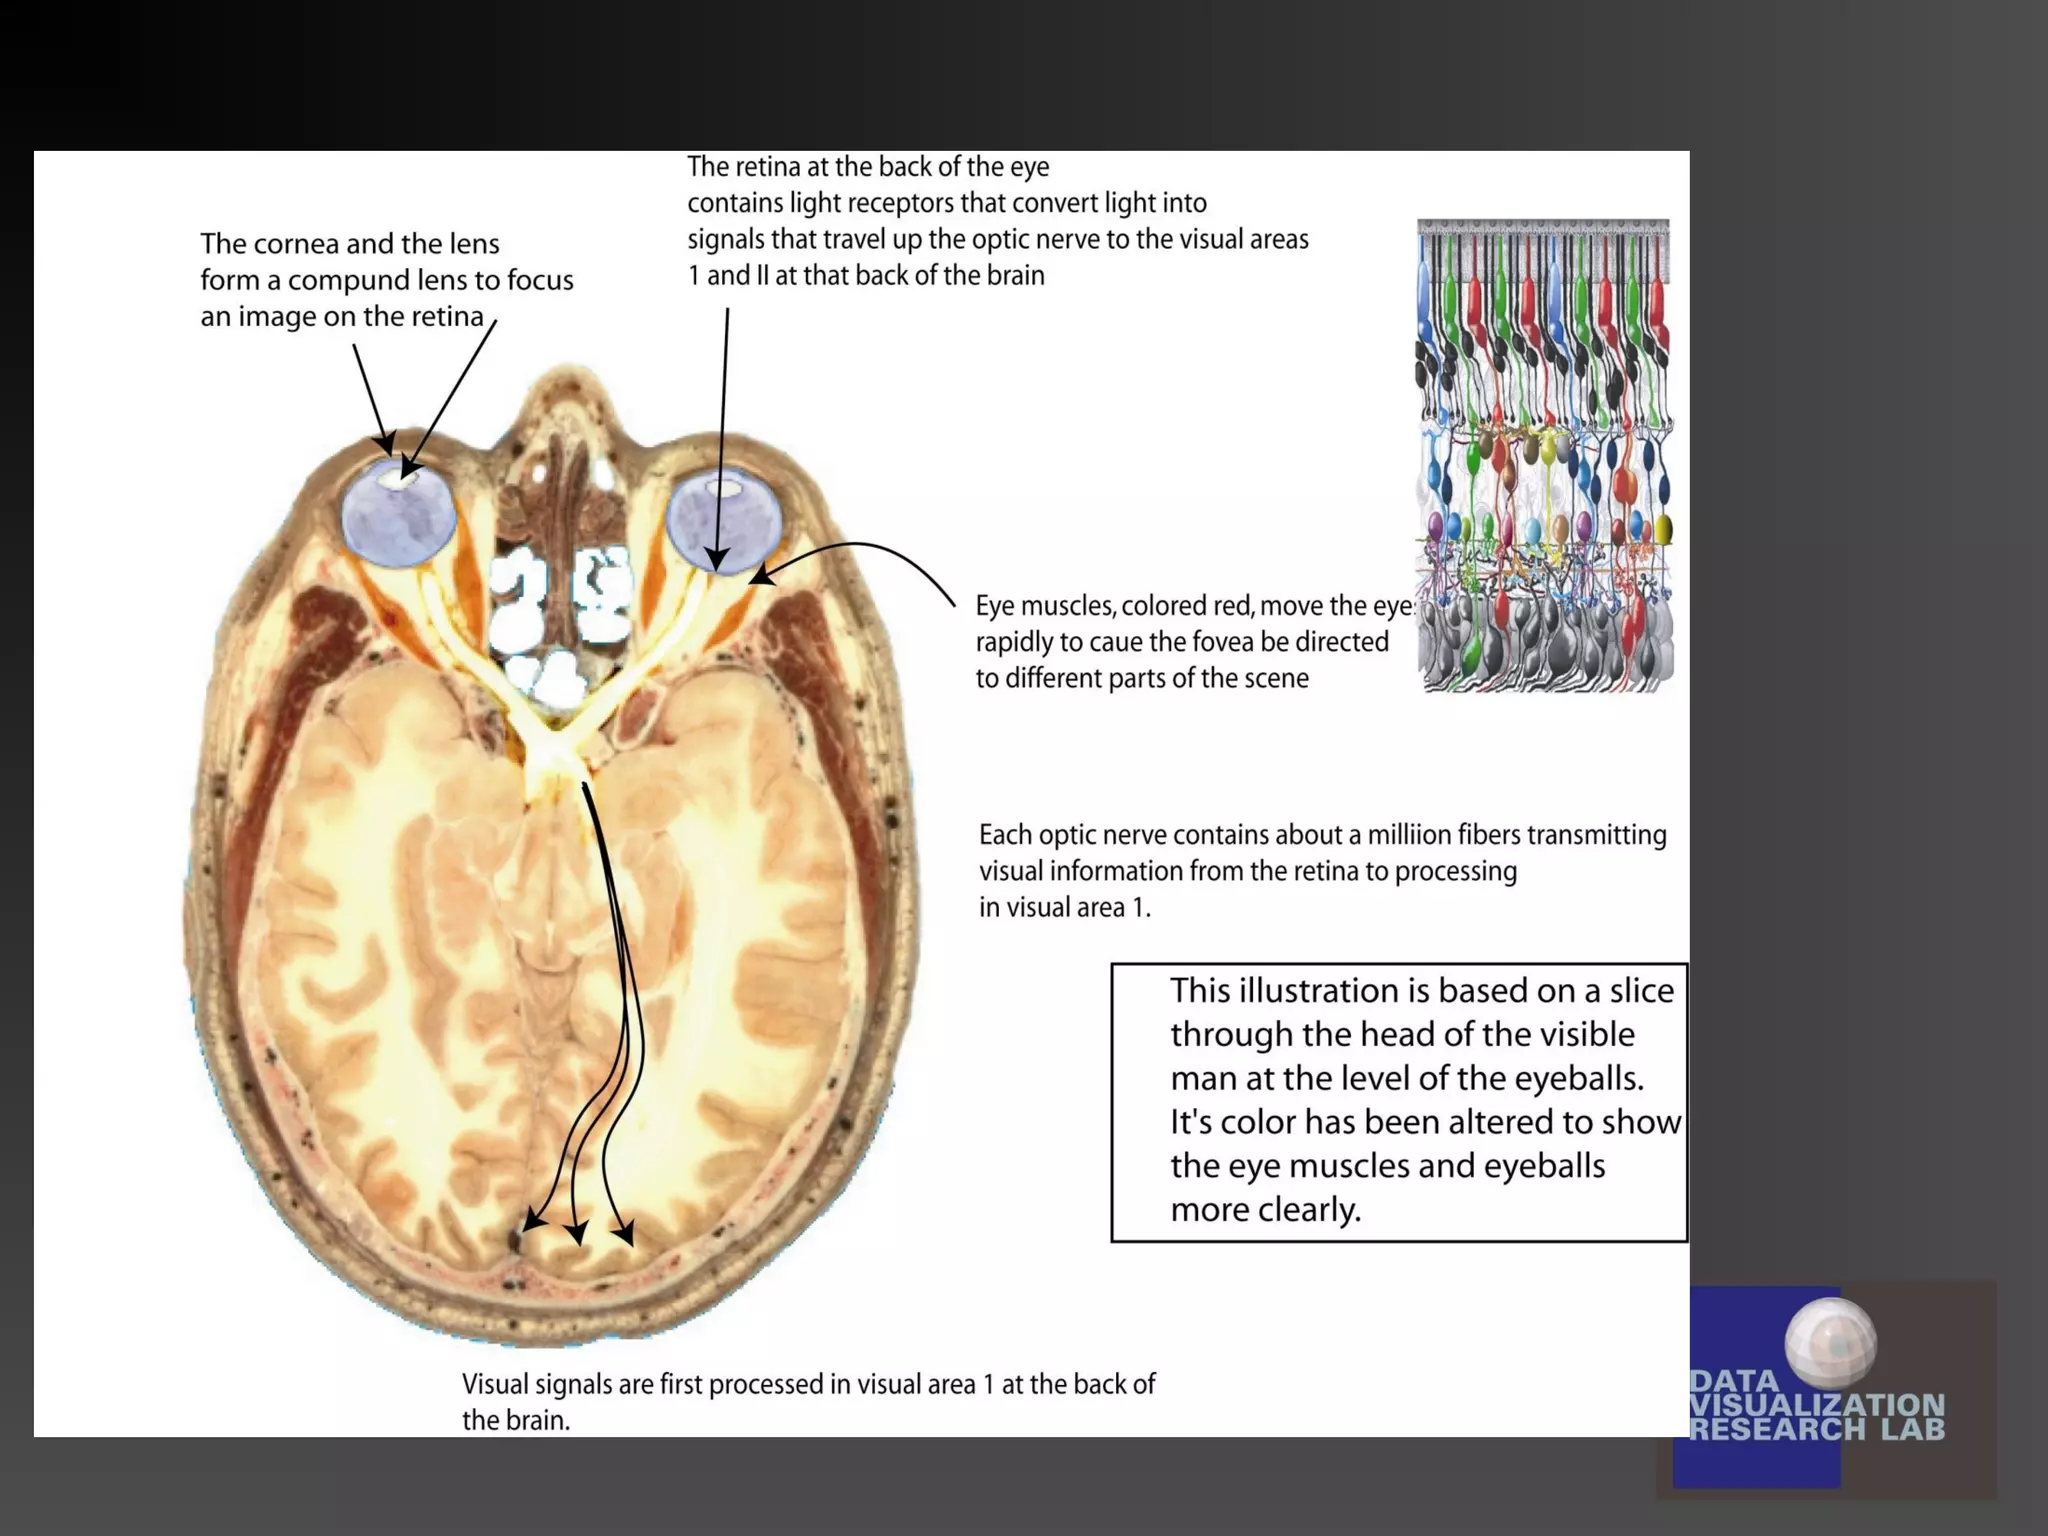
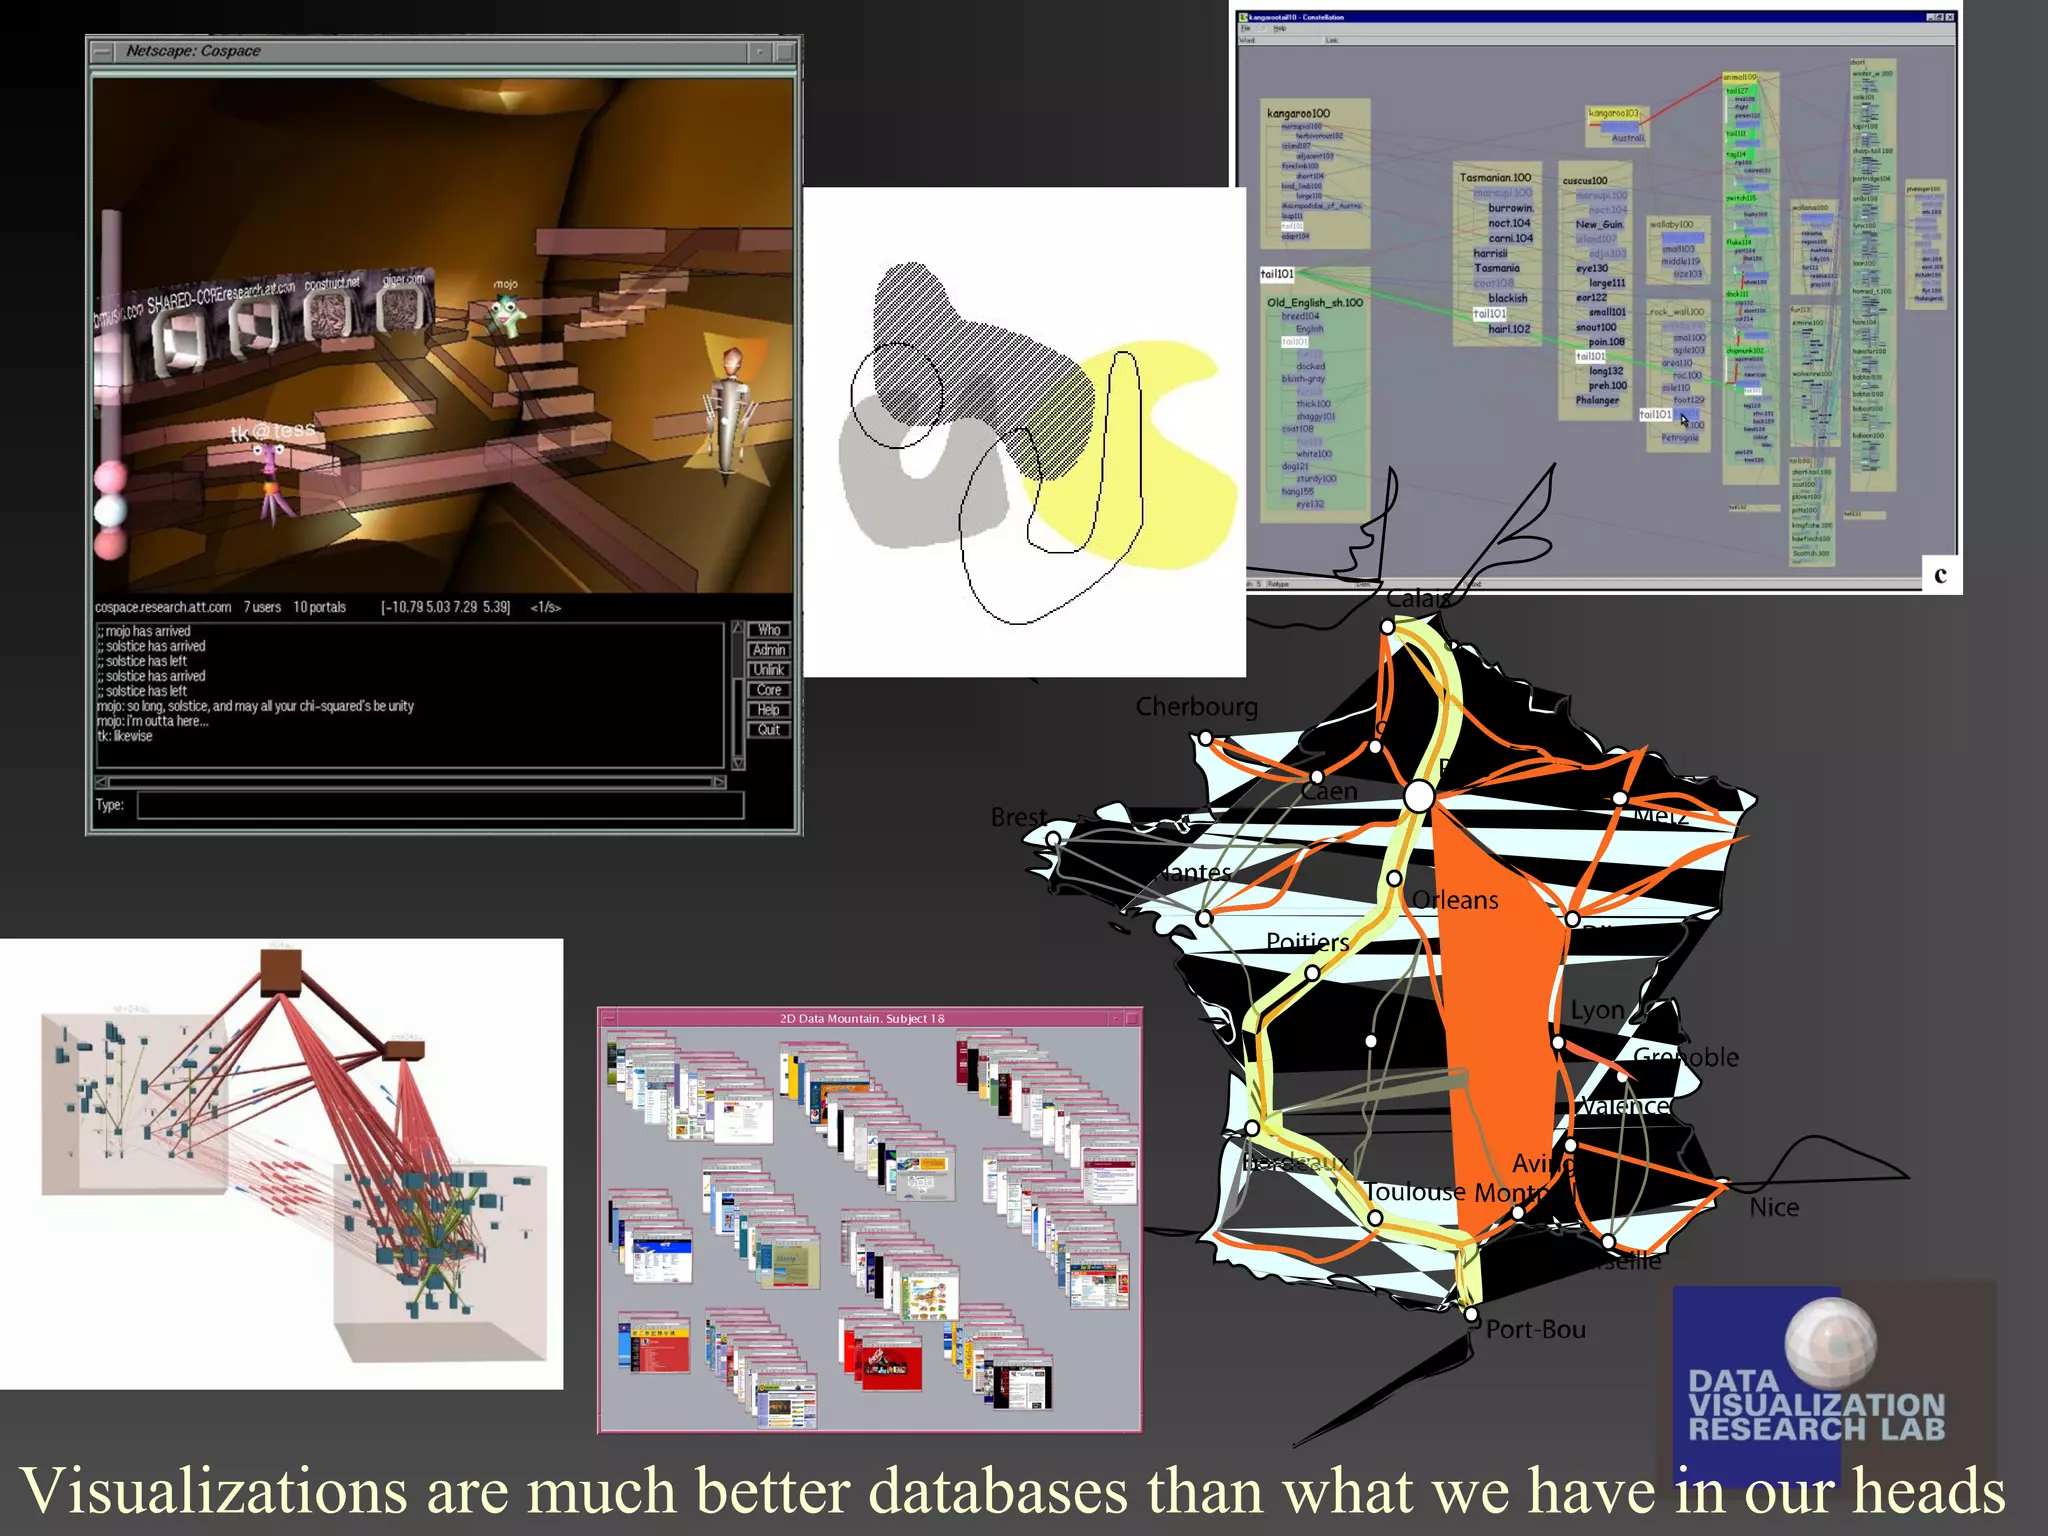
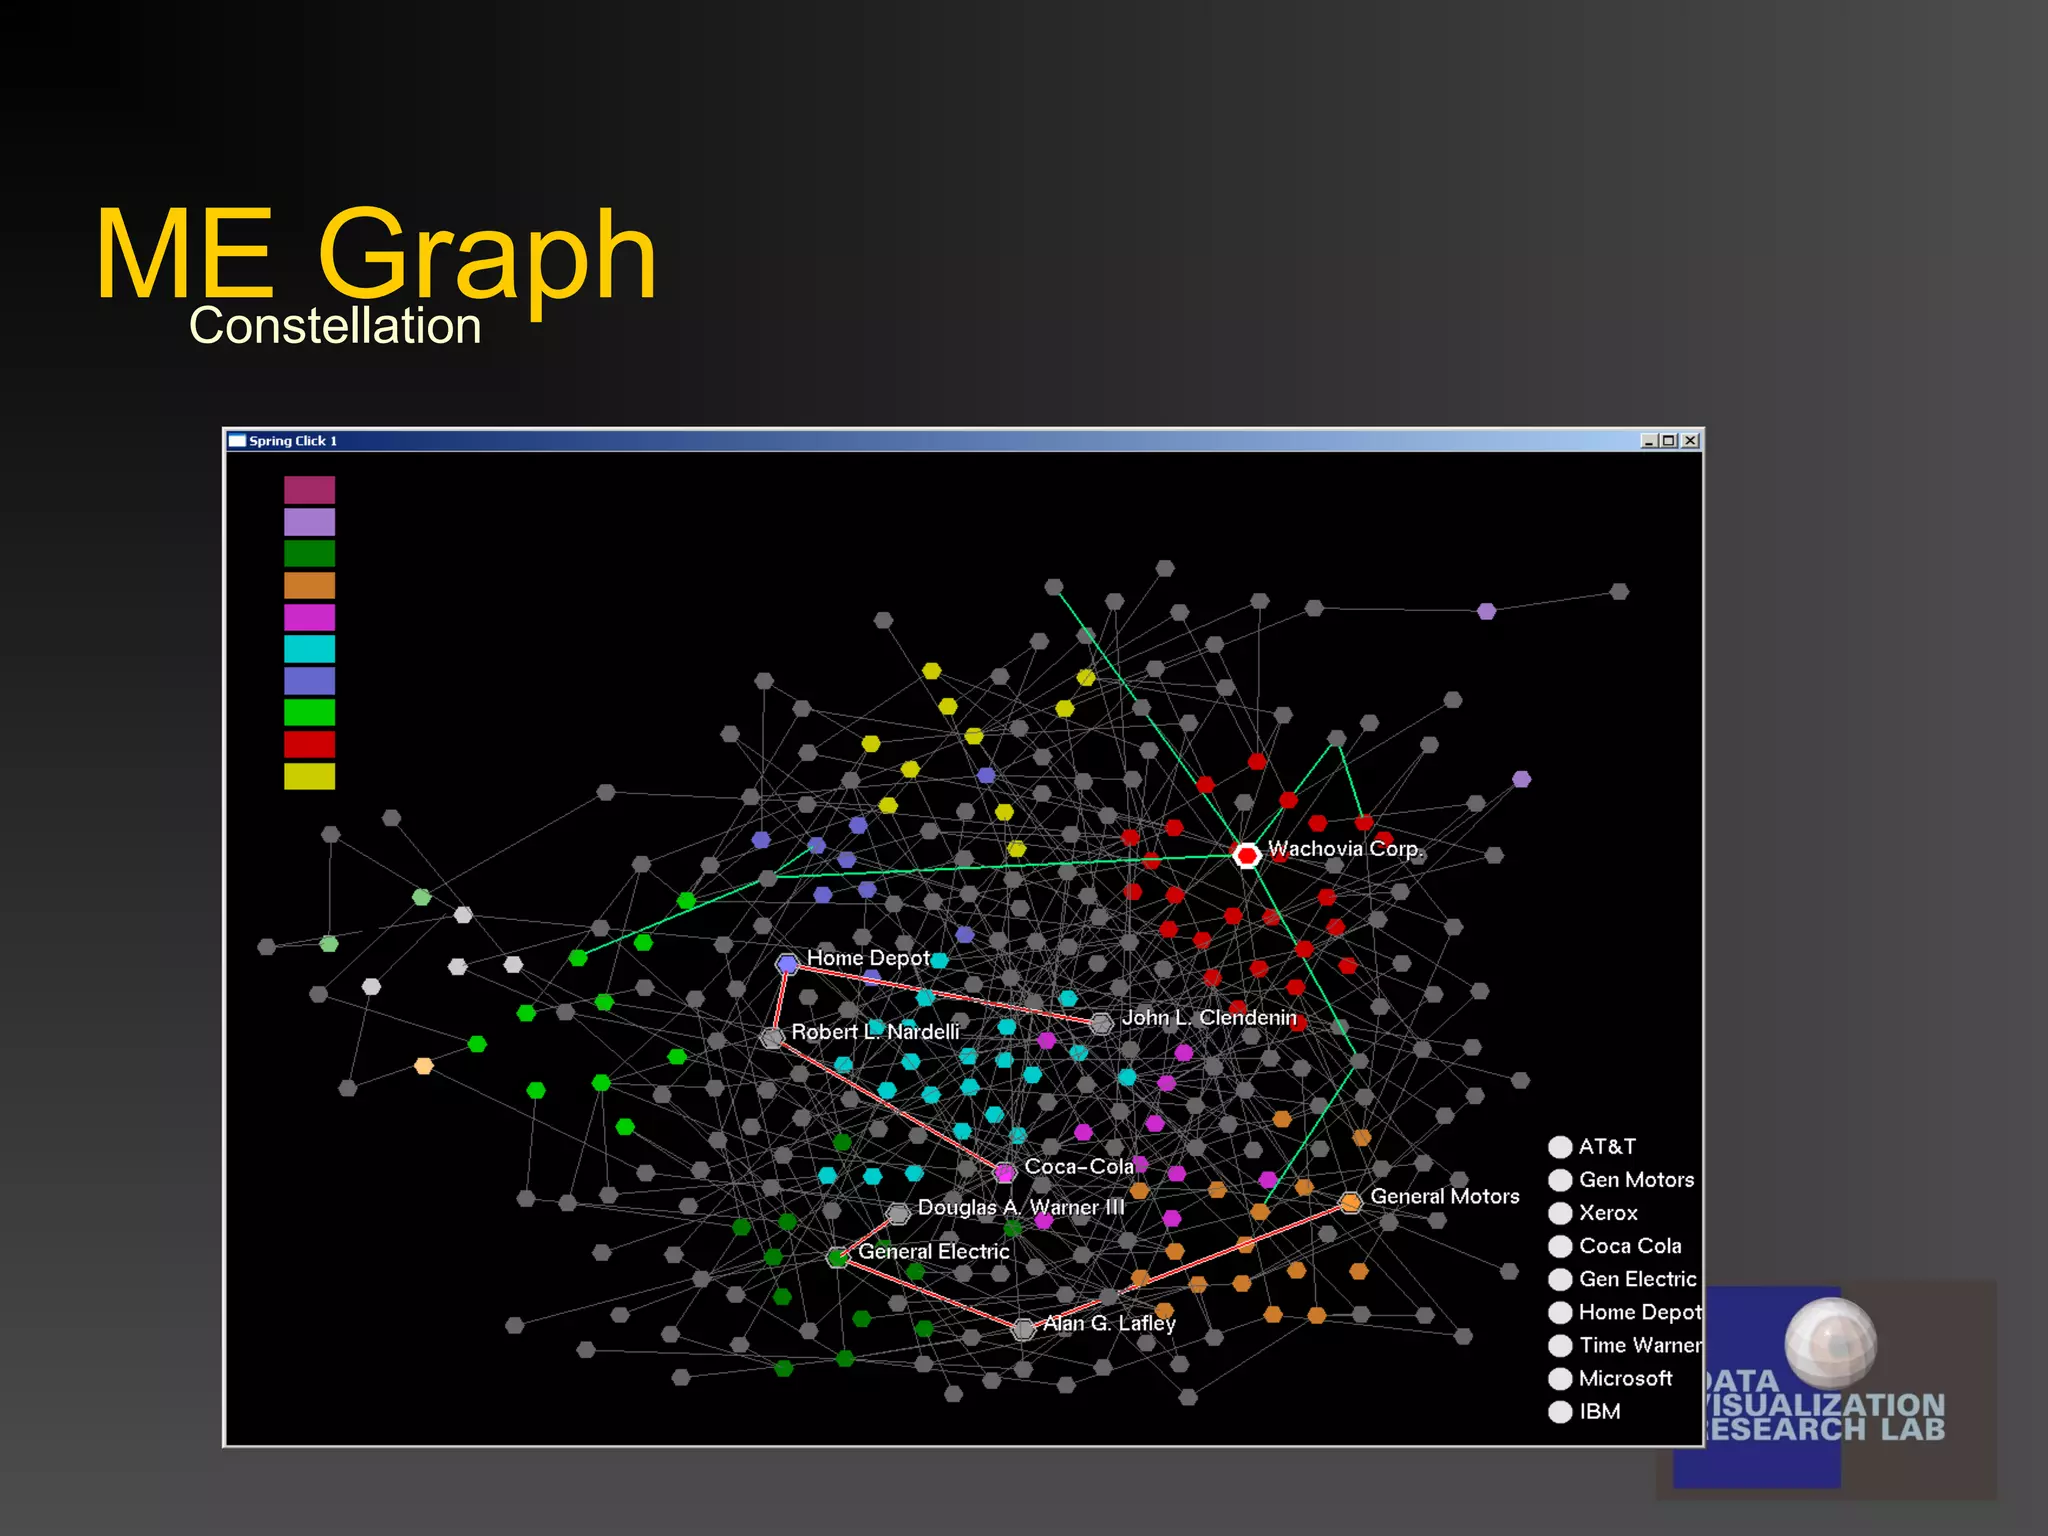
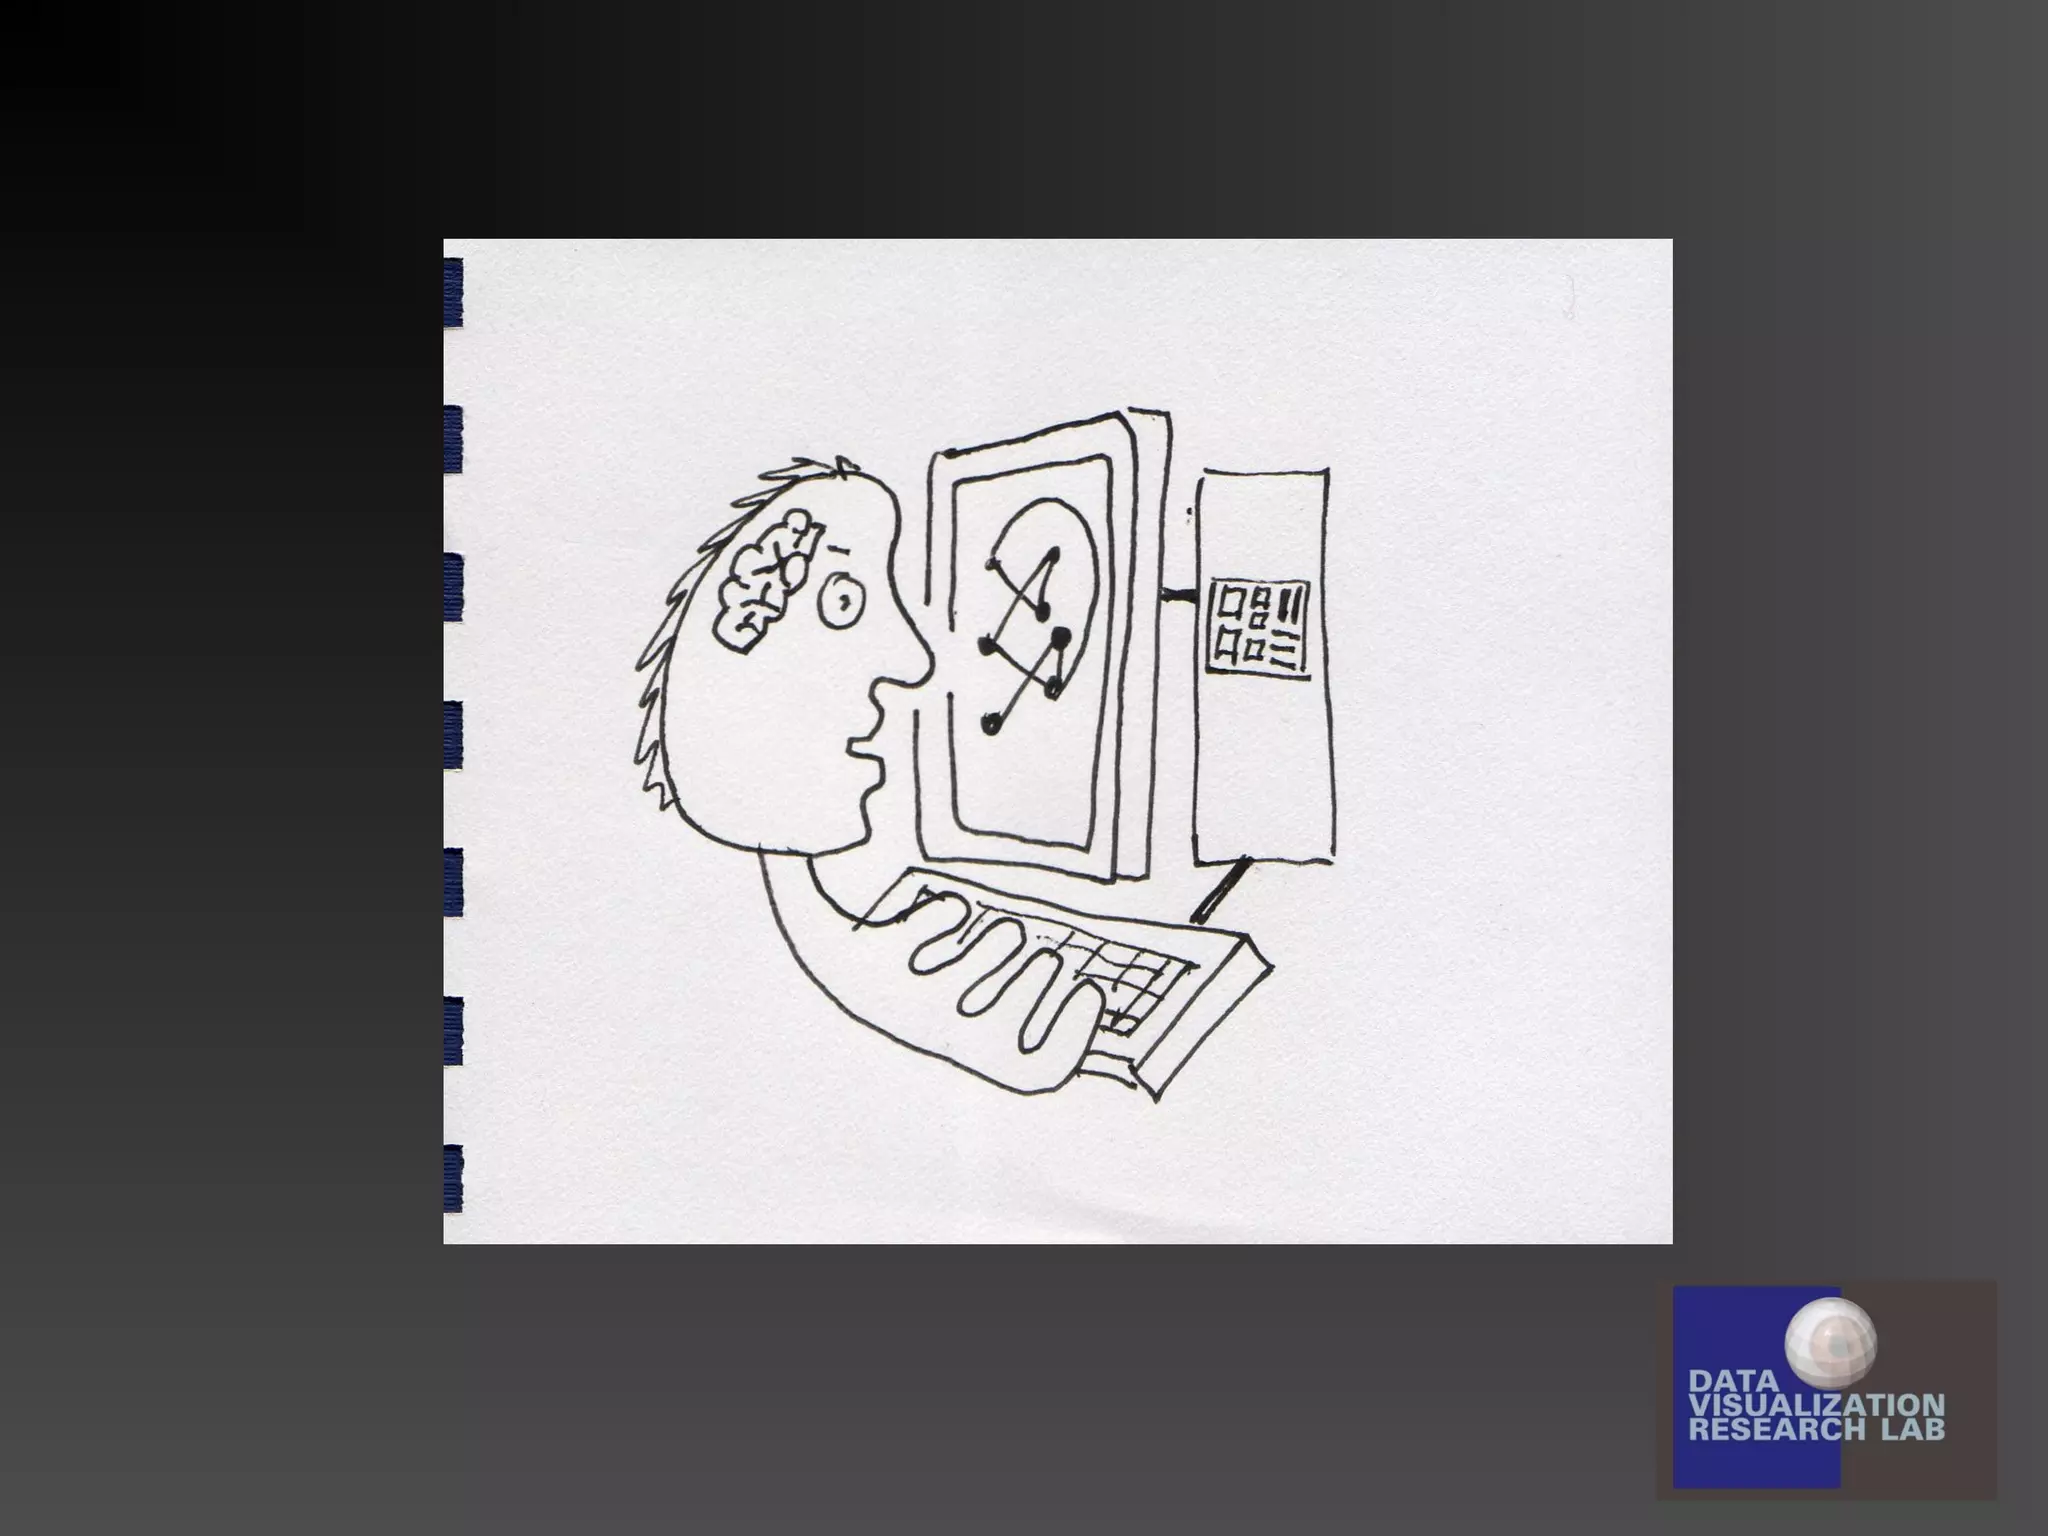
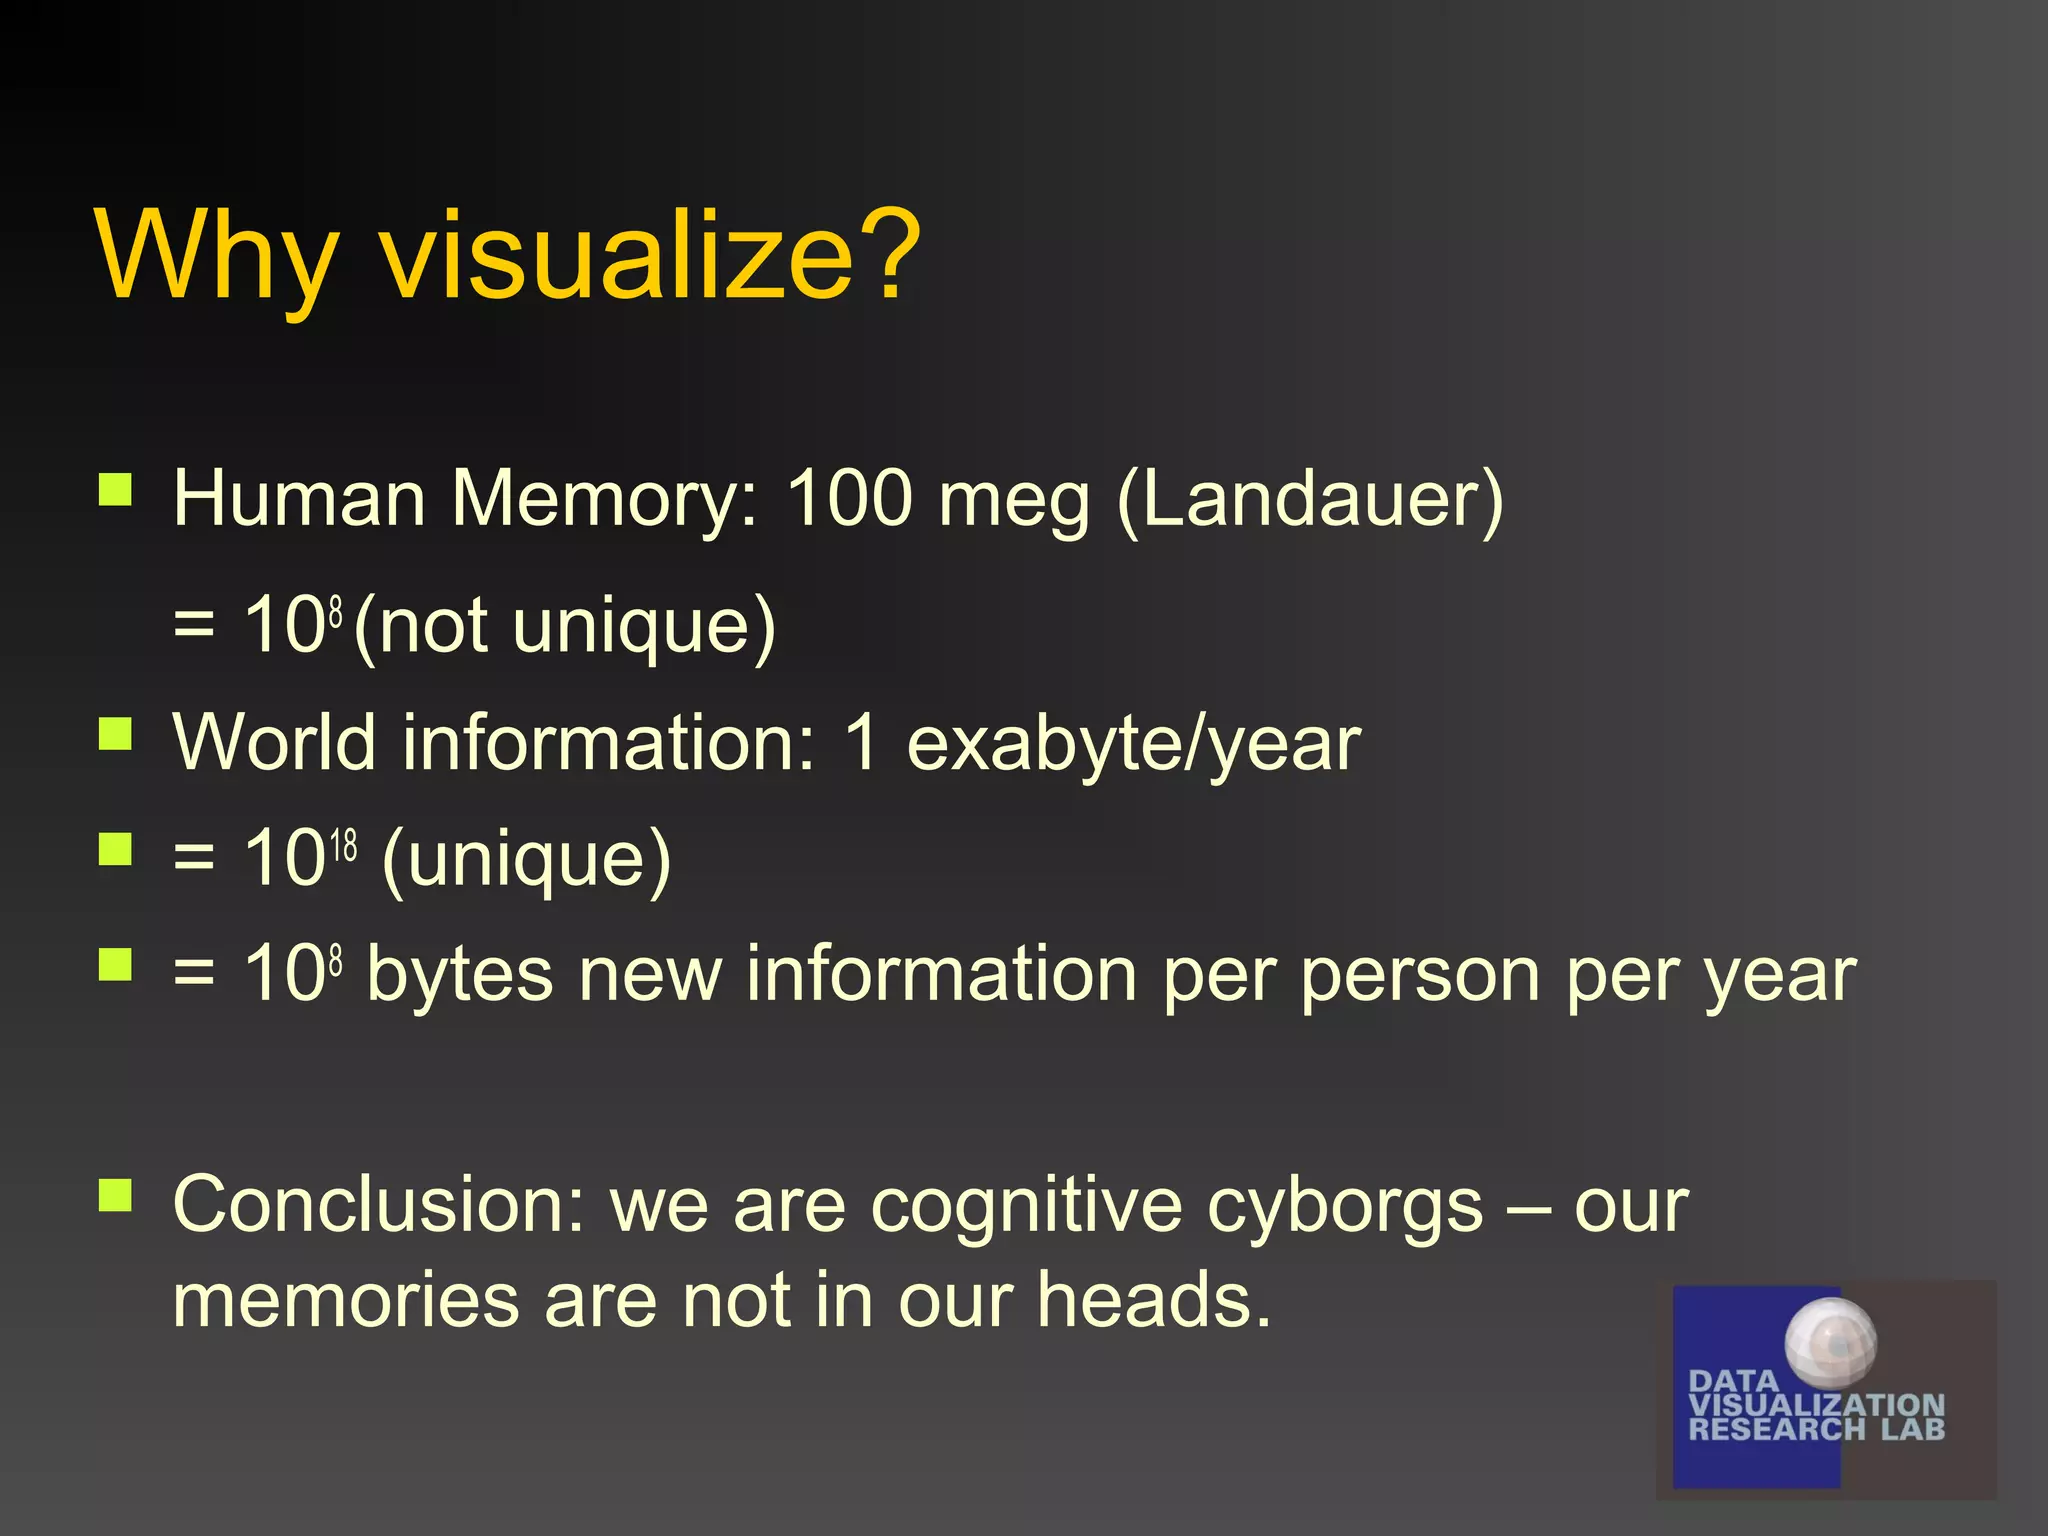
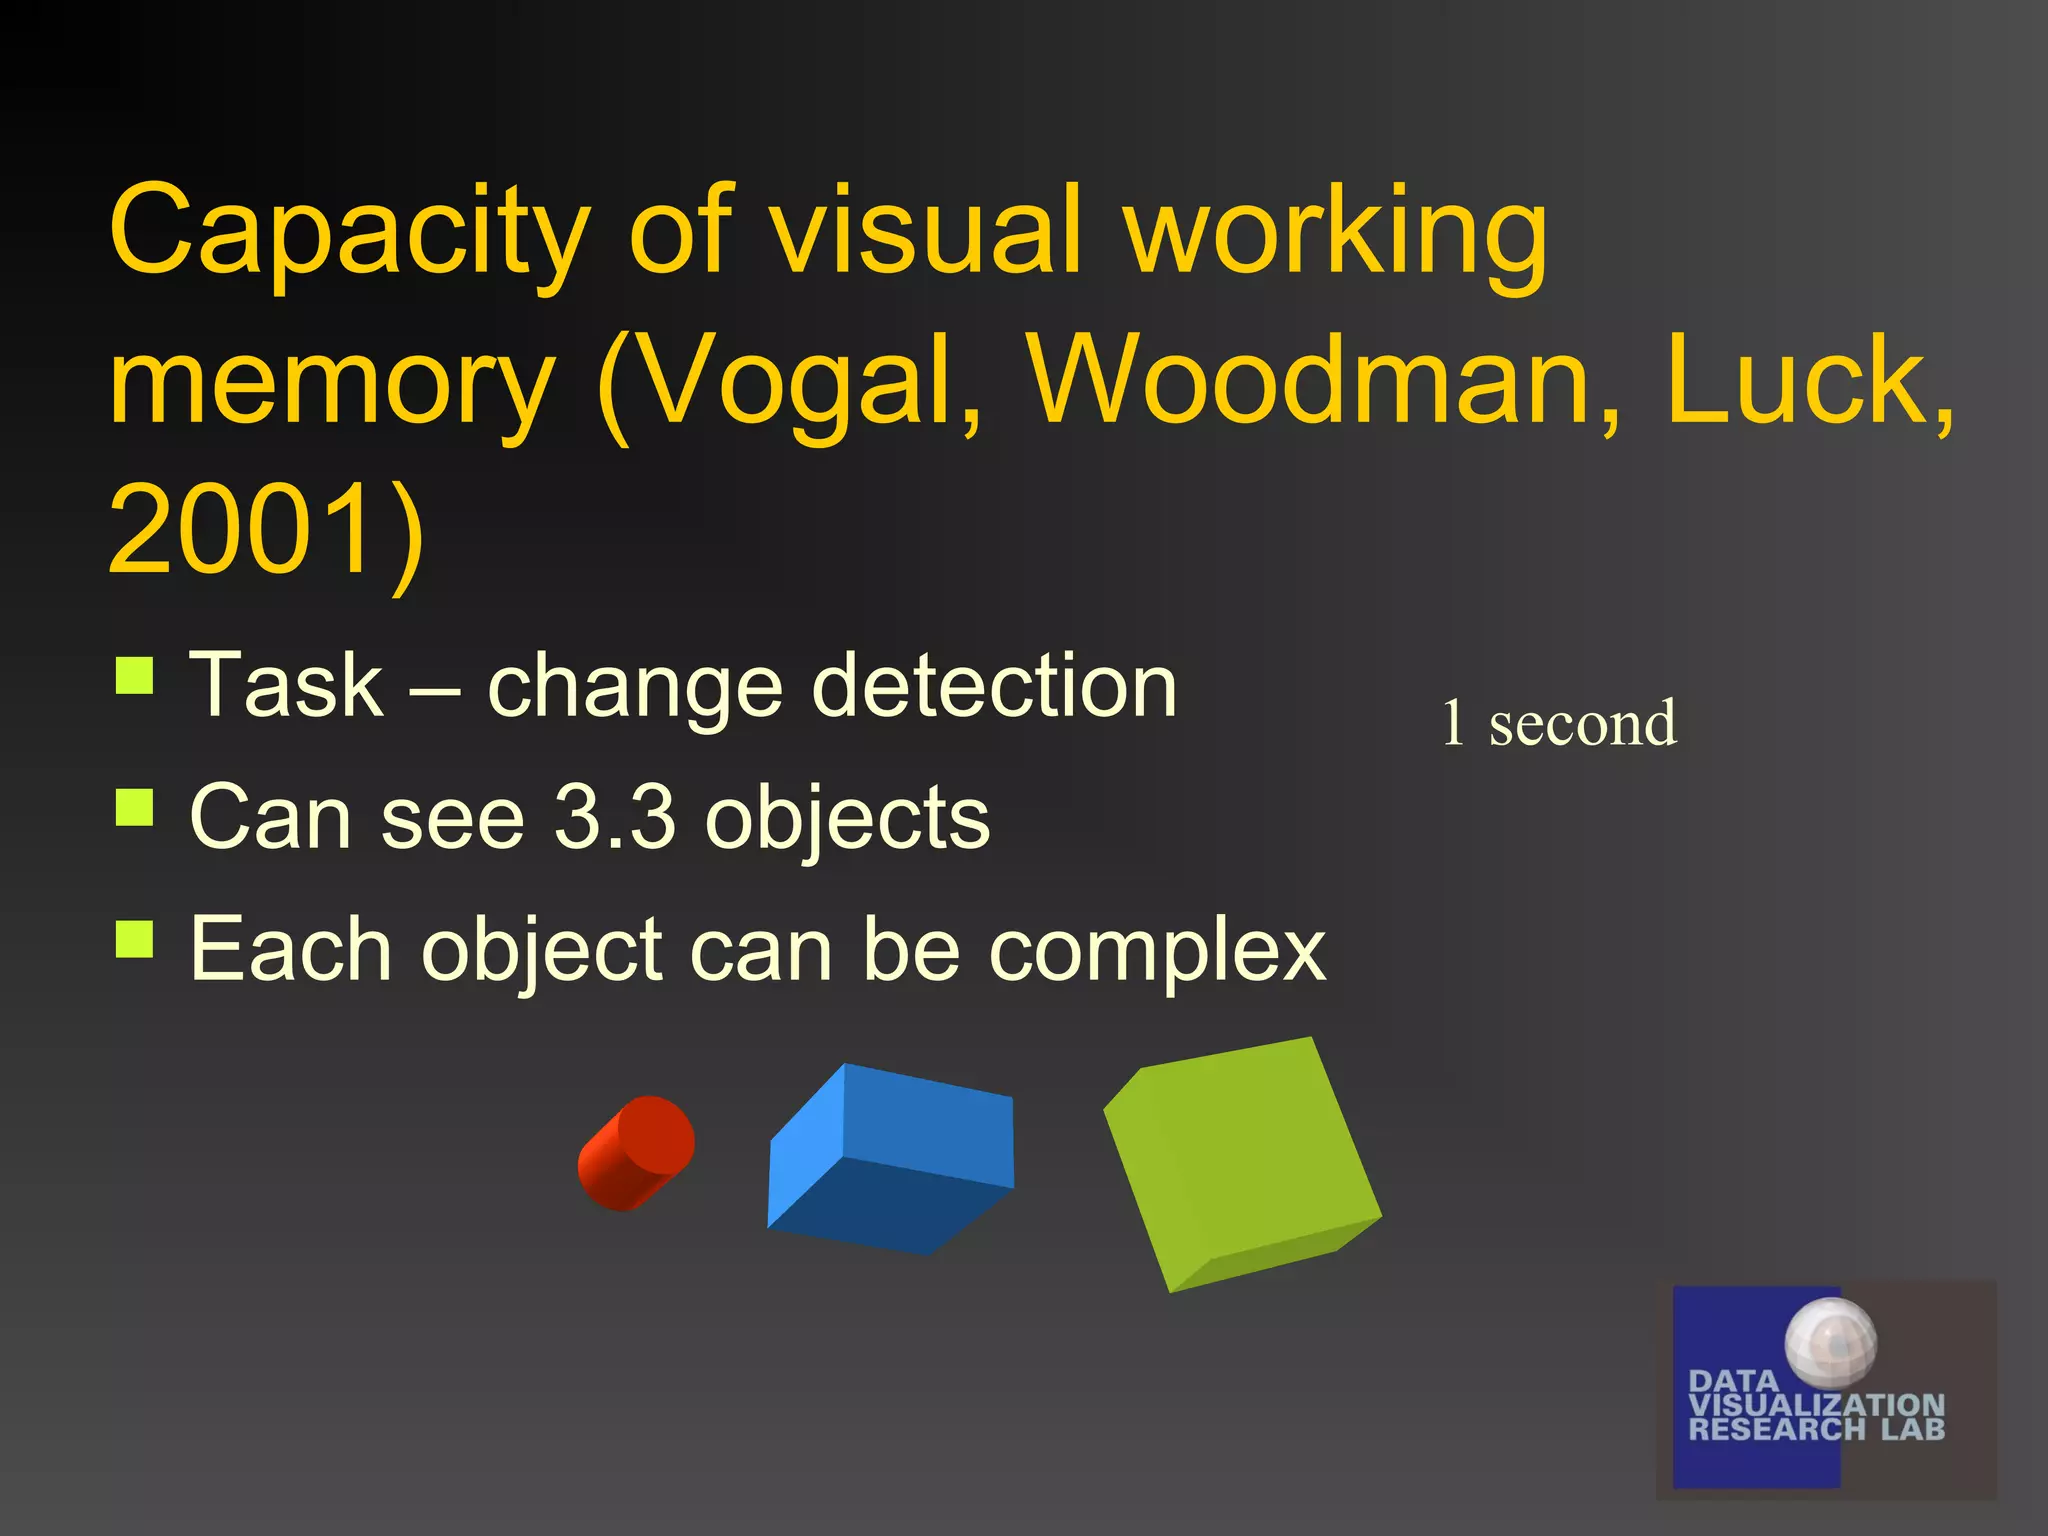
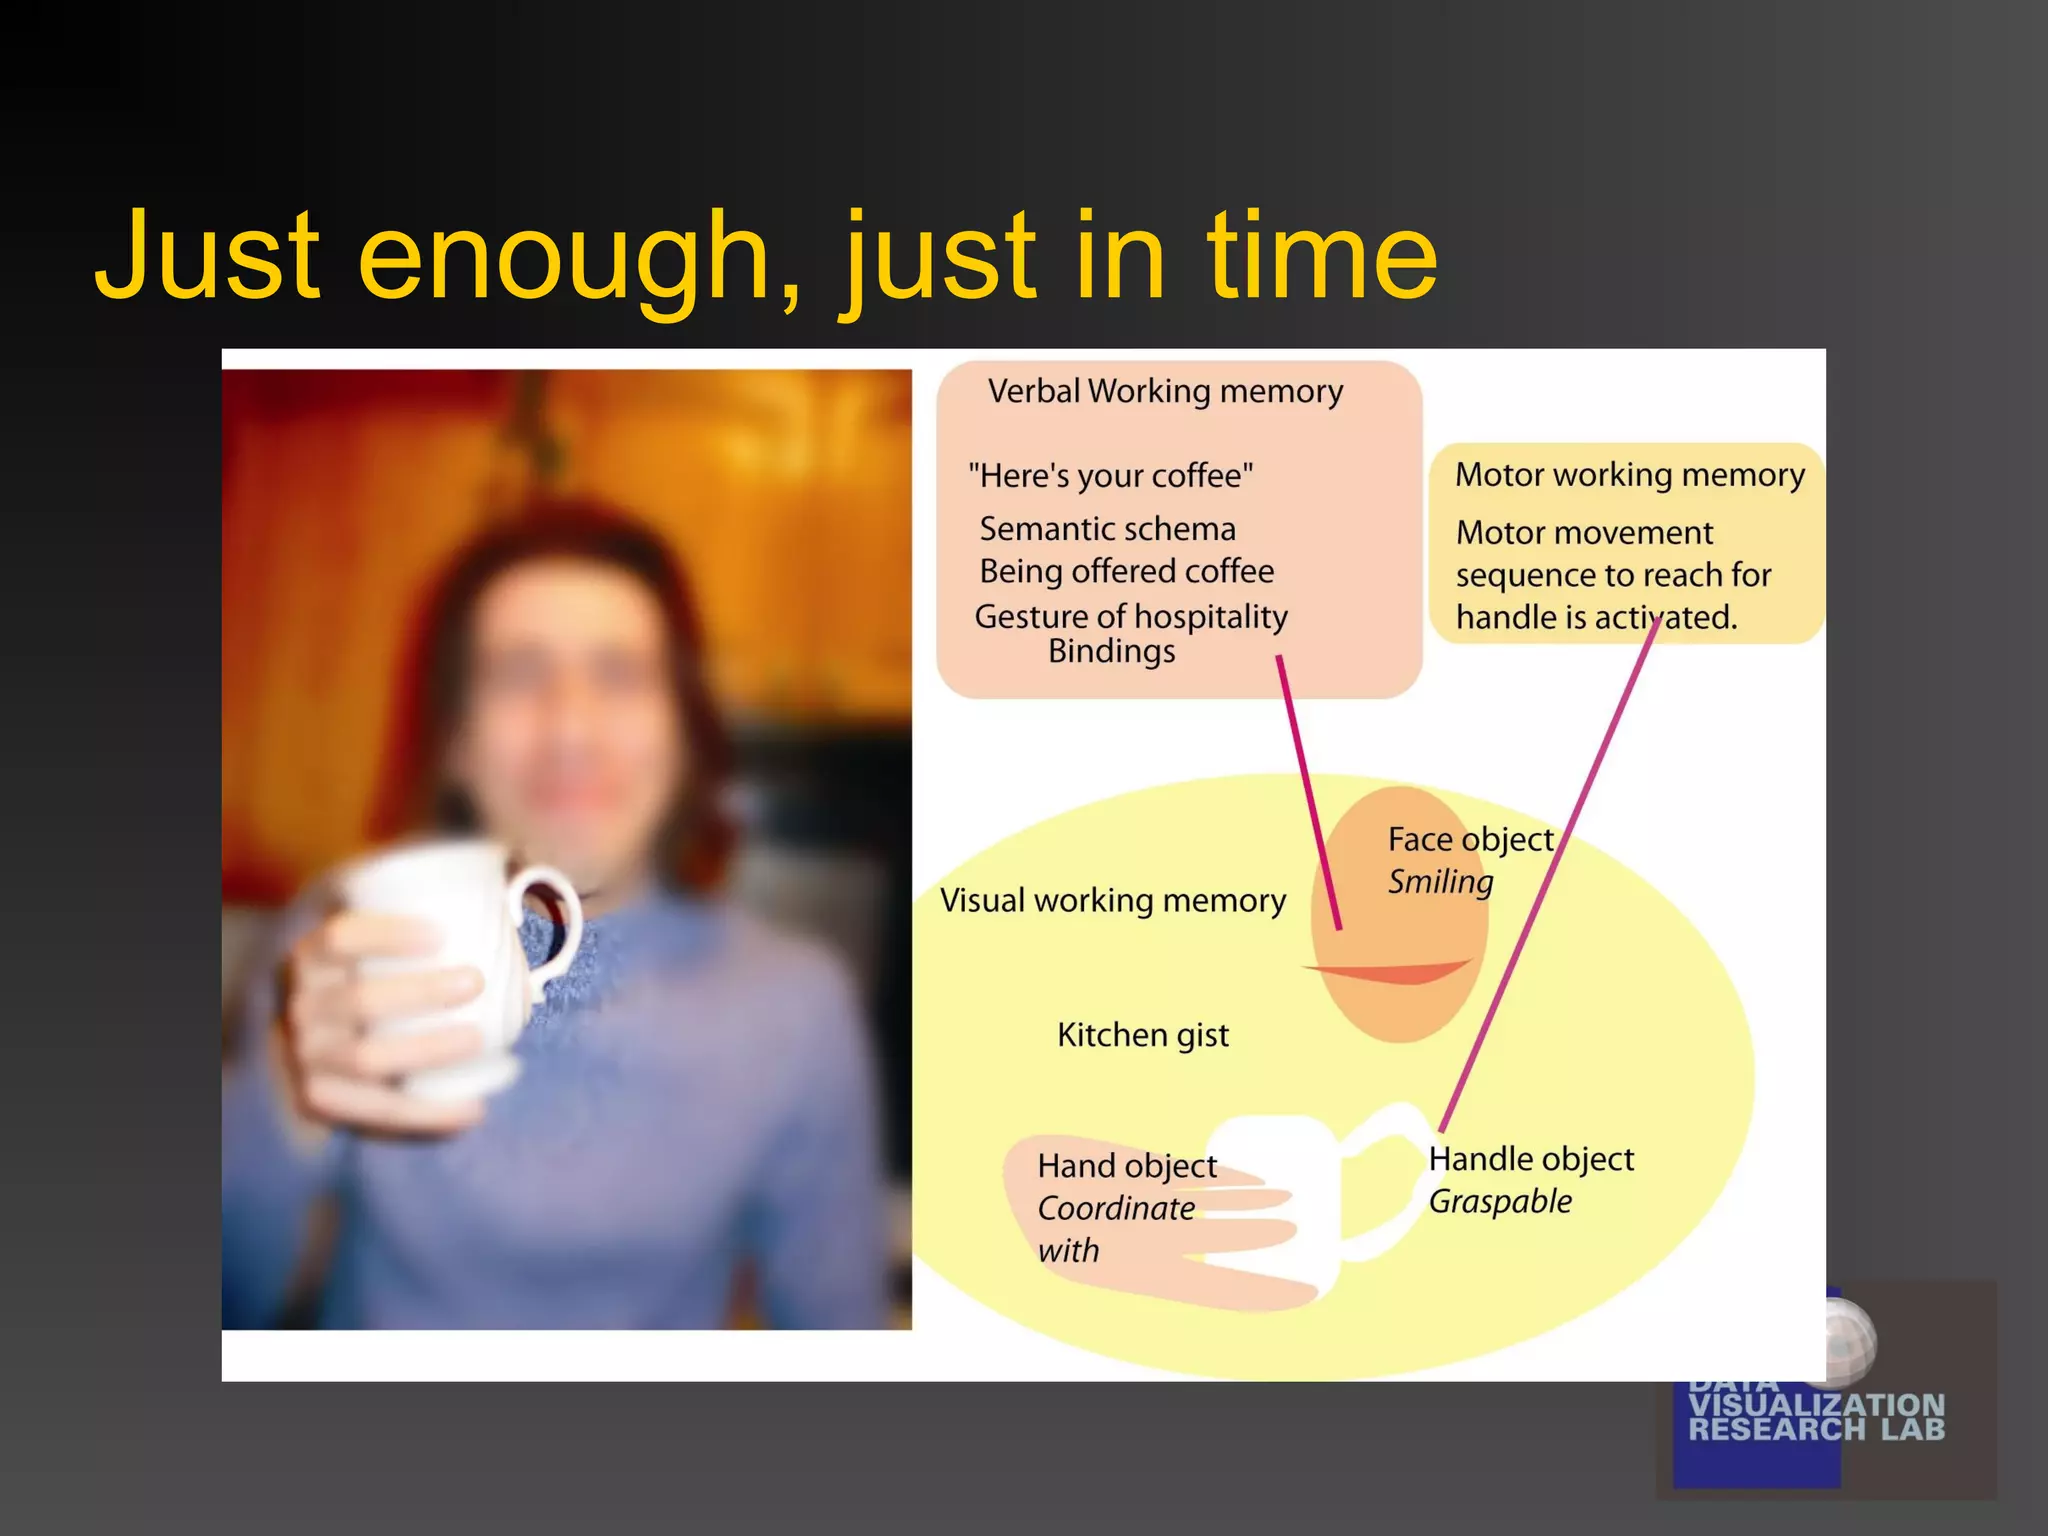
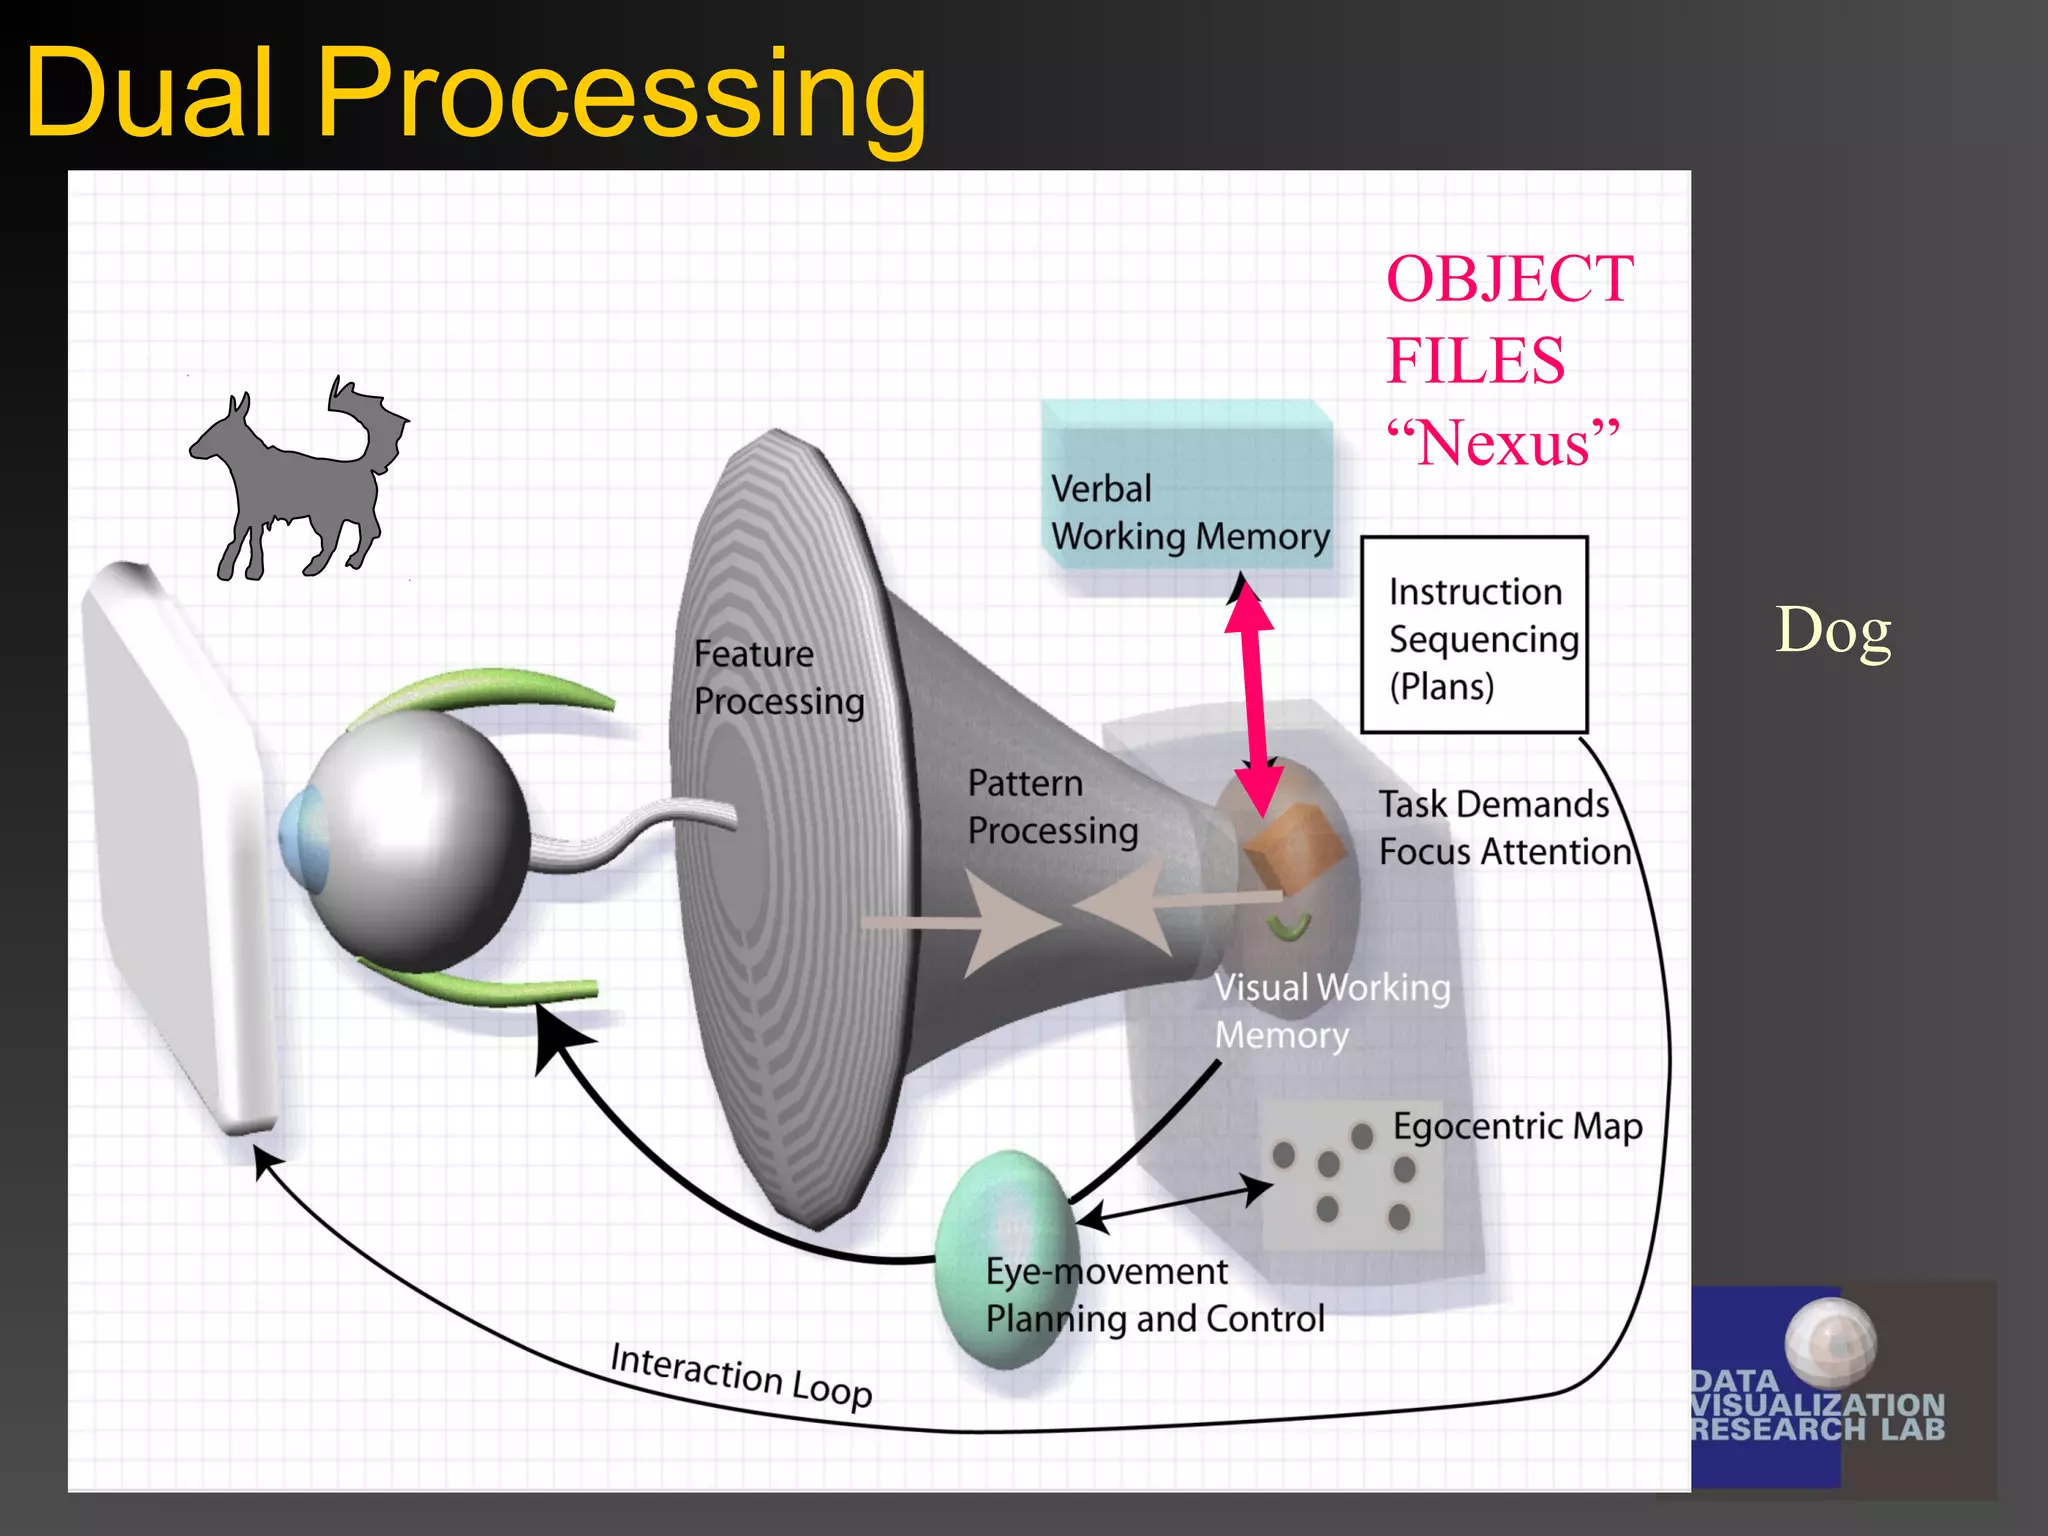
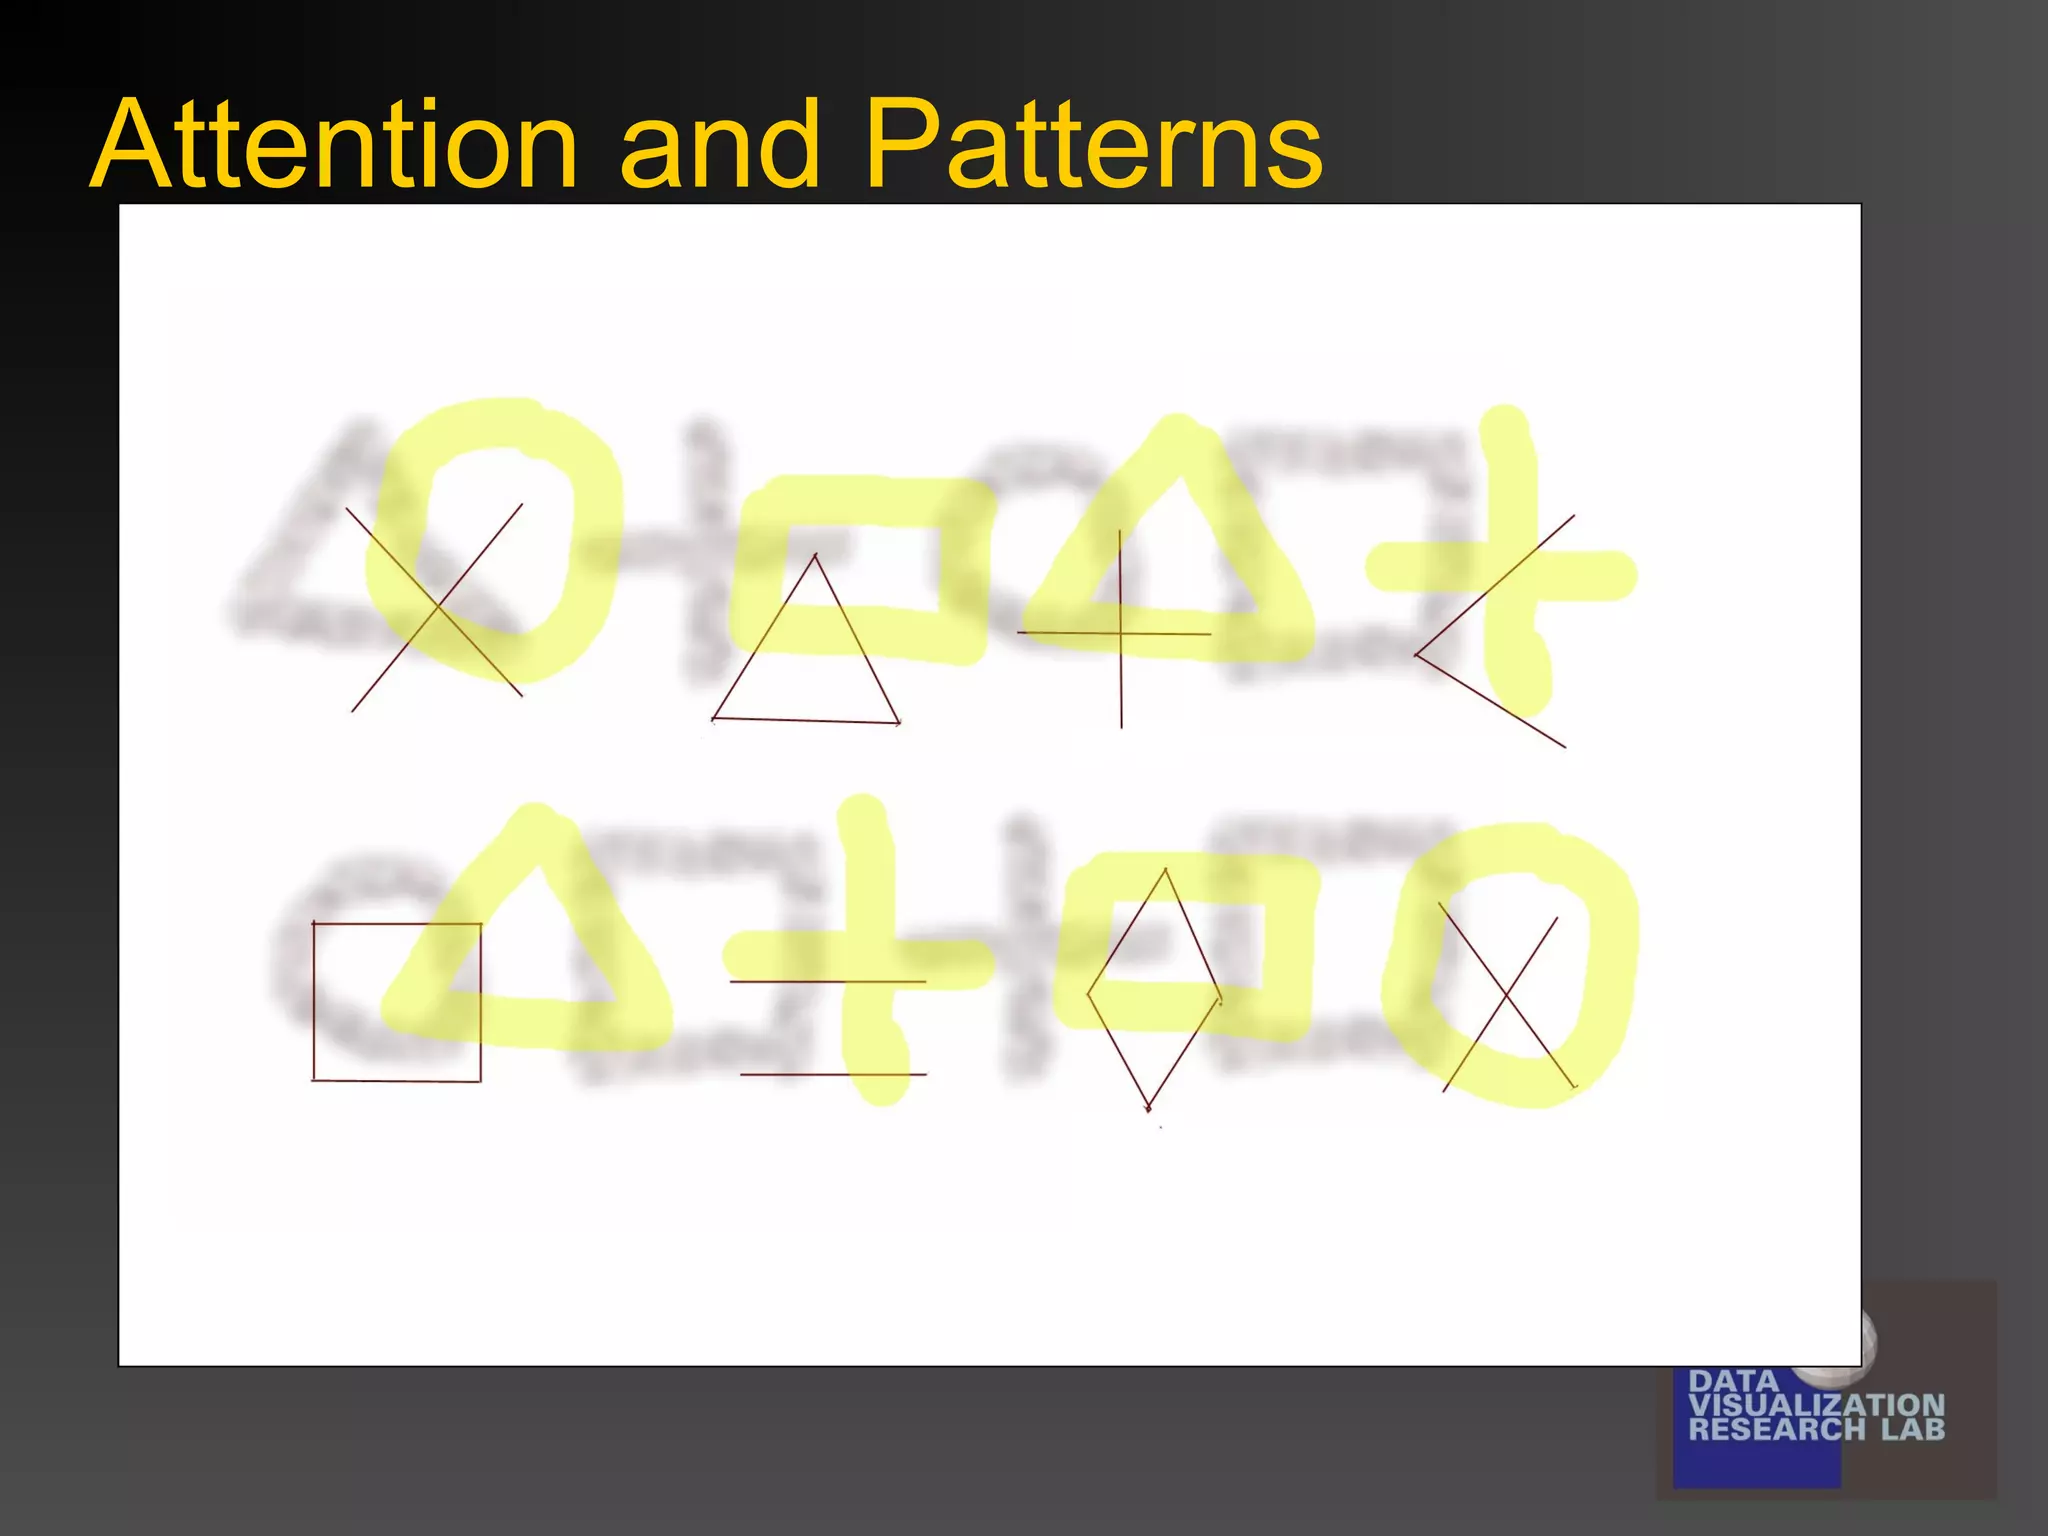
Visual Queries:
The foundation of visual thinking
Designing with
cyborgs in mind

Colin Ware
Data Visualization Research Lab
University of New Hampshire
Change Blindness

Simons and Levin
Vogel Woodman and Luck


Capacity of visual working memory 3
simple shapes
Sequential comparison task
Central Problem: How do we perceive
the world in all its rich detail?



Only detail in fovea
Only a small amount of Information in
visual working memory.
Solution



“The world is its own memory” O’Regan
Task-related active vision
“What you see is what you need”
Treish et al. (2003)



Seeing is a process that helps us solve problems




Visualizations are much better databases than what we have in our heads
Architecture for visual thinking
Stage 2 Pattern perception
Visual queries are executed by finding
patterns in displays

Attentional Demands
Tune the pattern finding processes
Top down meets bottom up
Visual search

U fu V al
se l isu
F ldo V
ie f iew

V a
isu l
Sa o
e rch r
M n rin
o ito g
S te y
tra g

Ee
y
Mv m t
o e en
Cn l
o tro
Eye movements


Two or three a second
Preserves Context



We seek patterns


ME Graph
Constellation
Why visualize?








Human Memory: 100 meg (Landauer)
= 108 (not unique)
World information: 1 exabyte/year
= 1018 (unique)
= 108 bytes new information per person per year
Conclusion: we are cognitive cyborgs – our
memories are not in our heads.
Why do we care about
perception?





It is about what makes information display
effective.
Can there be a science of visualization?
Evaluation
Visualizations


Maps








Multi-dimensional Discrete
Multi-dimensional continuous
Graphs





Social Networks
Flow

Narrative – explaining data




Route
Flow
Thematic (geology, vegetation, etc)

Animations, assembly diagrams

Other thinking tools


Calendars, Planners, search engines, News pages, Design tools
Understanding surface shape

Victoria Interrante
GeoZui4D

Linked
Windows
Tide
Aware
Show
GeoNav
Flow visualization


How do we optimally display vector fields?







Length - 420 ft
Beam – 82 ft
Draft – 29 ft

16,000 Tons
30,000 HP
Diesel Elec AC/AC

Fuel – 1,165,000 gal Top Speed – 17kts
Ice Breaking – 4.5 ft @ 3 kts
CAVE






Head tracking – stereo
Resolution problems
Light scattering problems
Vergence focus problem for near object
Occlusion problems for near objects
Immersion VR



HMD + head tracking
Data glove
Capacity of visual working
memory (Vogal, Woodman, Luck,
2001)




Task – change detection
Can see 3.3 objects
Each object can be complex

1 second
Just enough, just in time
Dual Processing

Display

Features
Proto-objects and
Patterns

Verbal
Working
Memory

OBJECT
FILES
“Nexus”

Visual
Working
Memory

Dog
GIST

Visual
Query

Egocentric object and
Pattern map
Attention and Patterns

Visual thinking colin_ware_lectures_2013_1_introduction

Editor's Notes

  • #2 John Horgan Herb Simon
  • #16 Low Level: Basic feature analys – determines what is seen with minimal effort Mid Level: Pattern finding – The demands of attention meets automatic processing High Level: Task related visual queries are formed – objects/ patterns are pulled into working memory and tested against the query - Need to have the right mappings for queries to be easily satisfied. Attention is focused to execute the query. Final element is the cost of search.
  • #17 The middle ground Visual queries are exectuted by finding patterns in displays Executed on the outputs of low level processing