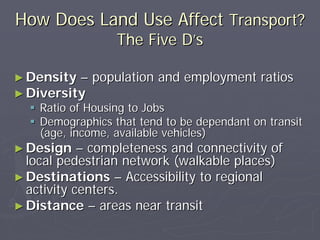
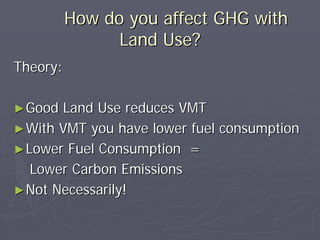
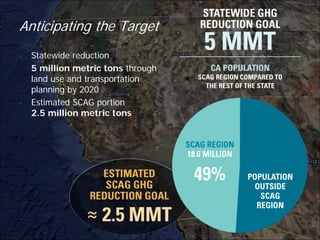
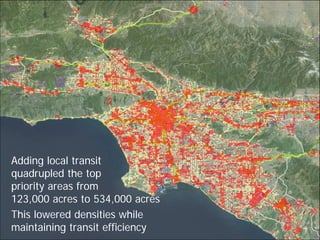
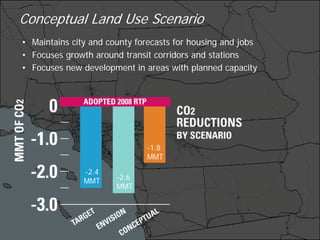
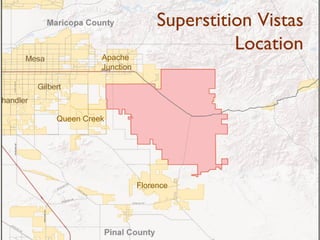
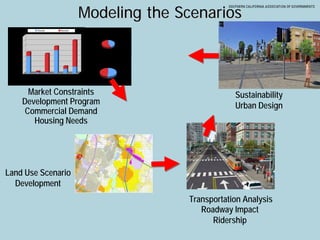
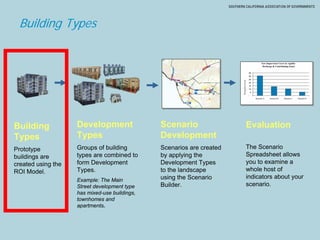
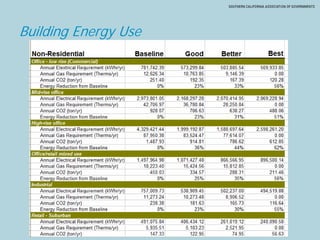
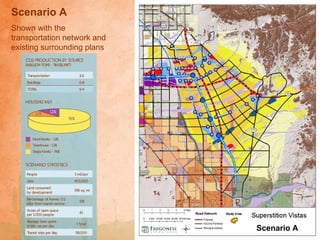
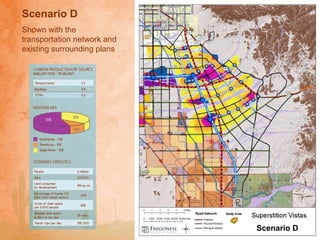
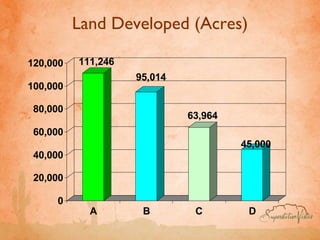
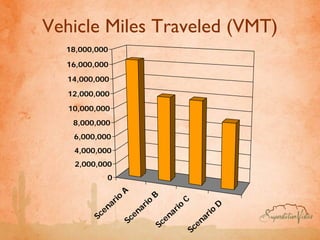
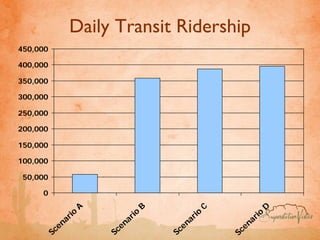
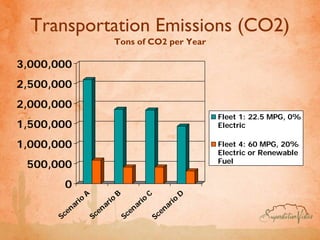
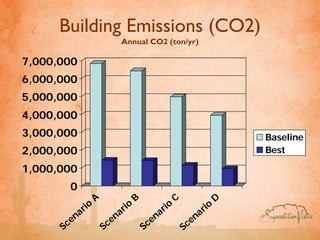
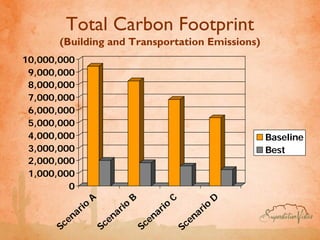
How does transportation and
  network planning address
 greenhouse gas emissions?
How Does Land Use Affect Transport?
                  The Five D’s

► Density –   population and employment ratios
► Diversity
    Ratio of Housing to Jobs
    Demographics that tend to be dependant on transit
    (age, income, available vehicles)
► Design    – completeness and connectivity of
  local pedestrian network (walkable places)
► Destinations – Accessibility to regional
  activity centers.
► Distance – areas near transit
How do you affect GHG with
                Land Use?
Theory:

► Good Land Use reduces VMT
► With VMT you have lower fuel consumption
► Lower Fuel Consumption =
   Lower Carbon Emissions
► Not Necessarily!
Issues to Consider
► How  much benefit can you get?
► Are there diminishing returns?
► Are there other positives?
► Are there some negatives?
SB 375
Conceptual Land Use Scenario
CA Climate Change Legislation
The Global Warming Solutions Act of 2006: Assembly Bill 32
California AB 32 Adopted Green House Gas
Reduction Estimates by Measures
Anticipating the Target
•   Statewide reduction
    5 million metric tons through
    land use and transportation
    planning by 2020
•   Estimated SCAG portion
    2.5 million metric tons
Adding local transit
quadrupled the top
priority areas from
123,000 acres to 534,000 acres
This lowered densities while
maintaining transit efficiency
Conceptual Land Use Scenario
• Maintains city and county forecasts for housing and jobs
• Focuses growth around transit corridors and stations
• Focuses new development in areas with planned capacity


                              -1.8
                              MMT
               -2.4
               MMT     -2.6
                       MMT
Superstition Vistas
                                    Location
          Apache
          Junction


Queen Creek


                     Florence
Modeling the Scenarios
                         Owner                  Renter                     Year 2000

  350,000

  300,000                                                                                43%

  250,000                                                            57%

  200,000

  150,000
                                                                           Vision 2030

  100,000

  50,000
                                                                    48%
     -                                                                                    52%
            SF Det    SF Att     MF   SF Det     SF Att      MF

                     Year 2000                 Vision 2030


              Market Constraints                                                                            Sustainability
            Development Program                                                                             Urban Design
             Commercial Demand
               Housing Needs


Land Use Scenario
  Development
                                                                                                Transportation Analysis
                                                                                                   Roadway Impact
                                                                                                      Ridership
Building Types


Building            Development                Scenario                Evaluation
Types               Types                      Development
Prototype           Groups of building         Scenarios are created   The Scenario
buildings are       types are combined to      by applying the         Spreadsheet allows
created using the   form Development           Development Types       you to examine a
ROI Model.          Types.                     to the landscape        whole host of
                                               using the Scenario      indicators about your
                    Example: The Main
                    Street development type    Builder.                scenario.
                    has mixed-use buildings,
                    townhomes and
                    apartments.
Building Energy Use
Lincoln Institute For Land Policy
Superstition Vistas
 Scenario Report

A Sustainable Community
   for the 21st Century


     September 2009
Scenario A
Shown with the
transportation network and
existing surrounding plans


                             Scenario A
What Life Could Be Like in Scenario A


                   Nort
                          h
Scenario D
Shown with the
transportation network and
existing surrounding plans


                             Scenario D
What Life Could Be Like in Scenario D


                   Nort
                          h
Land Developed (Acres)

120,000   111,246
                    95,014
100,000

 80,000
                             63,964
 60,000
                                      45,000
 40,000

 20,000

     0
            A        B        C        D
Vehicle Miles Traveled (VMT)
  18,000,000

  16,000,000

  14,000,000

   12,000,000
   10,000,000
    8,000,000
    6,000,000
    4,000,000
    2,000,000
             0
                     A
                  io            B
                 r            o             C
              na
                          a ri           io            D
            e                           r            o
          Sc            en           na           ar
                                                    i
                      Sc          ce            en
                                 S
                                              Sc
Trip Counts – Walk & Bike
                                             2,000,000
                                             1,800,000
                                             1,600,000
                                             1,400,000
                                             1,200,000
                  Percent of Trips           1,000,000
                                               800,000

                                     19%
                                               600,000
              D
    na
       ri
          o                                    400,000
   e
Sc                                   19%
              C                                200,000
         io
       ar
Sc
     en
                               17%
                                                      0
              B
     ar
       io
                                                               A
                                                                           B
                                                         rio
   en
Sc
                                                                                        C
                                                                     rio
                         11%
                                                       a
                                                     en            a              rio                   D
              A

                                                                                                  rio
       io

                                                                 en
     ar
   en     0%       5%    10%   15%     20%
                                                   Sc                          na               a
                                                               Sc
Sc
                                                                             e
                                                                           Sc                 en
                                                                                            Sc
Daily Transit Ridership
450,000

400,000

350,000

300,000

250,000

200,000

150,000

100,000

 50,000

     0
                      A               B               C                D
              a rio           a rio           a rio              rio
            en              en              en              e na
          Sc              Sc              Sc              Sc
Transportation Emissions (CO2)
                               Tons of CO2 per Year

3,000,000
2,500,000
2,000,000
                                                                   Fleet 1: 22.5 MPG, 0%
1,500,000                                                          Electric

1,000,000                                                          Fleet 4: 60 MPG, 20%
                                                                   Electric or Renewable
                                                                   Fuel
 500,000
        0
                   A               B              C            D
              io              io              i o          i o
          n ar            n ar            n ar           ar
                                                       n
       Sce             Sce             Sce          Sce
Building Emissions (CO2)
                           Annual CO2 (ton/yr)

7,000,000
6,000,000
5,000,000
4,000,000
3,000,000                                                             Baseline
2,000,000                                                             Best

1,000,000
        0
                  A               B               C               D
            rio             rio             rio             rio
         na              na              na              na
      Sce             Sce             Sce             Sce
Total Carbon Footprint
       (Building and Transportation Emissions)
10,000,000
 9,000,000
 8,000,000
 7,000,000
 6,000,000
 5,000,000
 4,000,000                                                             Baseline
 3,000,000                                                             Best
 2,000,000
 1,000,000
         0
                   A               B               C               D
             rio             rio             rio             rio
          na              na              na              na
       Sce             Sce             Sce             Sce
Homes for a Changing Region
The Original Homes for a
      Changing Region Report
• Presented regional housing
  forecast for 2030
• Forecast a mismatch
  between supply and demand
• Provided specific
  recommendations for
  creating more housing
  options
Building Prototype Modeling
Carbon Footprint by Prototype


                                              Carbon Footprint (in Tons of Annual CO2 Emissions Per Unit)

              25


              20
Tons of CO2


              15


              10


                  5


              -
                      2-STORY SINGLE FAMILY     2-STORY TOWNHOUSE     3-STORY MULTIFAMILY        5-STORY MIXED-USE   8-STORY MULTIFAMILY

                                                                      Standard   Good   Better
Plainfield
Will County Governmental League
Plainfield – Carbon Footprint

                         Annual Carbon Footprint of Build-Out Alternatives (in tons of CO2)

250,000

                       211,322

200,000


                                                     38% reduction
150,000
                                                              130,695
                                                                                        50% reduction
                                                                                                   106,457
100,000


 50,000


    -
            Trend w ith Standard Buildings        Balanced w ith Standard Buildings     Balanced w ith Better Buildings
Density Does Not Always Lead to
    Lower Carbon Footprint
14,000


12,000


10,000


 8,000


 6,000


 4,000


 2,000


    0
                                                        R
                           FL
               IL


                                           A


                                                                  AZ
                                                        O
                                            C
                ,


                        i,
              go


                                                                  x,
                                                     d,
                                         h,
                       m


                                                                ni
            ca


                                                   an
                                      ac
                     ia


                                                              oe
                    M
         hi


                                    Be


                                                  rtl
     C


                                                            Ph
                                                Po
                                    o
                                    d
                                  on
                                ed
                                R
Comparing trip to work


Redondo Beach     Portland
Good Place to do Density
Example:
Zupans Grocery store in
Portland, Oregon

Was the original
redevelopment project
in an up-and-coming
neighborhood

It served as an anchor
and catalyst for
additional housing
projects
NOT a good place to do density
Transit has a Carbon Footprint
► Transit   has a Carbon Footprint
Fuel type, efficiency, and passenger load
are critical in determining carbon benefit
Transit must improve its carbon footprint


     5 miles per gallon     50 miles per gallon
      10 passengers            1 passenger
Cultural differences account for
     some of the problem
        Germany vs. US
Germany vs. US
Conclusions
►   Land use helps reduce carbon
       But it is small contribution
       Top concerns are vehicles, fuels, electricity generation, building
       technology
►   Increasing density DOES NOT reduce carbon emissions!!!
       Design is more important
►   The better cars and buildings get, the less benefit from
    land use design
►   Land use had carbon benefits outside vehicles
       Better count it! We need all we can get!
       Water consumption has a carbon effect too
Yes, it has a lower carbon footprint,
  but primarily, it’s more liveable!

How Does Transportation and Network Planning Address Network Planning Address Greenhouse Gas Emissions?

  • 1.
    How does transportationand network planning address greenhouse gas emissions?
  • 2.
    How Does LandUse Affect Transport? The Five D’s ► Density – population and employment ratios ► Diversity Ratio of Housing to Jobs Demographics that tend to be dependant on transit (age, income, available vehicles) ► Design – completeness and connectivity of local pedestrian network (walkable places) ► Destinations – Accessibility to regional activity centers. ► Distance – areas near transit
  • 3.
    How do youaffect GHG with Land Use? Theory: ► Good Land Use reduces VMT ► With VMT you have lower fuel consumption ► Lower Fuel Consumption = Lower Carbon Emissions ► Not Necessarily!
  • 4.
    Issues to Consider ►How much benefit can you get? ► Are there diminishing returns? ► Are there other positives? ► Are there some negatives?
  • 5.
  • 6.
    CA Climate ChangeLegislation The Global Warming Solutions Act of 2006: Assembly Bill 32
  • 7.
    California AB 32Adopted Green House Gas Reduction Estimates by Measures
  • 8.
    Anticipating the Target • Statewide reduction 5 million metric tons through land use and transportation planning by 2020 • Estimated SCAG portion 2.5 million metric tons
  • 9.
    Adding local transit quadrupledthe top priority areas from 123,000 acres to 534,000 acres This lowered densities while maintaining transit efficiency
  • 10.
    Conceptual Land UseScenario • Maintains city and county forecasts for housing and jobs • Focuses growth around transit corridors and stations • Focuses new development in areas with planned capacity -1.8 MMT -2.4 MMT -2.6 MMT
  • 12.
    Superstition Vistas Location Apache Junction Queen Creek Florence
  • 13.
    Modeling the Scenarios Owner Renter Year 2000 350,000 300,000 43% 250,000 57% 200,000 150,000 Vision 2030 100,000 50,000 48% - 52% SF Det SF Att MF SF Det SF Att MF Year 2000 Vision 2030 Market Constraints Sustainability Development Program Urban Design Commercial Demand Housing Needs Land Use Scenario Development Transportation Analysis Roadway Impact Ridership
  • 14.
    Building Types Building Development Scenario Evaluation Types Types Development Prototype Groups of building Scenarios are created The Scenario buildings are types are combined to by applying the Spreadsheet allows created using the form Development Development Types you to examine a ROI Model. Types. to the landscape whole host of using the Scenario indicators about your Example: The Main Street development type Builder. scenario. has mixed-use buildings, townhomes and apartments.
  • 15.
  • 16.
  • 17.
    Superstition Vistas ScenarioReport A Sustainable Community for the 21st Century September 2009
  • 18.
    Scenario A Shown withthe transportation network and existing surrounding plans Scenario A
  • 19.
    What Life CouldBe Like in Scenario A Nort h
  • 20.
    Scenario D Shown withthe transportation network and existing surrounding plans Scenario D
  • 21.
    What Life CouldBe Like in Scenario D Nort h
  • 22.
    Land Developed (Acres) 120,000 111,246 95,014 100,000 80,000 63,964 60,000 45,000 40,000 20,000 0 A B C D
  • 23.
    Vehicle Miles Traveled(VMT) 18,000,000 16,000,000 14,000,000 12,000,000 10,000,000 8,000,000 6,000,000 4,000,000 2,000,000 0 A io B r o C na a ri io D e r o Sc en na ar i Sc ce en S Sc
  • 24.
    Trip Counts –Walk & Bike 2,000,000 1,800,000 1,600,000 1,400,000 1,200,000 Percent of Trips 1,000,000 800,000 19% 600,000 D na ri o 400,000 e Sc 19% C 200,000 io ar Sc en 17% 0 B ar io A B rio en Sc C rio 11% a en a rio D A rio io en ar en 0% 5% 10% 15% 20% Sc na a Sc Sc e Sc en Sc
  • 25.
    Daily Transit Ridership 450,000 400,000 350,000 300,000 250,000 200,000 150,000 100,000 50,000 0 A B C D a rio a rio a rio rio en en en e na Sc Sc Sc Sc
  • 26.
    Transportation Emissions (CO2) Tons of CO2 per Year 3,000,000 2,500,000 2,000,000 Fleet 1: 22.5 MPG, 0% 1,500,000 Electric 1,000,000 Fleet 4: 60 MPG, 20% Electric or Renewable Fuel 500,000 0 A B C D io io i o i o n ar n ar n ar ar n Sce Sce Sce Sce
  • 27.
    Building Emissions (CO2) Annual CO2 (ton/yr) 7,000,000 6,000,000 5,000,000 4,000,000 3,000,000 Baseline 2,000,000 Best 1,000,000 0 A B C D rio rio rio rio na na na na Sce Sce Sce Sce
  • 28.
    Total Carbon Footprint (Building and Transportation Emissions) 10,000,000 9,000,000 8,000,000 7,000,000 6,000,000 5,000,000 4,000,000 Baseline 3,000,000 Best 2,000,000 1,000,000 0 A B C D rio rio rio rio na na na na Sce Sce Sce Sce
  • 29.
    Homes for aChanging Region
  • 30.
    The Original Homesfor a Changing Region Report • Presented regional housing forecast for 2030 • Forecast a mismatch between supply and demand • Provided specific recommendations for creating more housing options
  • 31.
  • 32.
    Carbon Footprint byPrototype Carbon Footprint (in Tons of Annual CO2 Emissions Per Unit) 25 20 Tons of CO2 15 10 5 - 2-STORY SINGLE FAMILY 2-STORY TOWNHOUSE 3-STORY MULTIFAMILY 5-STORY MIXED-USE 8-STORY MULTIFAMILY Standard Good Better
  • 33.
  • 34.
    Plainfield – CarbonFootprint Annual Carbon Footprint of Build-Out Alternatives (in tons of CO2) 250,000 211,322 200,000 38% reduction 150,000 130,695 50% reduction 106,457 100,000 50,000 - Trend w ith Standard Buildings Balanced w ith Standard Buildings Balanced w ith Better Buildings
  • 35.
    Density Does NotAlways Lead to Lower Carbon Footprint 14,000 12,000 10,000 8,000 6,000 4,000 2,000 0 R FL IL A AZ O C , i, go x, d, h, m ni ca an ac ia oe M hi Be rtl C Ph Po o d on ed R
  • 36.
    Comparing trip towork Redondo Beach Portland
  • 37.
    Good Place todo Density Example: Zupans Grocery store in Portland, Oregon Was the original redevelopment project in an up-and-coming neighborhood It served as an anchor and catalyst for additional housing projects
  • 42.
    NOT a goodplace to do density
  • 43.
    Transit has aCarbon Footprint ► Transit has a Carbon Footprint
  • 44.
    Fuel type, efficiency,and passenger load are critical in determining carbon benefit Transit must improve its carbon footprint 5 miles per gallon 50 miles per gallon 10 passengers 1 passenger
  • 45.
    Cultural differences accountfor some of the problem Germany vs. US
  • 46.
  • 47.
    Conclusions ► Land use helps reduce carbon But it is small contribution Top concerns are vehicles, fuels, electricity generation, building technology ► Increasing density DOES NOT reduce carbon emissions!!! Design is more important ► The better cars and buildings get, the less benefit from land use design ► Land use had carbon benefits outside vehicles Better count it! We need all we can get! Water consumption has a carbon effect too
  • 48.
    Yes, it hasa lower carbon footprint, but primarily, it’s more liveable!