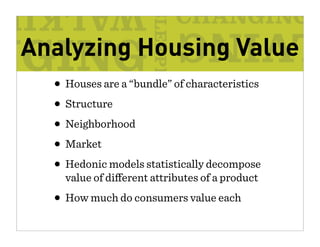
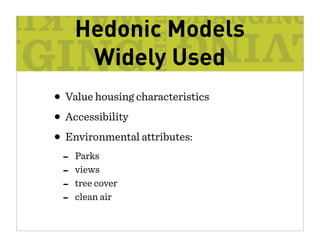
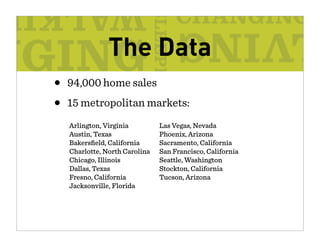
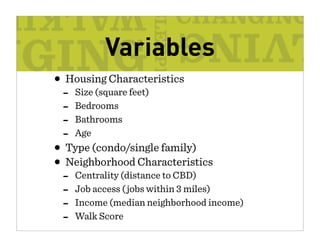
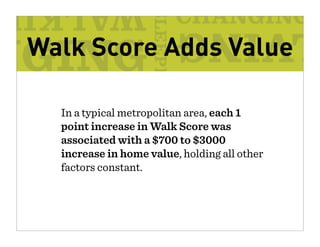
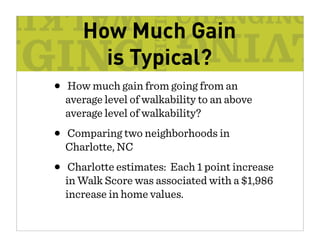
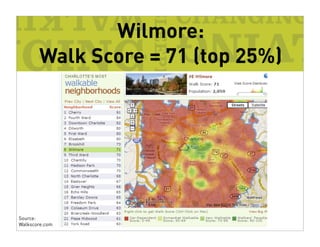
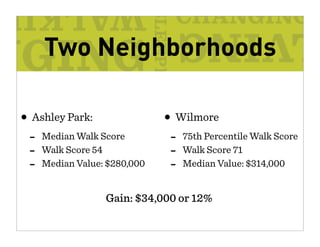
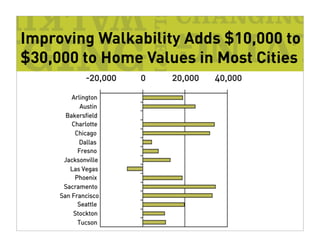
Walking
the Walk
How Walkability
Increases Home
Prices in U.S. Cities
By Joseph Cortright for


Supported by a generous grant from
the Richard H. Driehaus Foundation
Road Map
• Walkability
• Walk Score
• Hedonic Modeling
• The Value of Walkability
• Implications
Walkability and Value

• Cities are about access
• Walkable places have the highest levels of
  access
• Walkability has value
Walking and Cities
• “The Sidewalk Ballet” - Jane Jacobs
• Characteristics:
  - Short blocks, connected streets
  - Sidewalks
  - A mix of uses and housing types
• How do we measure “walkability”?
It’s All about Destinations


            • It’s not just about
              sidewalks.
            • Are there places you
              can walk to?
www.walkscore.com
Walk Score Destinations
  •   Grocery Store
  •   Restaurant
  •   Co ee Shop
  •   Bar
  •   Movie Theater
  •   School
  •   Park
  •   Library
  •   Bookstore
  •   Fitness
  •   Drug Store
  •   Hardware Store
  •   Clothing and Music Store
How Walk Score is Computed

   • Straight-line distance to nearest
     destination in each of 13 categories
   • Relies on Google Maps database
   • Doesn’t address topography, sidewalks,
     street connectivity or built environment
Walk Score Values
• 90–100 = Walkers' Paradise
• 70–89 = Very Walkable
• 50–69 = Somewhat Walkable
• 25–49 = Car-Dependent
• 0–24 = Car-Dependent (Driving Only)
Walkability Varies
         by Neighborhood


Source: Walkscore.com
Analyzing Housing Value
  • Houses are a “bundle” of characteristics
  • Structure
  • Neighborhood
  • Market
  • Hedonic models statistically decompose
    value of di erent attributes of a product
  • How much do consumers value each
Hedonic Models
      Widely Used
• Value housing characteristics
• Accessibility
• Environmental attributes:
 -   Parks
 -   views
 -   tree cover
 -   clean air
The Data
• 94,000 home sales
• 15 metropolitan markets:
   Arlington, Virginia         Las Vegas, Nevada
   Austin, Texas               Phoenix, Arizona
   Bakersfield, California      Sacramento, California
   Charlotte, North Carolina   San Francisco, California
   Chicago, Illinois           Seattle, Washington
   Dallas, Texas               Stockton, California
   Fresno, California          Tucson, Arizona
   Jacksonville, Florida
Variables
• Housing Characteristics
 -   Size (square feet)
 -   Bedrooms
 -   Bathrooms
 -   Age
• Type (condo/single family)
• Neighborhood Characteristics
 -   Centrality (distance to CBD)
 -   Job access ( jobs within 3 miles)
 -   Income (median neighborhood income)
 -   Walk Score
Model Results
• After controlling for other observable
  di erences in housing and neighborhoods,
  walkability had a statistically significant
  positive e ect on housing values in 13 of 15
  metropolitan areas

• One metro had a negative walkability e    ect
  (Las Vegas); one was statistically insignificant
  (Bakersfield)

• Estimates of other variables were consistent
  with published studies of housing values
Walk Score Adds Value

  In a typical metropolitan area, each 1
  point increase in Walk Score was
  associated with a $700 to $3000
  increase in home value, holding all other
  factors constant.
How Much Gain
       is Typical?
• How much gain from going from an
  average level of walkability to an above
  average level of walkability?
• Comparing two neighborhoods in
  Charlotte, NC
• Charlotte estimates: Each 1 point increase
  in Walk Score was associated with a $1,986
  increase in home values.
Ashley Park:
        Walk Score = 54 (median)


Source:
Walkscore.com
Wilmore:
       Walk Score = 71 (top 25%)


Source:
Walkscore.com
Two Neighborhoods

• Ashley Park:                • Wilmore
 -   Median Walk Score         -   75th Percentile Walk Score
 -   Walk Score 54             -   Walk Score 71
 -   Median Value: $280,000    -   Median Value: $314,000


                  Gain: $34,000 or 12%
Improving Walkability Adds $10,000 to
$30,000 to Home Values in Most Cities
Implications
• Improving walkability helps maintain and
  increase housing values
• Walkability is shaped by public and private
  decisions: land use and development
• Mixed-use development produces big
  walkability gains
• Transit access often coincides with high
  walkability
Walking the Walk

• Walkability adds value to residential
  property
• Strong evidence of a market demand for
  walkable, mixed-use development
Walking the Walk

              Thank you.

For more information or a copy of the
full report, contact Sheila Redick at
sredick@ceosforcities.org.

Walking The Walk

  • 1.
    Walking the Walk How Walkability IncreasesHome Prices in U.S. Cities By Joseph Cortright for Supported by a generous grant from the Richard H. Driehaus Foundation
  • 2.
    Road Map • Walkability •Walk Score • Hedonic Modeling • The Value of Walkability • Implications
  • 3.
    Walkability and Value •Cities are about access • Walkable places have the highest levels of access • Walkability has value
  • 4.
    Walking and Cities •“The Sidewalk Ballet” - Jane Jacobs • Characteristics: - Short blocks, connected streets - Sidewalks - A mix of uses and housing types • How do we measure “walkability”?
  • 5.
    It’s All aboutDestinations • It’s not just about sidewalks. • Are there places you can walk to?
  • 6.
  • 7.
    Walk Score Destinations • Grocery Store • Restaurant • Co ee Shop • Bar • Movie Theater • School • Park • Library • Bookstore • Fitness • Drug Store • Hardware Store • Clothing and Music Store
  • 8.
    How Walk Scoreis Computed • Straight-line distance to nearest destination in each of 13 categories • Relies on Google Maps database • Doesn’t address topography, sidewalks, street connectivity or built environment
  • 9.
    Walk Score Values •90–100 = Walkers' Paradise • 70–89 = Very Walkable • 50–69 = Somewhat Walkable • 25–49 = Car-Dependent • 0–24 = Car-Dependent (Driving Only)
  • 10.
    Walkability Varies by Neighborhood Source: Walkscore.com
  • 11.
    Analyzing Housing Value • Houses are a “bundle” of characteristics • Structure • Neighborhood • Market • Hedonic models statistically decompose value of di erent attributes of a product • How much do consumers value each
  • 12.
    Hedonic Models Widely Used • Value housing characteristics • Accessibility • Environmental attributes: - Parks - views - tree cover - clean air
  • 13.
    The Data • 94,000home sales • 15 metropolitan markets: Arlington, Virginia Las Vegas, Nevada Austin, Texas Phoenix, Arizona Bakersfield, California Sacramento, California Charlotte, North Carolina San Francisco, California Chicago, Illinois Seattle, Washington Dallas, Texas Stockton, California Fresno, California Tucson, Arizona Jacksonville, Florida
  • 14.
    Variables • Housing Characteristics - Size (square feet) - Bedrooms - Bathrooms - Age • Type (condo/single family) • Neighborhood Characteristics - Centrality (distance to CBD) - Job access ( jobs within 3 miles) - Income (median neighborhood income) - Walk Score
  • 15.
    Model Results • Aftercontrolling for other observable di erences in housing and neighborhoods, walkability had a statistically significant positive e ect on housing values in 13 of 15 metropolitan areas • One metro had a negative walkability e ect (Las Vegas); one was statistically insignificant (Bakersfield) • Estimates of other variables were consistent with published studies of housing values
  • 16.
    Walk Score AddsValue In a typical metropolitan area, each 1 point increase in Walk Score was associated with a $700 to $3000 increase in home value, holding all other factors constant.
  • 17.
    How Much Gain is Typical? • How much gain from going from an average level of walkability to an above average level of walkability? • Comparing two neighborhoods in Charlotte, NC • Charlotte estimates: Each 1 point increase in Walk Score was associated with a $1,986 increase in home values.
  • 18.
    Ashley Park: Walk Score = 54 (median) Source: Walkscore.com
  • 19.
    Wilmore: Walk Score = 71 (top 25%) Source: Walkscore.com
  • 20.
    Two Neighborhoods • AshleyPark: • Wilmore - Median Walk Score - 75th Percentile Walk Score - Walk Score 54 - Walk Score 71 - Median Value: $280,000 - Median Value: $314,000 Gain: $34,000 or 12%
  • 21.
    Improving Walkability Adds$10,000 to $30,000 to Home Values in Most Cities
  • 22.
    Implications • Improving walkabilityhelps maintain and increase housing values • Walkability is shaped by public and private decisions: land use and development • Mixed-use development produces big walkability gains • Transit access often coincides with high walkability
  • 23.
    Walking the Walk •Walkability adds value to residential property • Strong evidence of a market demand for walkable, mixed-use development
  • 24.
    Walking the Walk Thank you. For more information or a copy of the full report, contact Sheila Redick at sredick@ceosforcities.org.