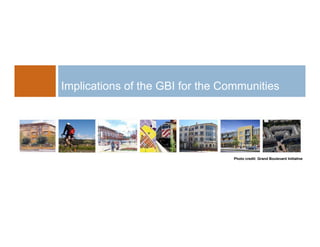
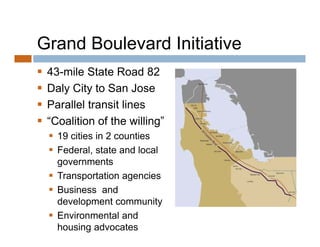
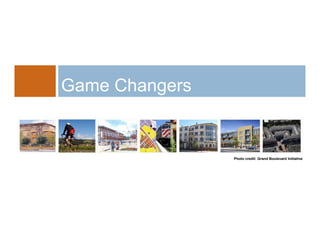
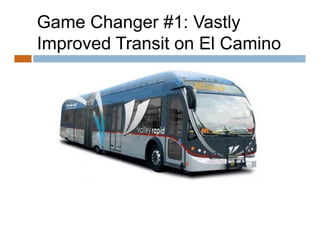
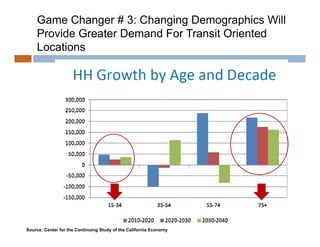
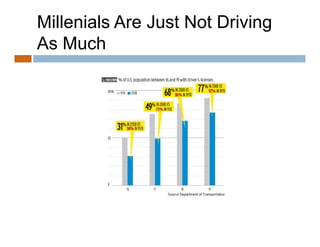
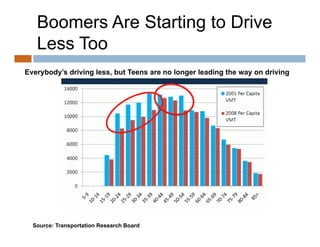
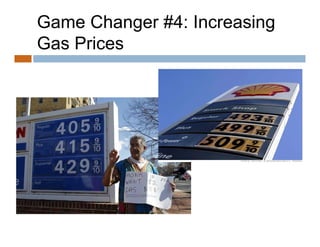
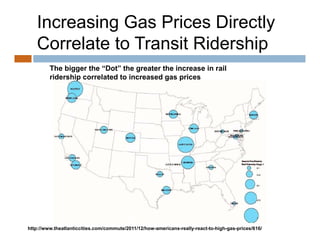
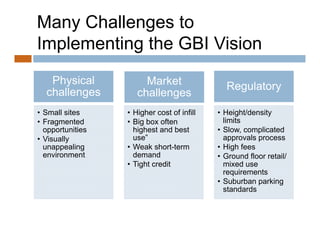
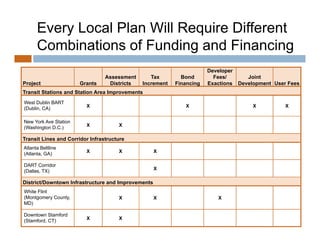
HOW DO WE “WALK
             WALK
THE WALK:” MAKING
THE GBI VISION A
REALITY


       Dena Belzer
      March 5, 2012
What We ll Talk About
     We’ll
1.
1 Implications of the GBI Vision for the
   Communities

2. Game Changers

3. How Do We Implement the GBI Vision?
Implications of the GBI for the Communities


                                  Photo credit: Grand Boulevard Initiative
Grand Boulevard Initiative
   43-mile State Road 82
   Daly City to San Jose
   Parallel transit lines
   “Coalition of the willing”
     19 cities in 2 counties
     Federal, state and local
      governments
     Transportation agencies
     Business and
      development community
     Environmental and
      housing advocates
Summary of Growth Scenarios: Projected
New Households and Jobs in 2035
  300,000 

                     240,264                                                                             246,231 
  250,000 

                                                                                        190,395 
  200,000 
  200 000

                                                                 138,543 
  150,000 
                                            107,135 
                                            107 135
               98,849 
  100,000                                                                                          89,270 

                                                                              57,355 
                                  45,071               39,147 
   50,000 


       ‐
             Greenbelt Alliance   FOCUS PDAs           GBI Baseline            GBI Moderate        GBI Enhanced

                                               Households                   Jobs

 These projections are pegged to outdated regional growth forecasts
All Five Scenarios Can Be Accommodated
     Within the Existing Character of El Camino

    Land capacity > amount of land required for infill
    Can be achieved with financially feasible
     p
     products at a range of densities
                      g


20-25 DU/AC – 2+ stories,   25-35 DU/AC – 3-4 stories, 70-85 DU/AC – 6-8 stories,
attached townhomes,         stacked attached           flats over structured
underground parking         townhomes, tuck-under      parking/ground floor retail
                            parking
Fiscal Benefits of Infill Development ~ $330
              million to $752 million in local tax revenues
           $800
     ons
Millio


           $700

           $600

           $500

           $400

           $300

           $200

           $100

             $0
                    Greenbelt Alliance     FOCUS PDAs          GBI Baseline       GBI Moderate        GBI Enhanced

                  Property Tax - Housing    Property Tax - Commercial     Sales Tax from New Household Spending
Conversion of Low-Performing Retail Sites to Higher
Intensity Uses Can Provide Increased Revenues
SIMILAR EL CAMINO REAL CONTEXT


Sunnyvale Example
                    Photo Credit: Google
Game Changers


                Photo credit: Grand Boulevard Initiative
Game Changer #1: Vastly
Improved Transit on El Camino
Rapid Bus has Been Transformational in
Other Bay Area Corridors – San Pablo Ave
                                     Ave.
Game Changer # 2: Bay Area Employment
        Growth Trends Support Transit Oriented Locations


Source: Center for the Continuing Study of the California Economy
National Profile of Employment
Near Transit
        Transit Zone Capture Rate by Sector Group, 2008

  45%
  40%

  35%
  30%

  25%
  20%
  15%

  10%
  5%

  0%


        Source: LEHD 2008, Center for Transit Oriented Development 2010
                         ,                                   p
From 2002-2008 Employment Near Transit
Increased Slightly in Absolute Numbers
    Change in Total Transit Zone Employment by Sector Group, 2002-2008
     15%


     10%


      5%


      0%


     ‐5%


    ‐10%


    ‐15%
    Source: LEHD 2008, Center for Transit Oriented Development 2010
                 2008
Game Changer # 3: Changing Demographics Will
    Provide Greater Demand For Transit Oriented
    Locations


Source: Center for the Continuing Study of the California Economy
Millenials Are Just Not Driving
As Much
Boomers Are Starting to Drive
   Less Too
Everybody’s driving less, but Teens are no longer leading the way on driving


  Source: Transportation Research Board
Game Changer #4: Increasing
Gas Prices
Increasing Gas Prices Directly
   Correlate to Transit Ridership
         The bigger the “Dot” the greater the increase in rail
         ridership correlated to increased gas prices


http://www.theatlanticcities.com/commute/2011/12/how-americans-really-react-to-high-gas-prices/616/
How Do We Implement the GBI
Vision?


                       Photo credit: Grand Boulevard Initiative
Many Challenges to
Implementing the GBI Vision
   Physical
   Ph i l              Market
                       M k t                  Regulatory
  challenges         challenges
• Small sites     • Higher cost of infill   • Height/density
• Fragmented      • Big box often             limits
  opportunities     highest and best        • Slow, complicated
• Visually          use
                    use”                      approvals process
  unappealing     • Weak short-term         • High fees
  environment       demand                  • Ground floor retail/
                  • Tight credit              mixed use
                                              requirements
                                                   i     t
                                            • Suburban parking
                                              standards
Every Community Will Create it’s
Own Approach
 There is no “one-size-fits-all solution ”
               one size fits all solution.
 Think strategically about prioritizing public
  investments and public funds
                           funds.
 Look for:
     Multiple funding sources
                       sources.
     A broad funding base.
     Synergies among projects
                         projects.
     New partnerships to fill the gap.
Every Local Plan Will Require Different
      Combinations of Funding and Financing
                                                                      Developer
                                 Assessment      Tax        Bond        Fees/        Joint
Project                Grants     Districts   Increment   Financing   Exactions   Development User Fees
Transit Stations and Station Area Improvements
West Dublin BART
                         X                                   X                         X          X
(Dublin,
(Dublin CA)

New York Ave Station
                         X            X
(Washington D.C.)

Transit Lines and Corridor Infrastructure
Atlanta Beltline
                         X            X             X
(Atlanta, GA)

DART Corridor
                                                    X
(Dallas,
(Dallas TX)

District/Downtown Infrastructure and Improvements
White Flint
(Montgomery County,                   X             X                    X
MD)

Downtown Stamford
                         X            X
(Stamford, CT)
What’s on the Cutting Edge of TOD
Infrastructure Financing?
 Aurora CO
 Cleveland OH
 West Union IA


If these places can be “cutting edge” so can you!
Aurora CO - “Strategic Parking Plan
and Program Study”
             Study
 Projects – Four structured parking
     j                       p     g
  garages at strategic locations

 Tools -
    Potential funding sources:                           Aurora
     general fund revenues, user
     fees, parking in-lieu fee,
     commercial parking stall fee
                                fee,
     transportation impact fee
    Bond financing
 Lessons Learned -
    Think strategically about
     prioritizing public investments
    Look for multiple funding
     sources and a broad base
                                       Source: Denver RTD FasTracks
Cleveland, OH - Greater University
 Circle Initiative
 Projects - Reconfiguration of a traffic circle and
      j             g
  relocation/renovation of two rail stations to support
  development
 Tools - Anchor institutions provided:
   Convening and visioning
   $1 million for upfront
    $               p
    planning and design
   Support for federal grants
 L
  Lessons L
          Learned:
                d
   Look for partnerships to
    fill gaps left by traditional
    funding sources

               Source : New York Times
West Union IA – District Energy
System
 Project – District energy in an historic downtown
     j                   gy

 Tools –
   Funding: Grants from the
    U.S. Dept of Energy, the
    EPA, & the Iowa
    Department of Economic
       p
    Development
   Financing: Municipal bonds
 L
  Lessons L
          Learned –
                d
   Look for synergies
    among infrastructure
    projects
   Layer funding sources
Wrapping UP


              Photo credit: Grand Boulevard Initiative
Converging Factors Will All
Support GBI
1.
1  Changing community attitudes
2. Incremental physical change
3.
3  Better fiscal health
4. Strategic public investments
5.
5  Future population and employment growth
   F t           l ti      d  l    t      th
   trends
6. Global trends
6 Gl b l t d
7. Innovative community and regional thinking
   about i l
     b t implementation!
                      t ti !
For Further Information
Contact:


dbelzer@strategiceconomics.com
dbelzer@strategiceconomics com

www.strategiceconomics.com
     t t i         i

Sunnyvale Walk the Talk Forum

  • 1.
    HOW DO WE“WALK WALK THE WALK:” MAKING THE GBI VISION A REALITY Dena Belzer March 5, 2012
  • 2.
    What We llTalk About We’ll 1. 1 Implications of the GBI Vision for the Communities 2. Game Changers 3. How Do We Implement the GBI Vision?
  • 3.
    Implications of theGBI for the Communities Photo credit: Grand Boulevard Initiative
  • 4.
    Grand Boulevard Initiative  43-mile State Road 82  Daly City to San Jose  Parallel transit lines  “Coalition of the willing”  19 cities in 2 counties  Federal, state and local governments  Transportation agencies  Business and development community  Environmental and housing advocates
  • 5.
    Summary of GrowthScenarios: Projected New Households and Jobs in 2035 300,000  240,264  246,231  250,000  190,395  200,000  200 000 138,543  150,000  107,135  107 135 98,849  100,000  89,270  57,355  45,071  39,147  50,000  ‐ Greenbelt Alliance FOCUS PDAs GBI Baseline GBI Moderate GBI Enhanced Households Jobs These projections are pegged to outdated regional growth forecasts
  • 6.
    All Five ScenariosCan Be Accommodated Within the Existing Character of El Camino  Land capacity > amount of land required for infill  Can be achieved with financially feasible p products at a range of densities g 20-25 DU/AC – 2+ stories, 25-35 DU/AC – 3-4 stories, 70-85 DU/AC – 6-8 stories, attached townhomes, stacked attached flats over structured underground parking townhomes, tuck-under parking/ground floor retail parking
  • 7.
    Fiscal Benefits ofInfill Development ~ $330 million to $752 million in local tax revenues $800 ons Millio $700 $600 $500 $400 $300 $200 $100 $0 Greenbelt Alliance FOCUS PDAs GBI Baseline GBI Moderate GBI Enhanced Property Tax - Housing Property Tax - Commercial Sales Tax from New Household Spending
  • 8.
    Conversion of Low-PerformingRetail Sites to Higher Intensity Uses Can Provide Increased Revenues
  • 9.
    SIMILAR EL CAMINOREAL CONTEXT Sunnyvale Example Photo Credit: Google
  • 10.
    Game Changers Photo credit: Grand Boulevard Initiative
  • 11.
    Game Changer #1:Vastly Improved Transit on El Camino
  • 12.
    Rapid Bus hasBeen Transformational in Other Bay Area Corridors – San Pablo Ave Ave.
  • 13.
    Game Changer #2: Bay Area Employment Growth Trends Support Transit Oriented Locations Source: Center for the Continuing Study of the California Economy
  • 14.
    National Profile ofEmployment Near Transit Transit Zone Capture Rate by Sector Group, 2008 45% 40% 35% 30% 25% 20% 15% 10% 5% 0% Source: LEHD 2008, Center for Transit Oriented Development 2010 , p
  • 15.
    From 2002-2008 EmploymentNear Transit Increased Slightly in Absolute Numbers Change in Total Transit Zone Employment by Sector Group, 2002-2008 15% 10% 5% 0% ‐5% ‐10% ‐15% Source: LEHD 2008, Center for Transit Oriented Development 2010 2008
  • 16.
    Game Changer #3: Changing Demographics Will Provide Greater Demand For Transit Oriented Locations Source: Center for the Continuing Study of the California Economy
  • 17.
    Millenials Are JustNot Driving As Much
  • 18.
    Boomers Are Startingto Drive Less Too Everybody’s driving less, but Teens are no longer leading the way on driving Source: Transportation Research Board
  • 19.
    Game Changer #4:Increasing Gas Prices
  • 20.
    Increasing Gas PricesDirectly Correlate to Transit Ridership The bigger the “Dot” the greater the increase in rail ridership correlated to increased gas prices http://www.theatlanticcities.com/commute/2011/12/how-americans-really-react-to-high-gas-prices/616/
  • 21.
    How Do WeImplement the GBI Vision? Photo credit: Grand Boulevard Initiative
  • 22.
    Many Challenges to Implementingthe GBI Vision Physical Ph i l Market M k t Regulatory challenges challenges • Small sites • Higher cost of infill • Height/density • Fragmented • Big box often limits opportunities highest and best • Slow, complicated • Visually use use” approvals process unappealing • Weak short-term • High fees environment demand • Ground floor retail/ • Tight credit mixed use requirements i t • Suburban parking standards
  • 23.
    Every Community WillCreate it’s Own Approach  There is no “one-size-fits-all solution ” one size fits all solution.  Think strategically about prioritizing public investments and public funds funds.  Look for:  Multiple funding sources sources.  A broad funding base.  Synergies among projects projects.  New partnerships to fill the gap.
  • 24.
    Every Local PlanWill Require Different Combinations of Funding and Financing Developer Assessment Tax Bond Fees/ Joint Project Grants Districts Increment Financing Exactions Development User Fees Transit Stations and Station Area Improvements West Dublin BART X X X X (Dublin, (Dublin CA) New York Ave Station X X (Washington D.C.) Transit Lines and Corridor Infrastructure Atlanta Beltline X X X (Atlanta, GA) DART Corridor X (Dallas, (Dallas TX) District/Downtown Infrastructure and Improvements White Flint (Montgomery County, X X X MD) Downtown Stamford X X (Stamford, CT)
  • 25.
    What’s on theCutting Edge of TOD Infrastructure Financing?  Aurora CO  Cleveland OH  West Union IA If these places can be “cutting edge” so can you!
  • 26.
    Aurora CO -“Strategic Parking Plan and Program Study” Study  Projects – Four structured parking j p g garages at strategic locations  Tools -  Potential funding sources: Aurora general fund revenues, user fees, parking in-lieu fee, commercial parking stall fee fee, transportation impact fee  Bond financing  Lessons Learned -  Think strategically about prioritizing public investments  Look for multiple funding sources and a broad base Source: Denver RTD FasTracks
  • 27.
    Cleveland, OH -Greater University Circle Initiative  Projects - Reconfiguration of a traffic circle and j g relocation/renovation of two rail stations to support development  Tools - Anchor institutions provided:  Convening and visioning  $1 million for upfront $ p planning and design  Support for federal grants  L Lessons L Learned: d  Look for partnerships to fill gaps left by traditional funding sources Source : New York Times
  • 28.
    West Union IA– District Energy System  Project – District energy in an historic downtown j gy  Tools –  Funding: Grants from the U.S. Dept of Energy, the EPA, & the Iowa Department of Economic p Development  Financing: Municipal bonds  L Lessons L Learned – d  Look for synergies among infrastructure projects  Layer funding sources
  • 29.
    Wrapping UP Photo credit: Grand Boulevard Initiative
  • 30.
    Converging Factors WillAll Support GBI 1. 1 Changing community attitudes 2. Incremental physical change 3. 3 Better fiscal health 4. Strategic public investments 5. 5 Future population and employment growth F t l ti d l t th trends 6. Global trends 6 Gl b l t d 7. Innovative community and regional thinking about i l b t implementation! t ti !
  • 32.