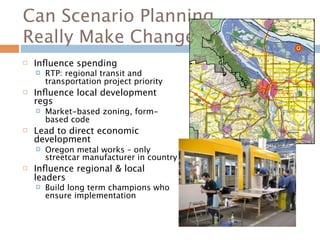
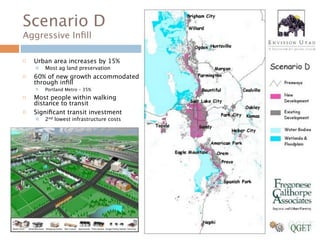
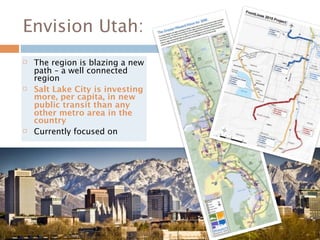
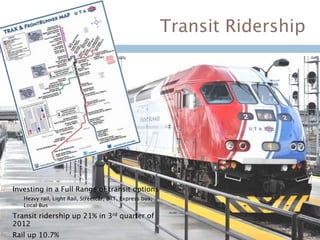
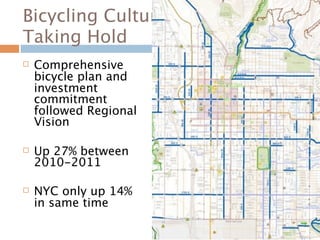
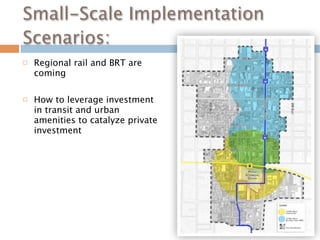
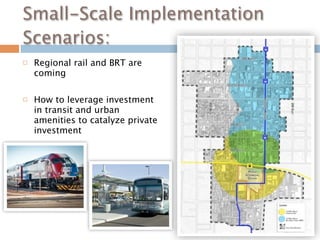
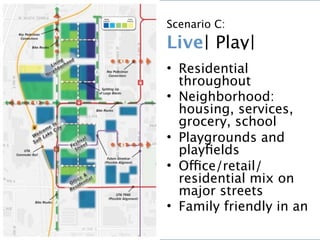
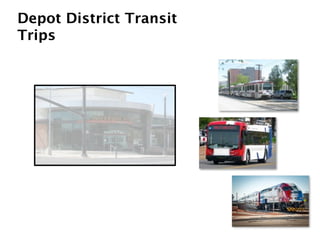
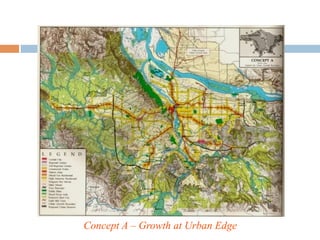
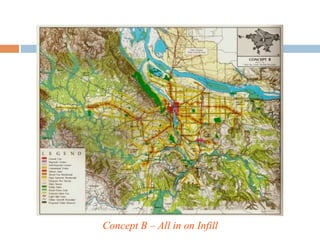
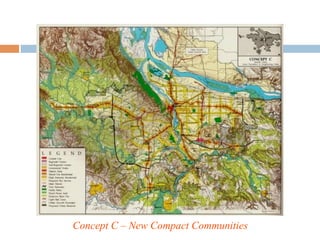
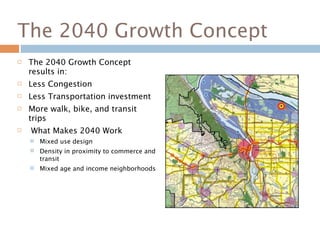
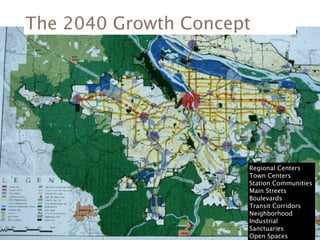
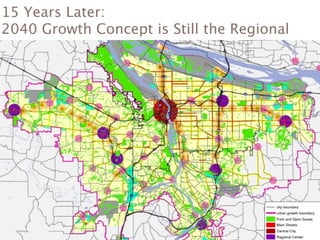
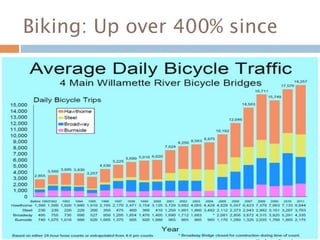
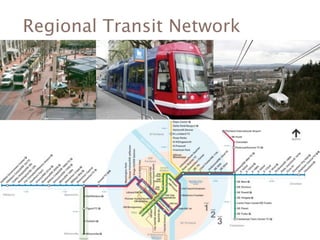
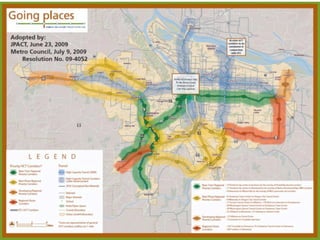
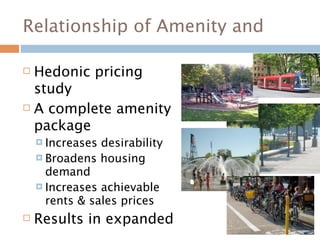
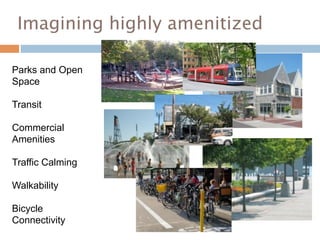
24. Can Scenario Planning
Really Make Change?
Influence spending
RTP: regional transit and
transportation project priority
Influence local development
regs
Market-based zoning, form-
based code
Lead to direct economic
development
Oregon metal works – only
streetcar manufacturer in country
Influence regional & local
leaders
Build long term champions who
ensure implementation
26. The Wasatch Front
The region was facing
Enormous future growth
Inadequate
transportation -
Doubling of VMT
Poor air quality
increasing asthma and
27. Worst Things About Utah
Percent Who Mention First or Second Most Important
Trasportation
20
Infrastructure
13
Criminal Activity
12
Air Quality
11
Income Level
10
Political Ideology
7
LDS Church
7
Cost of Living
6
Population Growth
6
Taxes
5
0 10 20 30 40
28. Scenario A
Trends Continue
Urban area doubles
Density drops
84% single family
Fewer people with access to
transit
Highest new infrastructure
29. Scenario C
Market Demand
Urban area increases by 25%
Housing balanced with
future market demand
Significantly more people
within walking distance to
transit
30. Scenario D
Aggressive Infill
Urban area increases by 15%
Most ag land preservation
60% of new growth accommodated
through infill
Portland Metro – 35%
Most people within walking
distance to transit
Significant transit investment
2nd lowest infrastructure costs
31. Envision Utah:
The region is blazing a new
path – a well connected
region
Salt Lake City is investing
more, per capita, in new
public transit than any
other metro area in the
country
Currently focused on
32. Transit Ridership
Investing in a Full Range of transit options
Heavy rail, Light Rail, Streetcar, BRT, Express bus,
Local Bus
Transit ridership up 21% in 3rd quarter of
2012
Rail up 10.7%
33. Bicycling Culture
Taking Hold
Comprehensive
bicycle plan and
investment
commitment
followed Regional
Vision
Up 27% between
2010-2011
NYC only up 14%
in same time
34. Small-Scale Implementation
Scenarios:
Regional rail and BRT are
coming
How to leverage investment
in transit and urban
amenities to catalyze private
investment
35. Small-Scale Implementation
Scenarios:
Regional rail and BRT are
coming
How to leverage investment
in transit and urban
amenities to catalyze private
investment
36. Scenario C:
Live| Play|
• Residential
throughout
• Neighborhood:
housing, services,
grocery, school
• Playgrounds and
playfields
• Office/retail/
residential mix on
major streets
• Family friendly in an
38. Depot District Transit
Trips
Improve air quality, less time in traffic, more time doing what we enjoy
39. Prototypes Vary in Feasibility
Main Street Retail
6+ Story
TownhomesCompact 3- and 4-
Single Family story
mixed-use
Most Feasible Most
40. Optimize Development
Use ROI analysis to
make regulations
market feasible
Experiment with:
Height
Parking
requirements / type
Unit sizes
Landscaping
requirements
Etc.
41. Suburban Parking vs. Urban Parking
Standards Suburban Parking Standards (2/uni
Urban Parking Standards (1/unit)
3-story Garden Townhom
works at Apts and es and
urban Cottage Compact
parking Homes Single
standards Family
57. The 2040 Growth Concept
The 2040 Growth Concept
results in:
Less Congestion
Less Transportation investment
More walk, bike, and transit
trips
What Makes 2040 Work
Mixed use design
Density in proximity to commerce and
transit
Mixed age and income neighborhoods
58. The 2040 Growth Concept
Regional Centers
Town Centers
Station Communities
Main Streets
Boulevards
Transit Corridors
Neighborhood
Industrial
Sanctuaries
Open Spaces
60. Redevelopment is a major way to
Currently 35% - Far exceeding goal of
20%
100%
29%
38%
75%
50%
25%
0%
Households Employment
New Construction Redevelopment
3-D Column 3 3-D Column 4
67. Competitiveness of Place:
80% MHI Young Family (25-35)
$43,679
Project assistant and retail assistant
TOD Housing
$1,092 month/rent (63% likelihood)
Segment
$142,000 purchase (37% likelihood)
Demand
TOD Capture TOD Capture
Other Preference Other Preference
The future will not be like the past, or even the present\nThere is a lot we know:\nBaby boomers, immigrants and young professionals are changing urban markets\nThere is also a lot of uncertainty to prepare for:\nClimate change, economic and political uncertainty\n
Older baby boomers (55-64) will constitute a senior population unprecedented in size;\nYounger boomers (46-54) many of whom won’t be able to sell their current suburban homes to move to new jobs;\nGeneration Y (late teens-early 30s), which may be renting housing far longer than did past generations; and\nImmigrants and their children, who may want to move to suburbs but may be priced out even after the current drop in prices.\n
\n
The shift we are experiencing is driven by several factors, including smaller household sizes – basically, a decease in family size. \n
So we can see this in greater detail here – this is data from the real estate research firm RCLCO – and it show the change in households between 1980 and 2000 and we see the greatest increase in the number of one person households, which grew by 85%. This is followed by households occupied by people that are married without children and then single women with children. The classic household – people married with children – grew the least. \n
What we are looking at here is the difference between existing stock and projected demand for three housing types: (1) Attached; aparments, lofts, condominiums, etc; (2) small lot single family; and (3) large lot single family. \n
\n
Hottest March on record for most of the country\n
Global climate change\n
US housing crash – financial crisis – no more free money\n
European debt crisis – global economic uncertainty\n
Arab Spring – political stability – fuel supply and dependency\n
\n
\n
\n
\n
\n
\n
\n
\n
\n
\n
\n
\n
\n
\n
\n
\n
\n
Been through the same process of choosing in Provo, working toward a long-term vision\nWhat’s feasible in the shorter term?\n
\n
That means an increase in transit trips – about 5-6ooo tran\nImprove air quality,\nSpend less time in traffic\nMore time for doing what matters to us\n
\n
\n
\n
We’ve explored what these modeled scenarios might look like on the ground.\n\nThe station, looking north, imagining significant job growth in the area…\n
\n
\n
Standing on the steps of the historic Rio Grande Depot looking toward the new station, imagining a festival street…\n
\n
\n
Just west of the Gateway, imagine new urban neighborhoods, think family friendly in an urban way\n
\n
\n
\n
\n
\n
\n
\n
\n
\n
\n
\n
\n
\n
\n
\n
\n
\n
-Not all amenities are created equal – bring a suburban area up to fully amentized… add nuance.\n