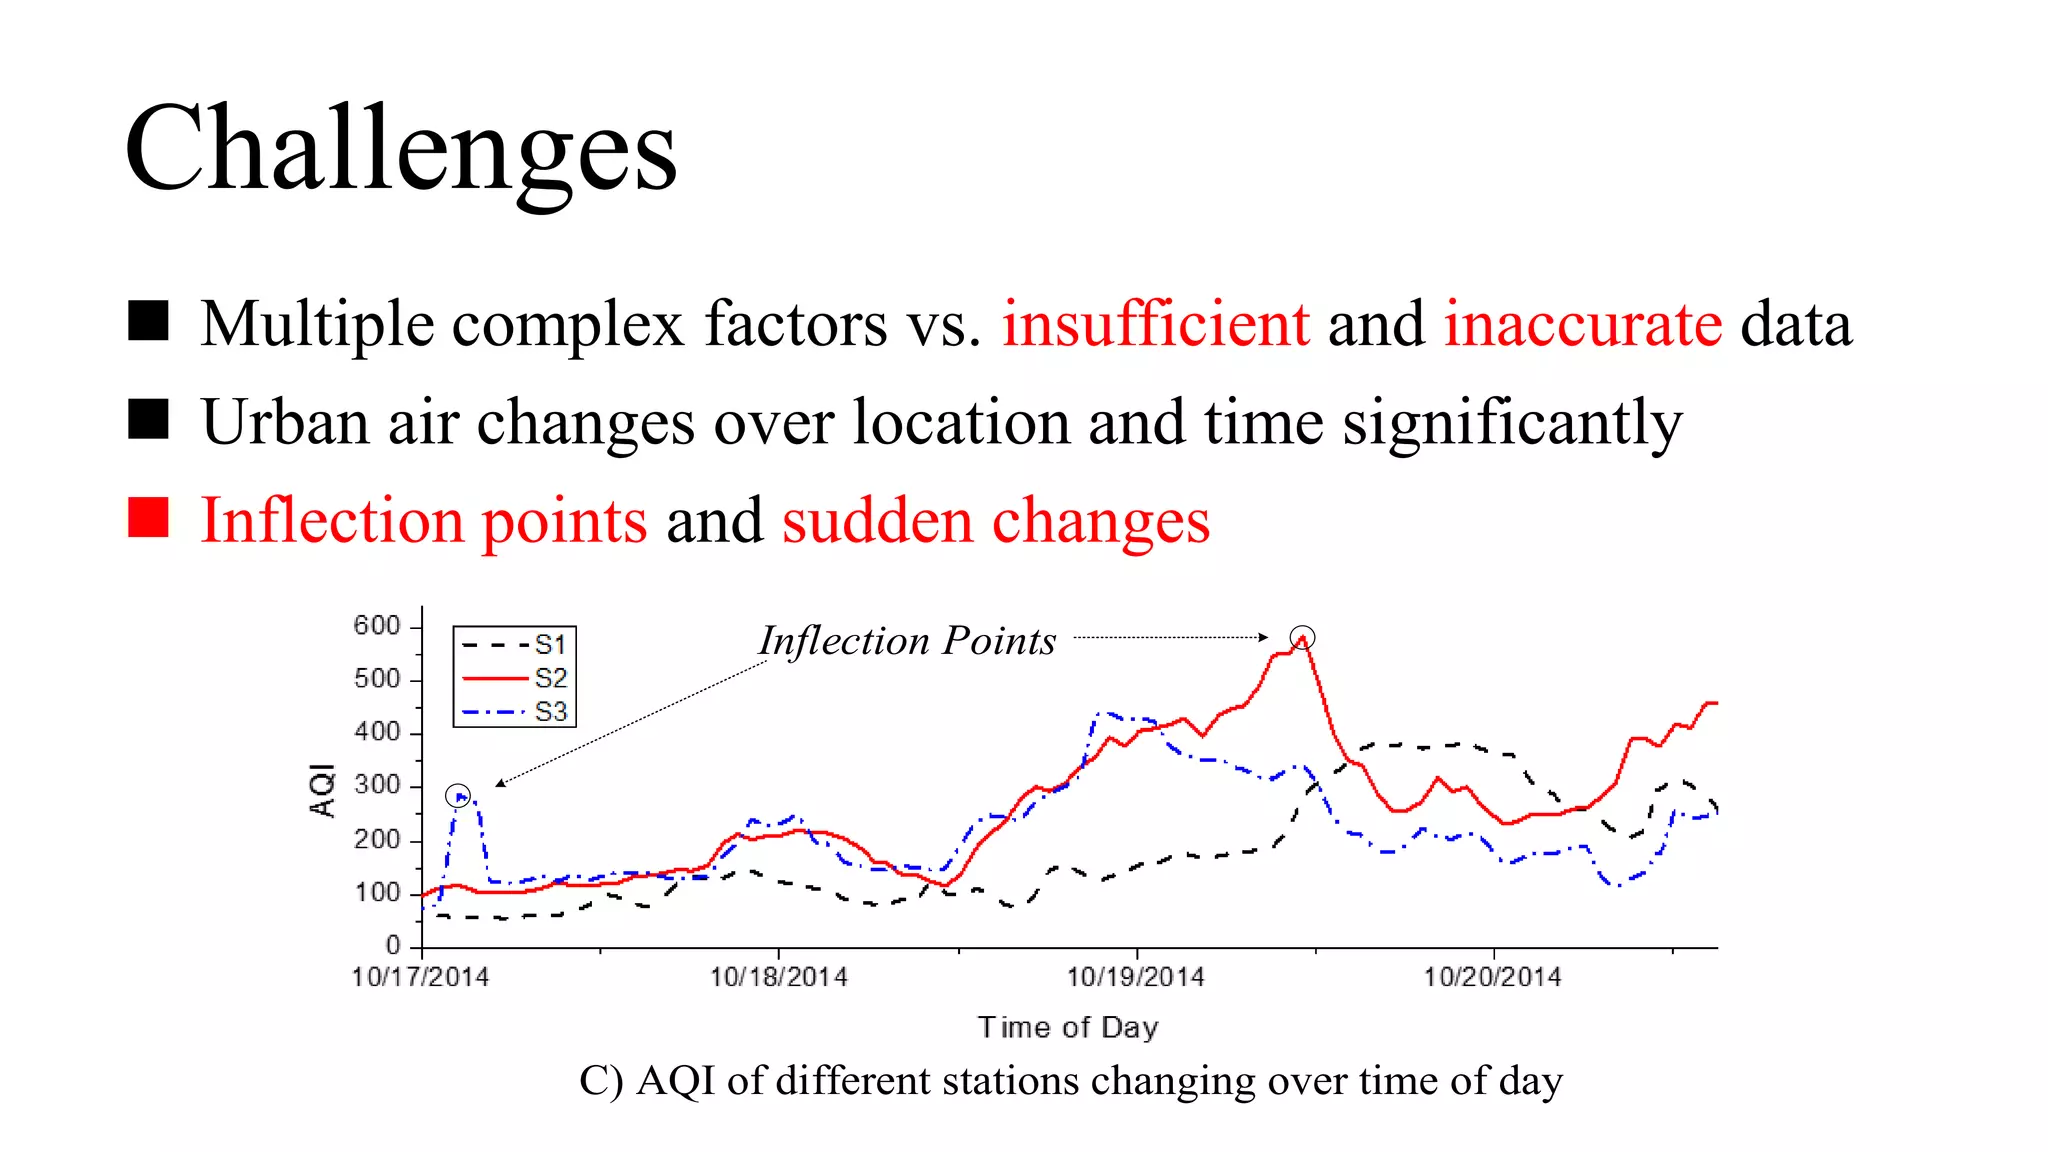
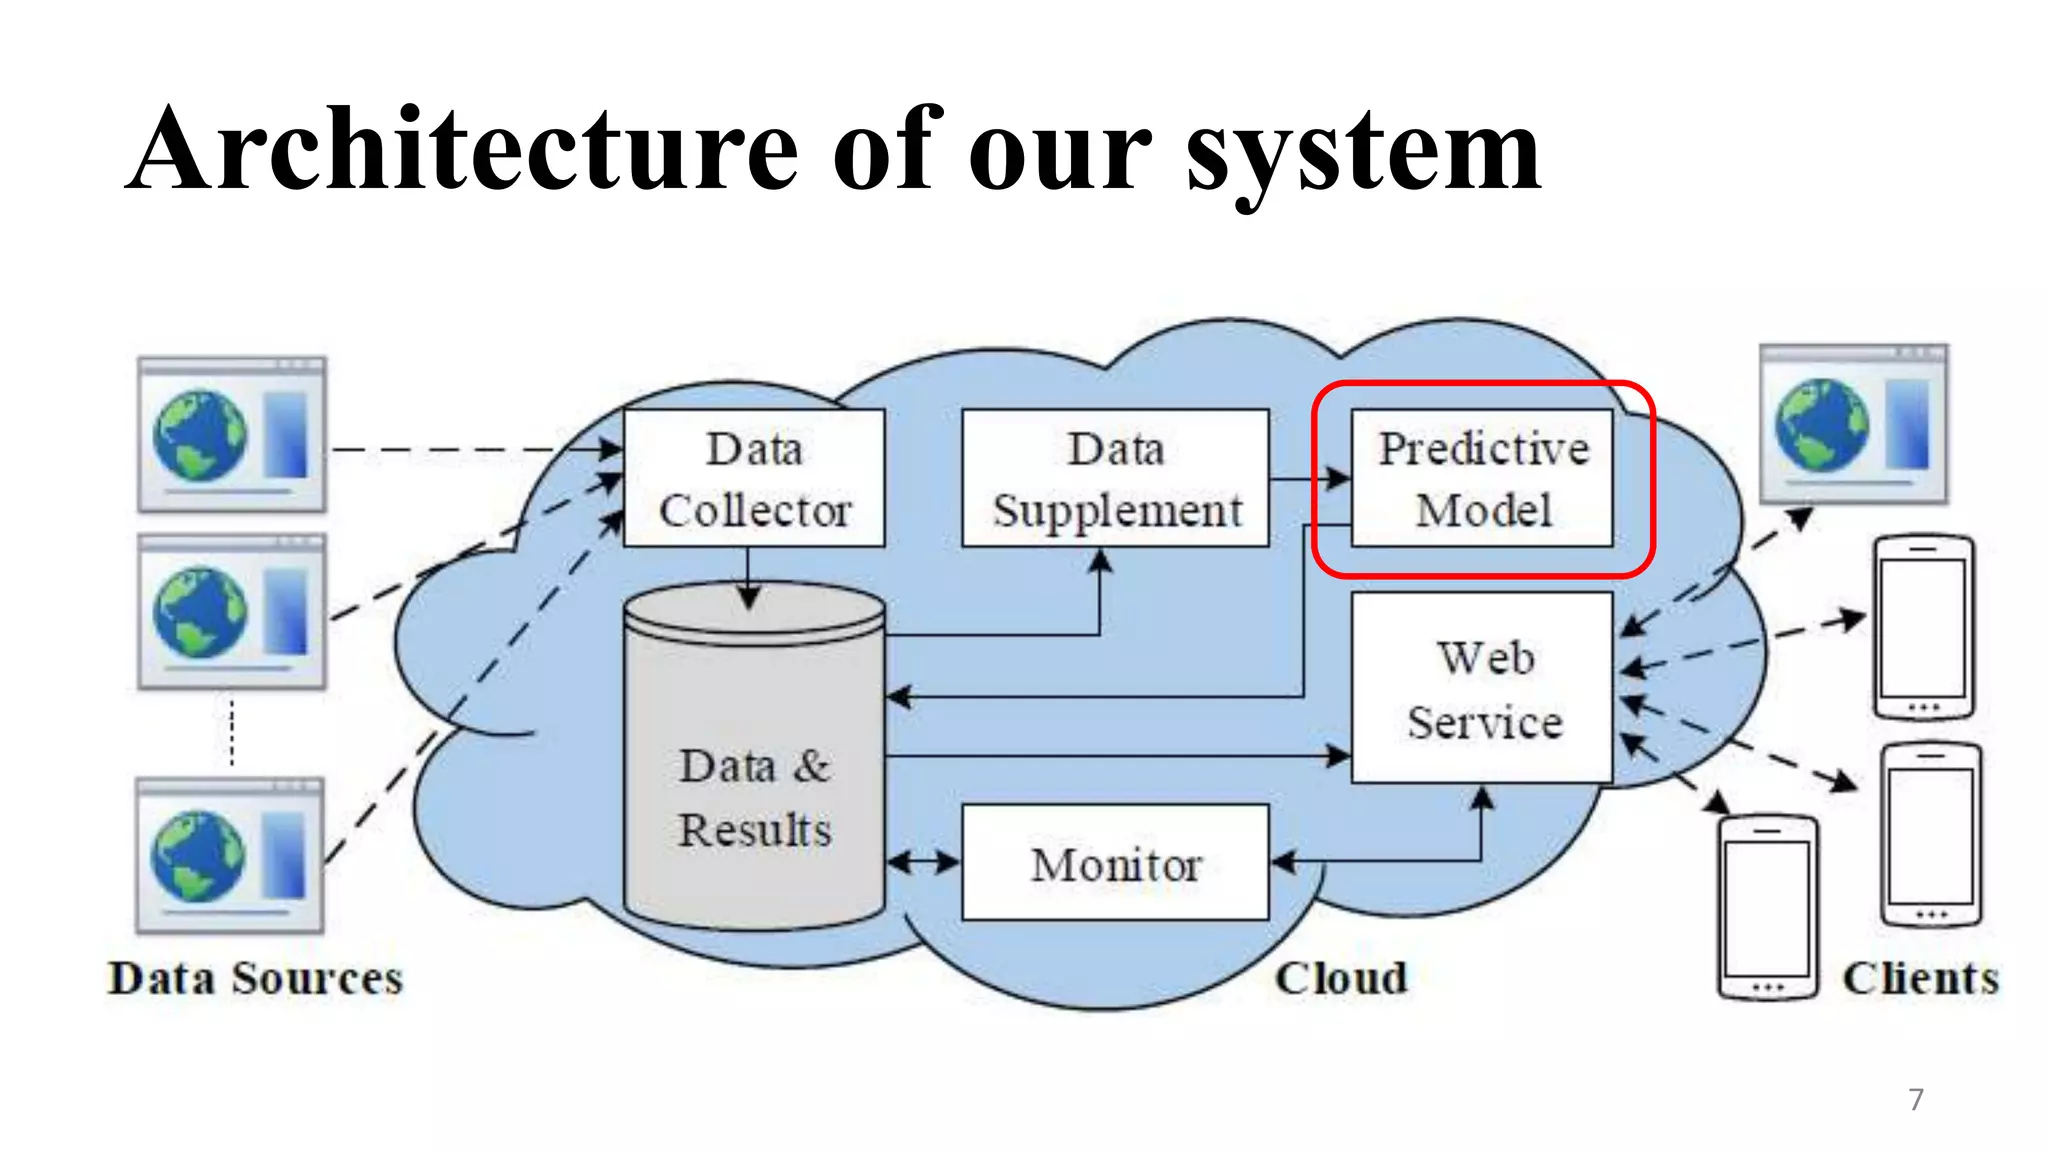
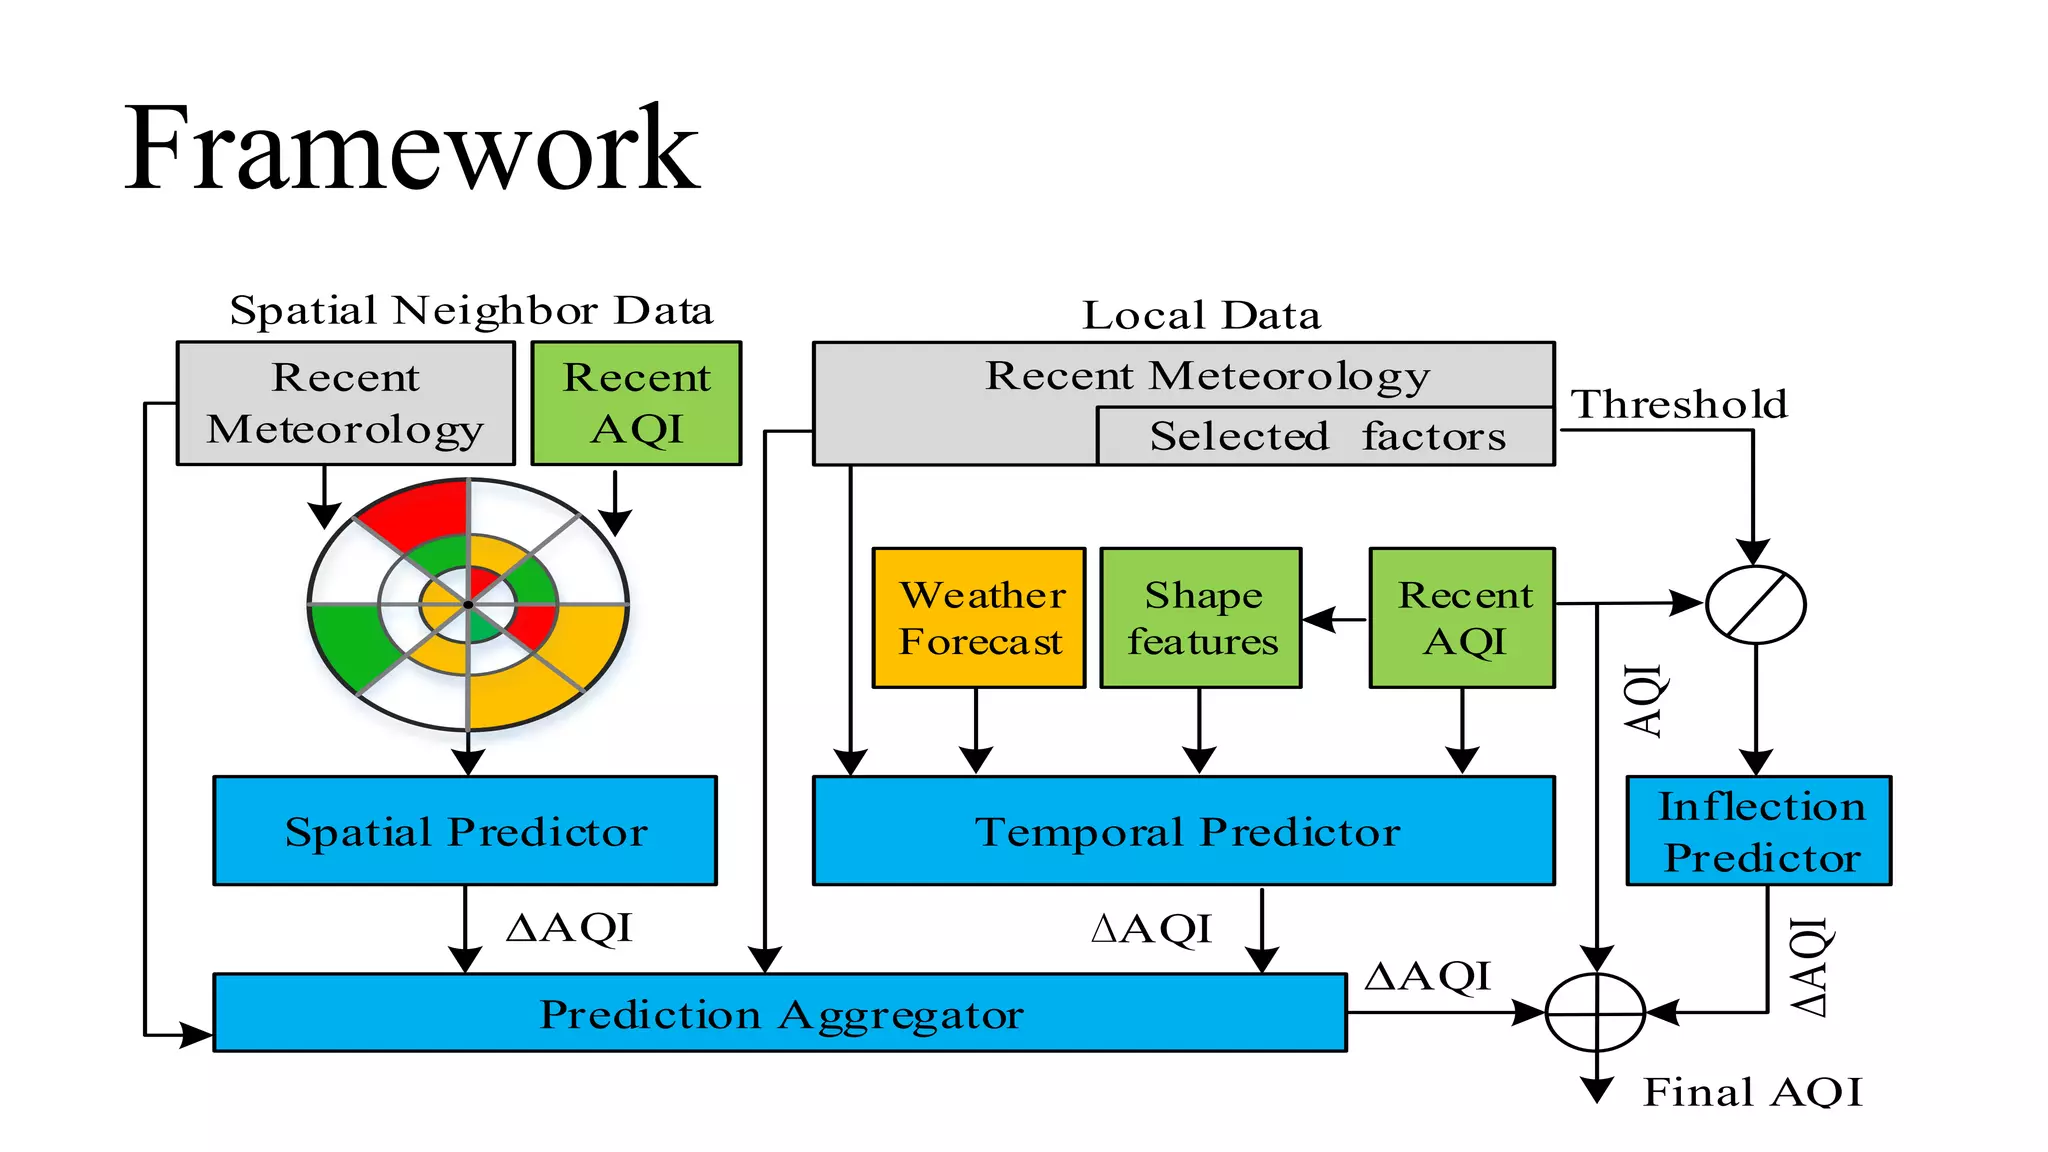
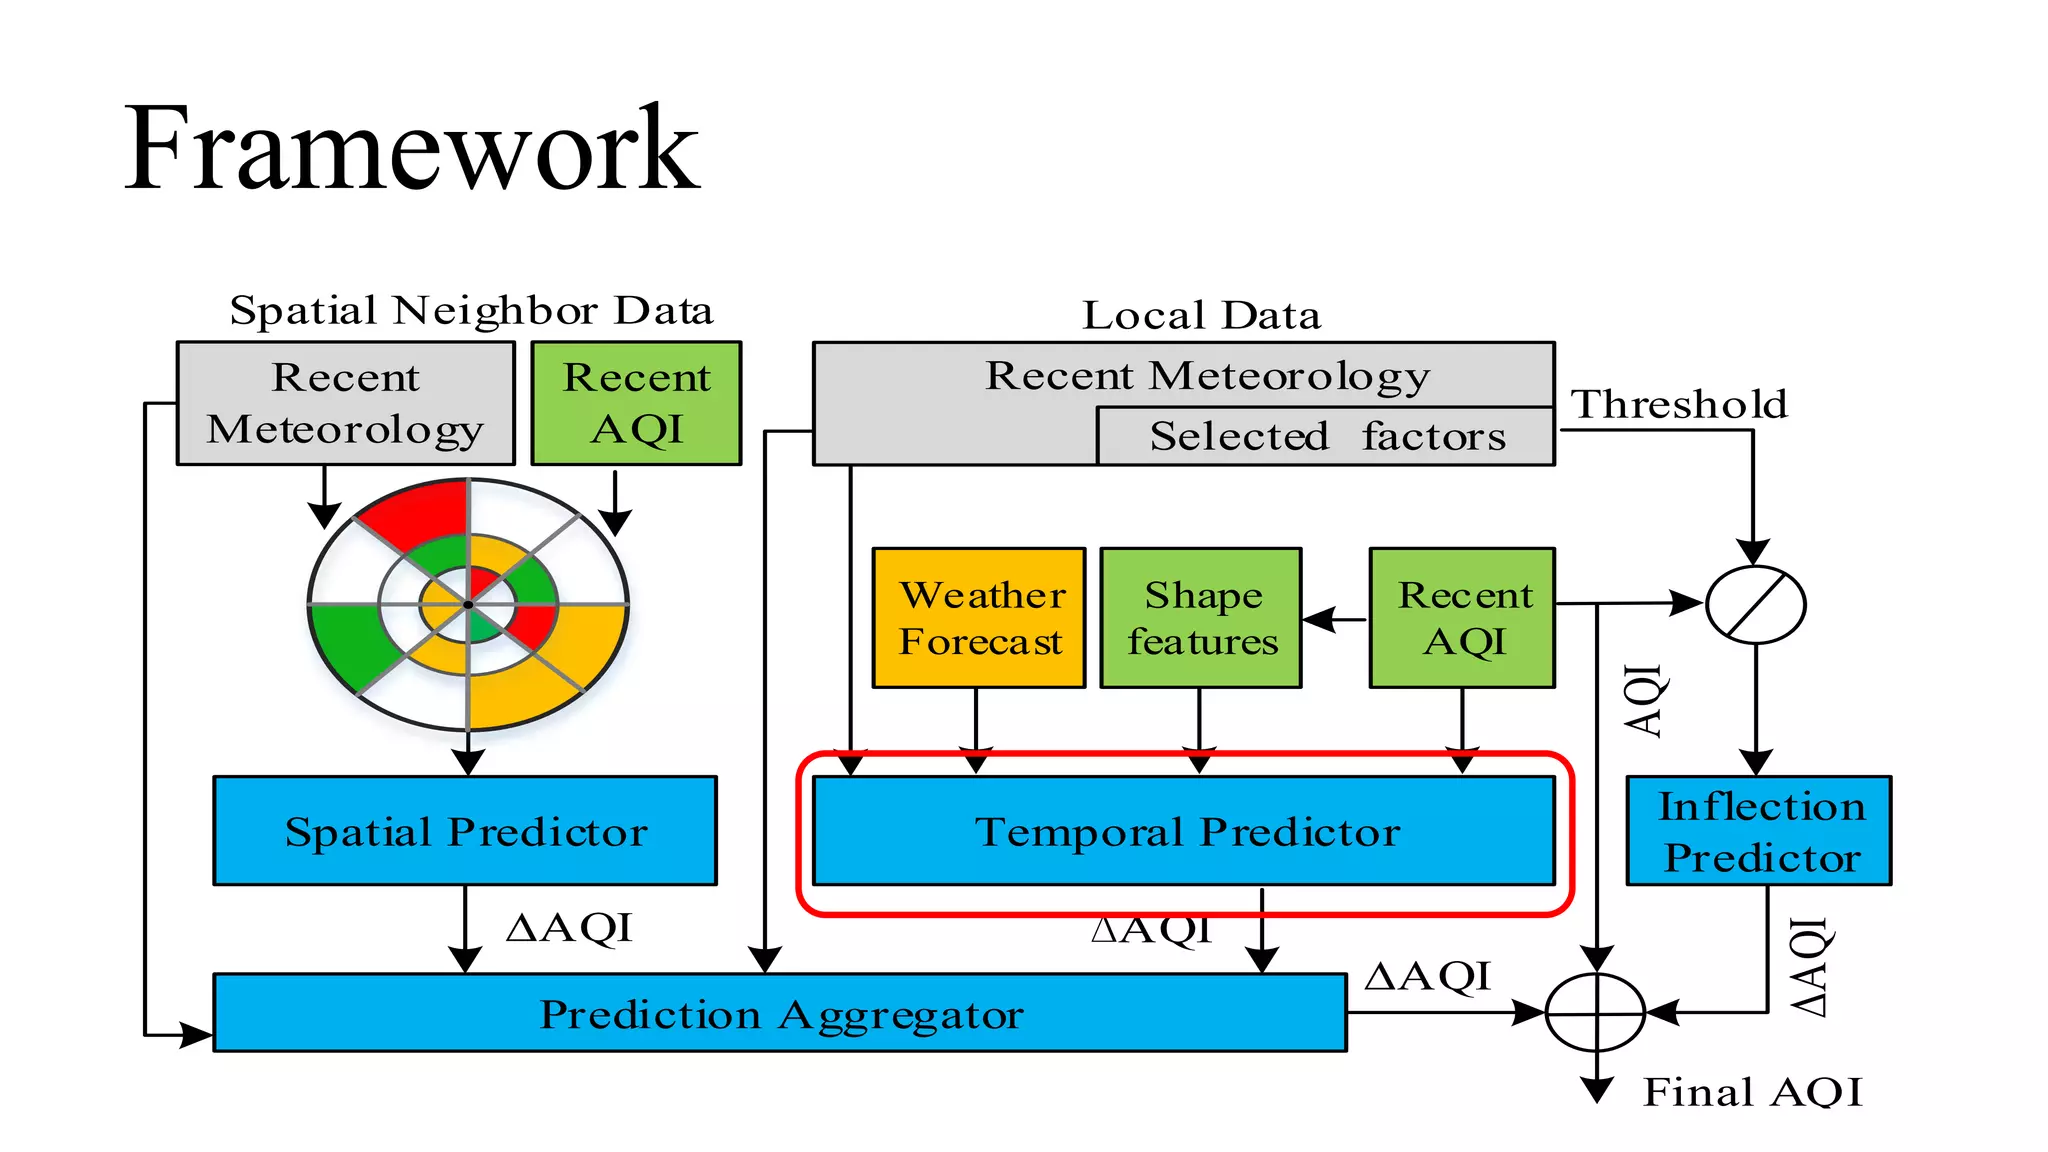
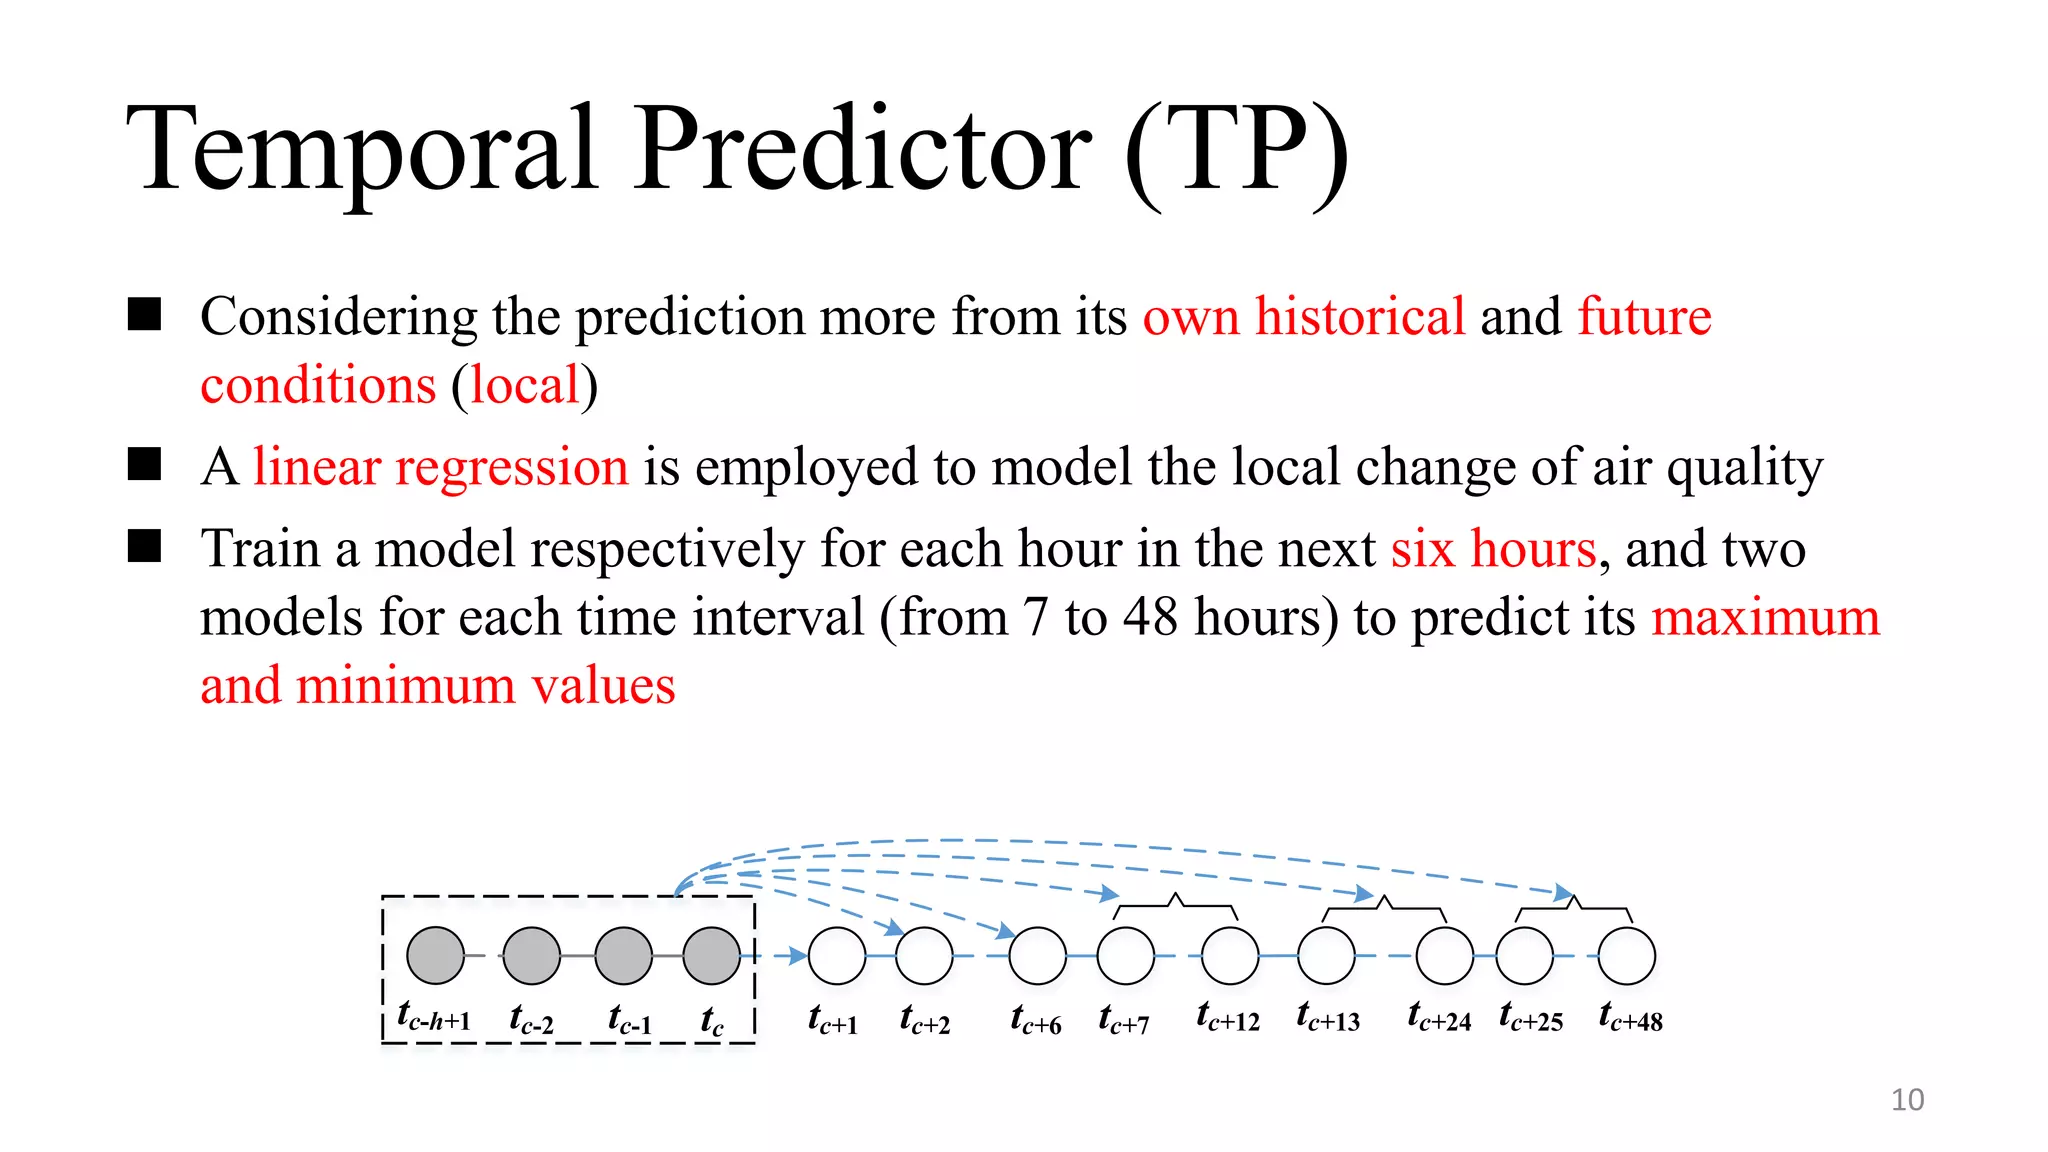
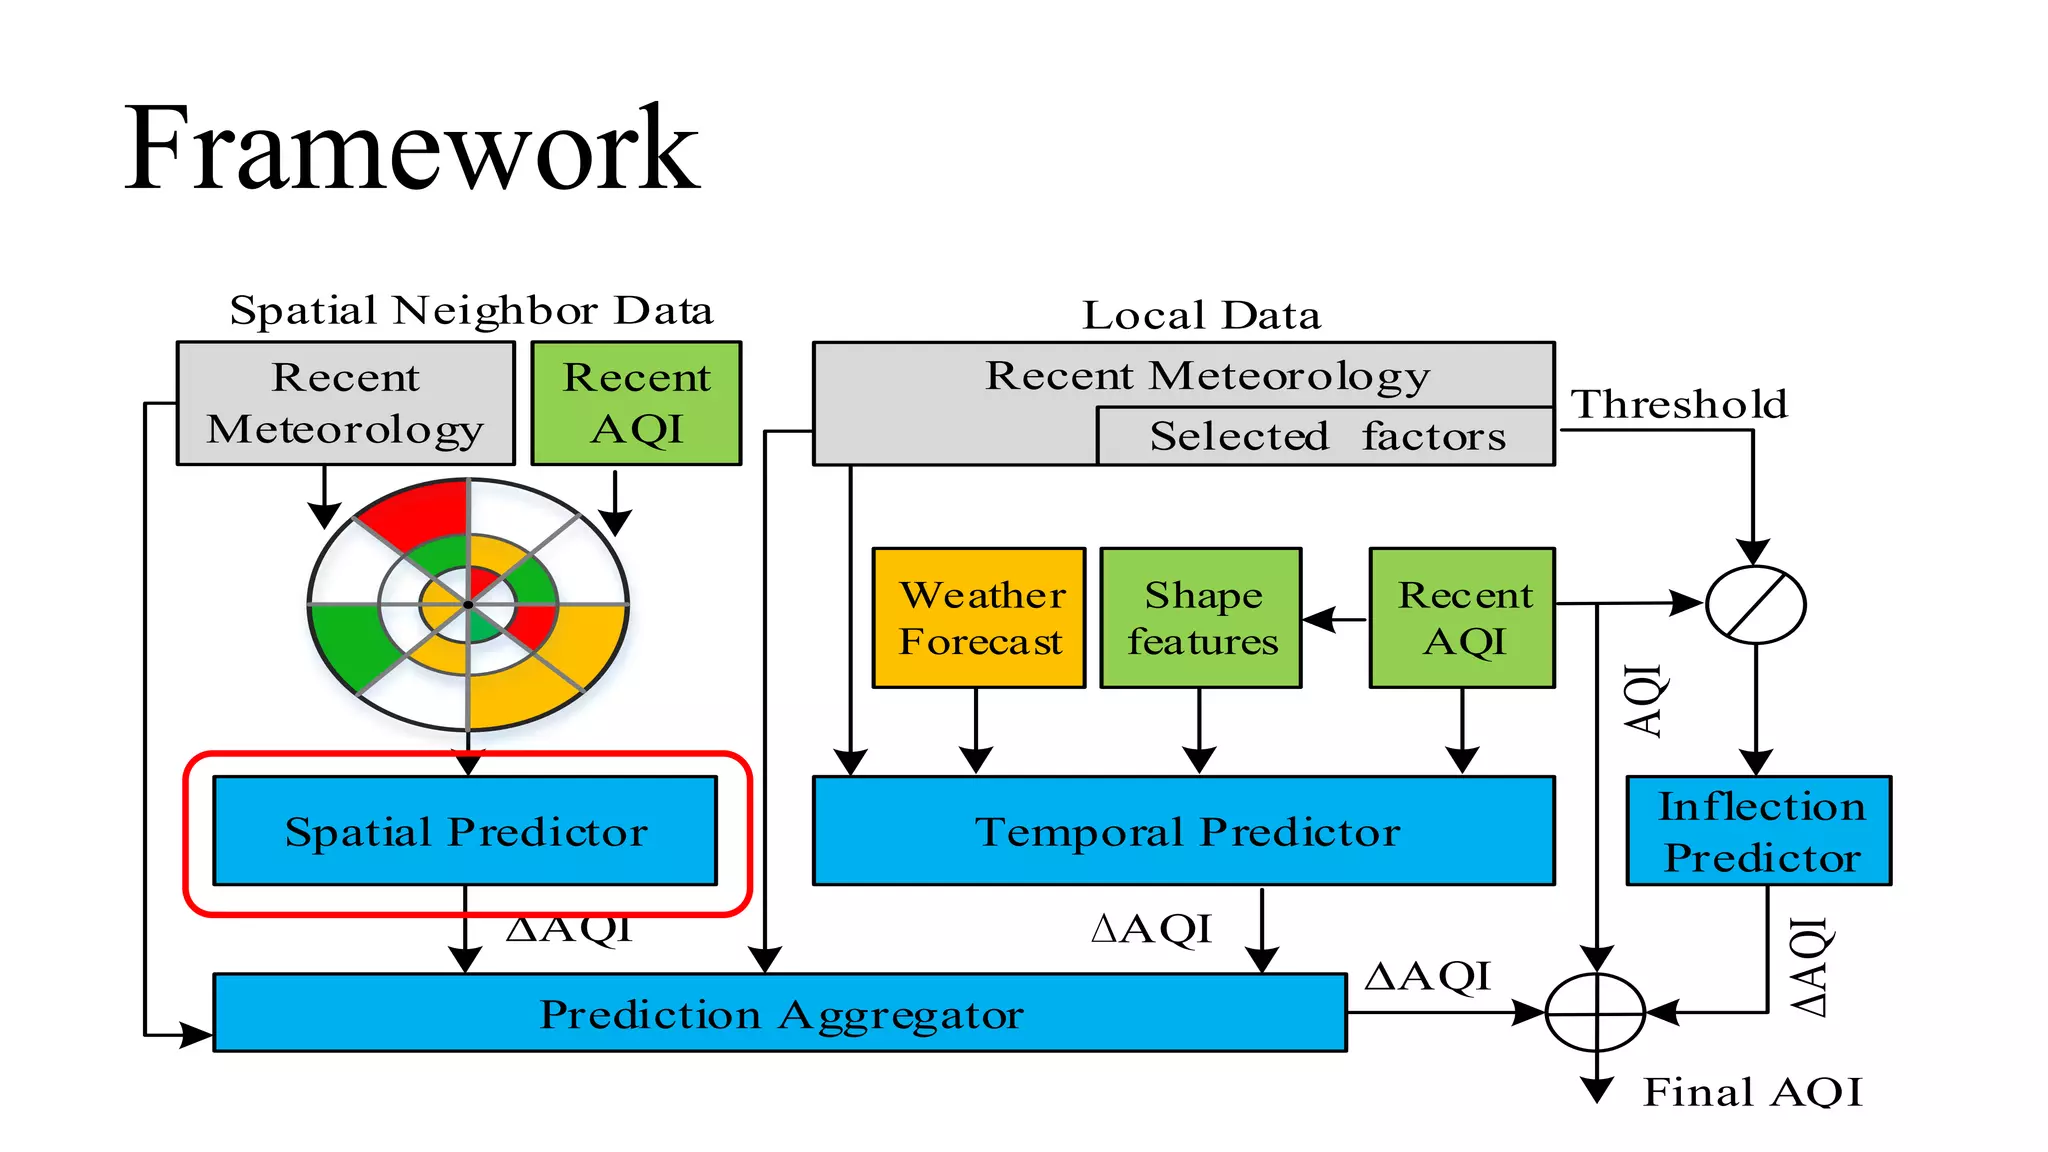
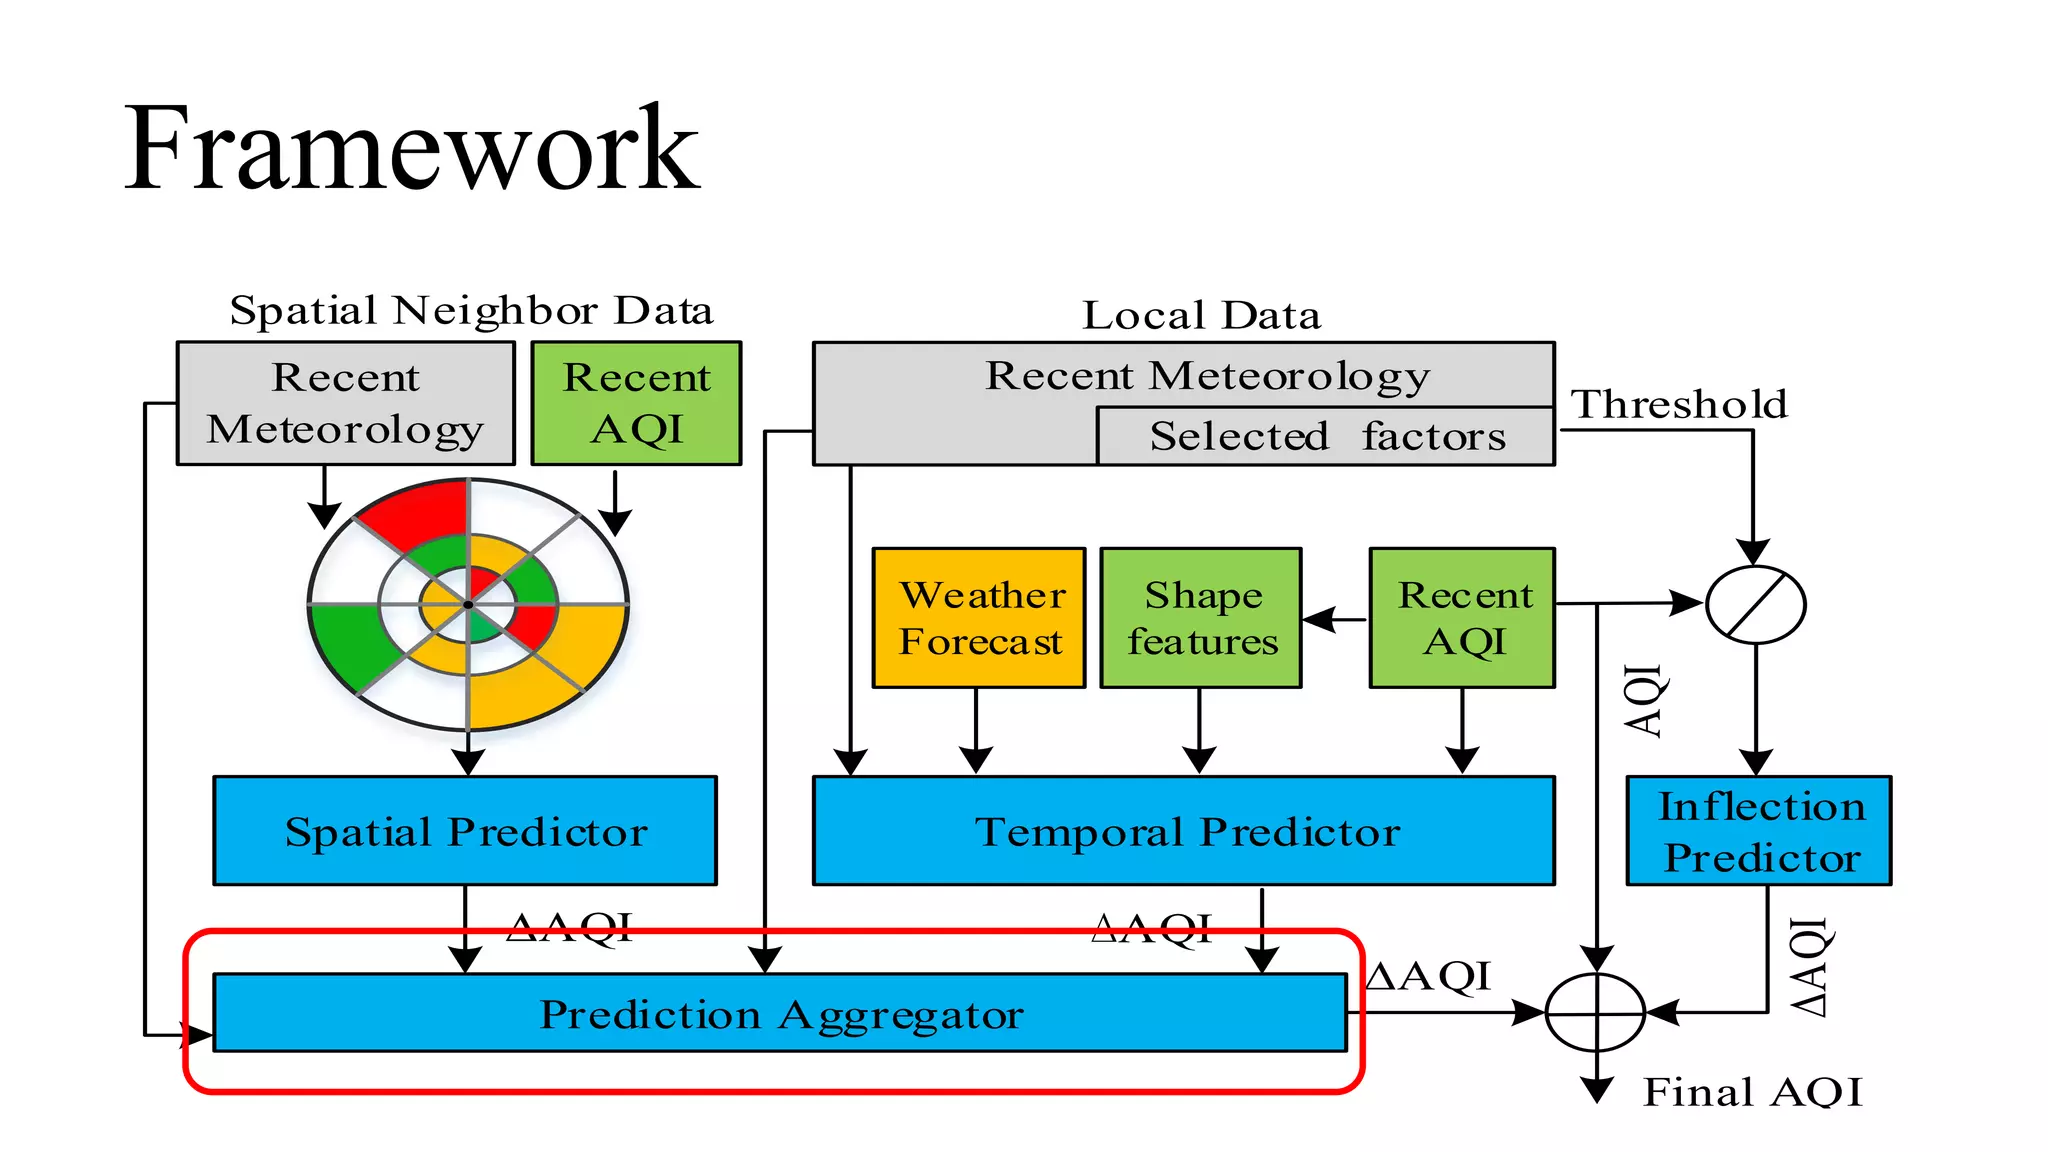
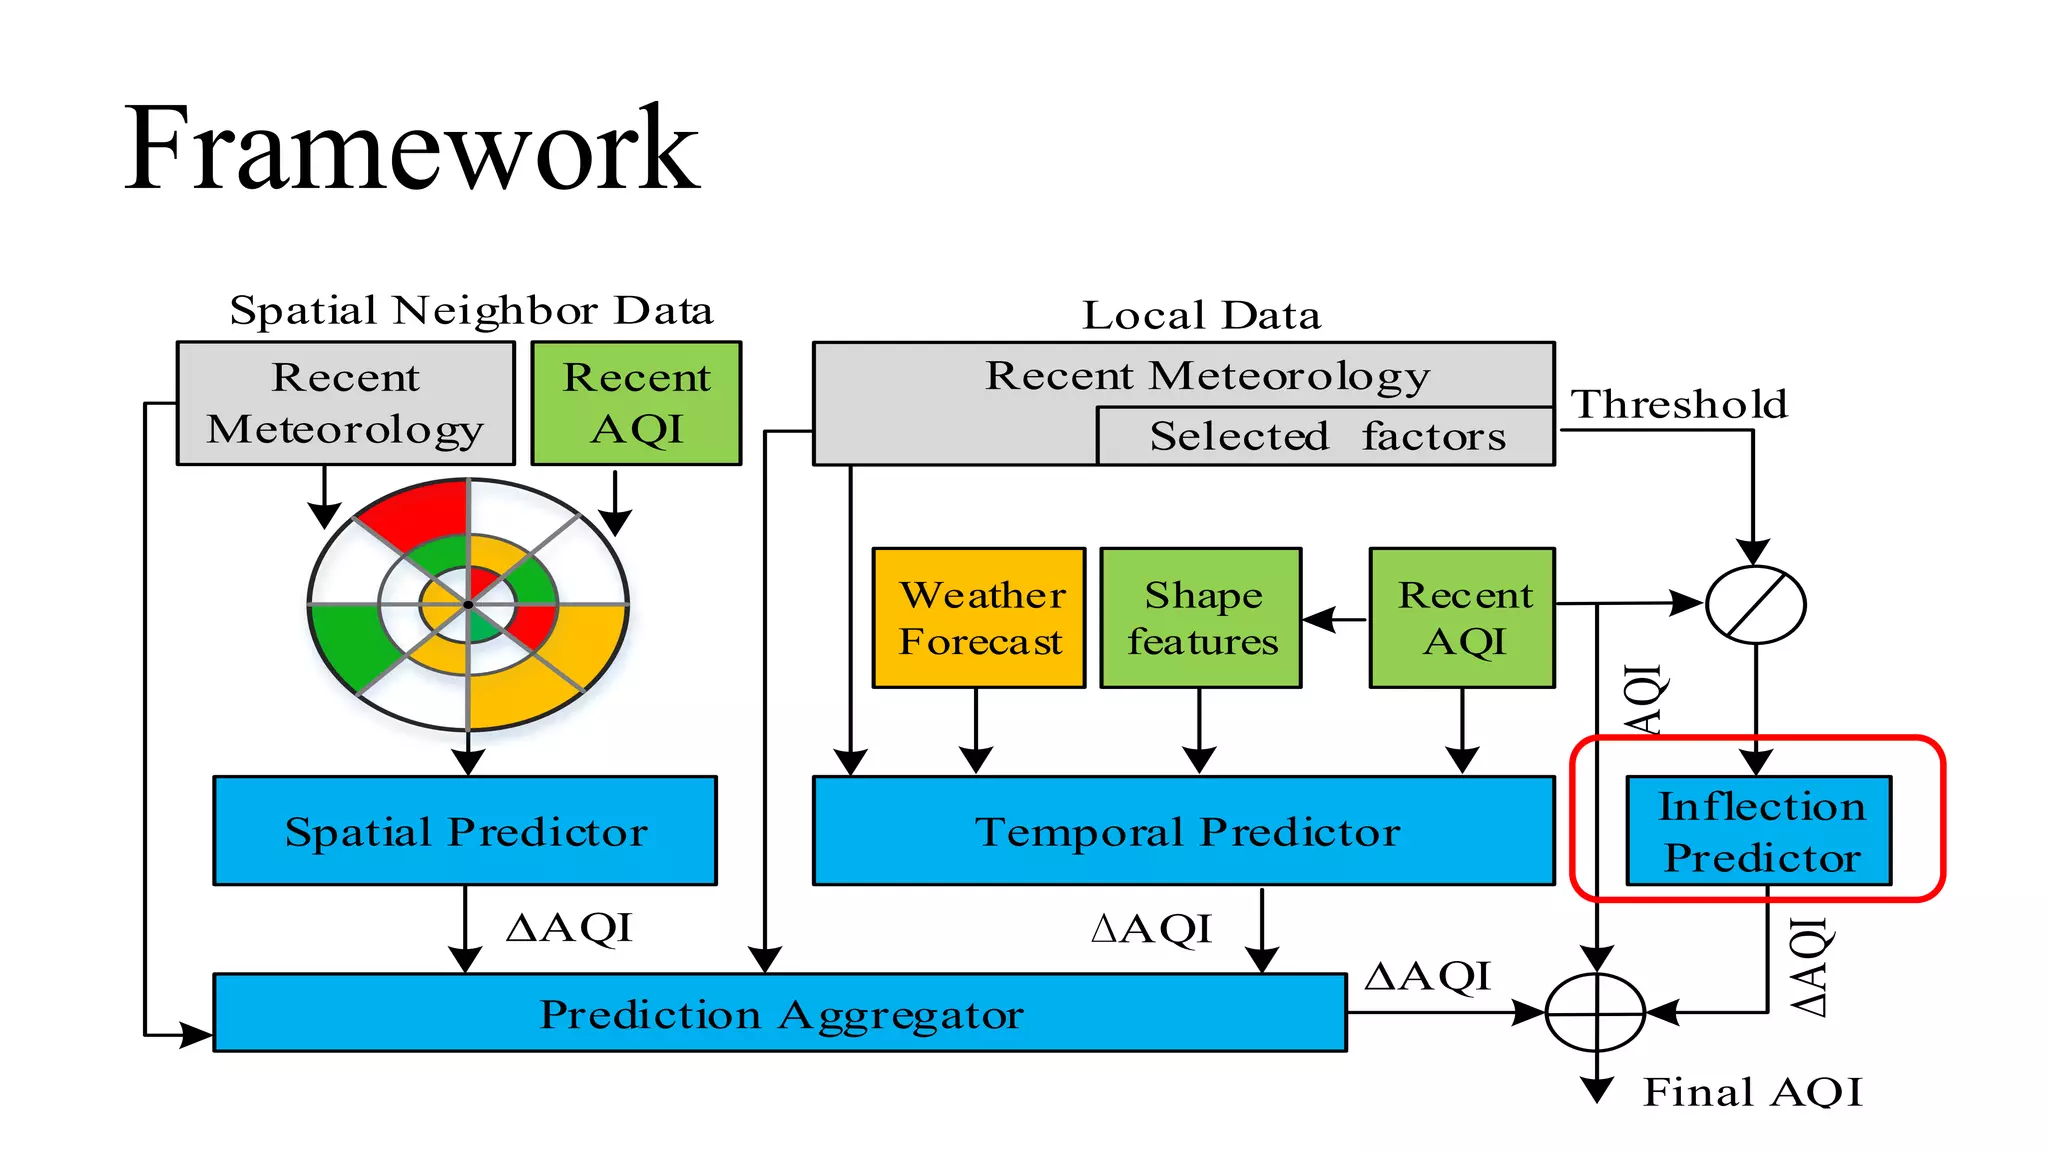
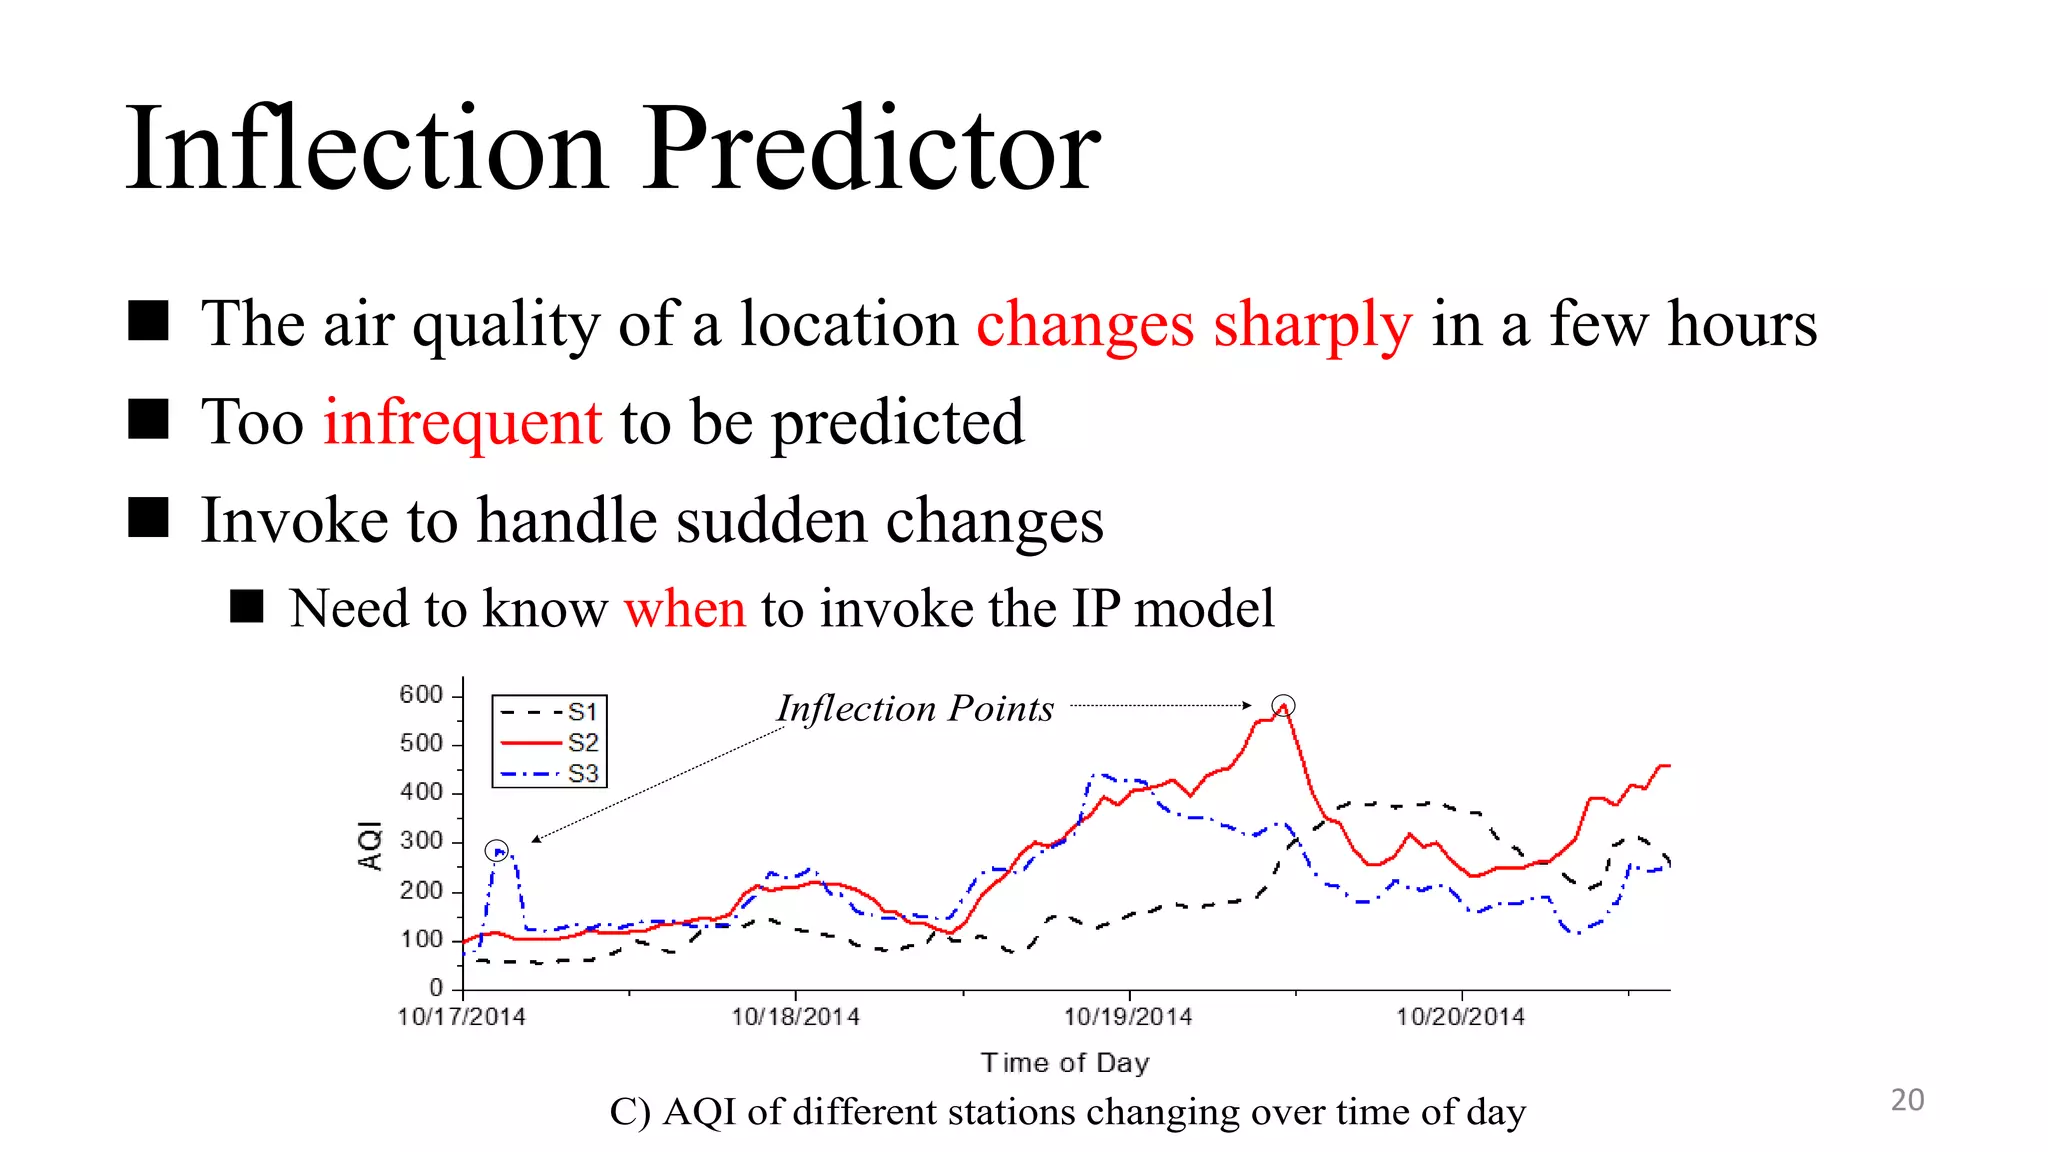
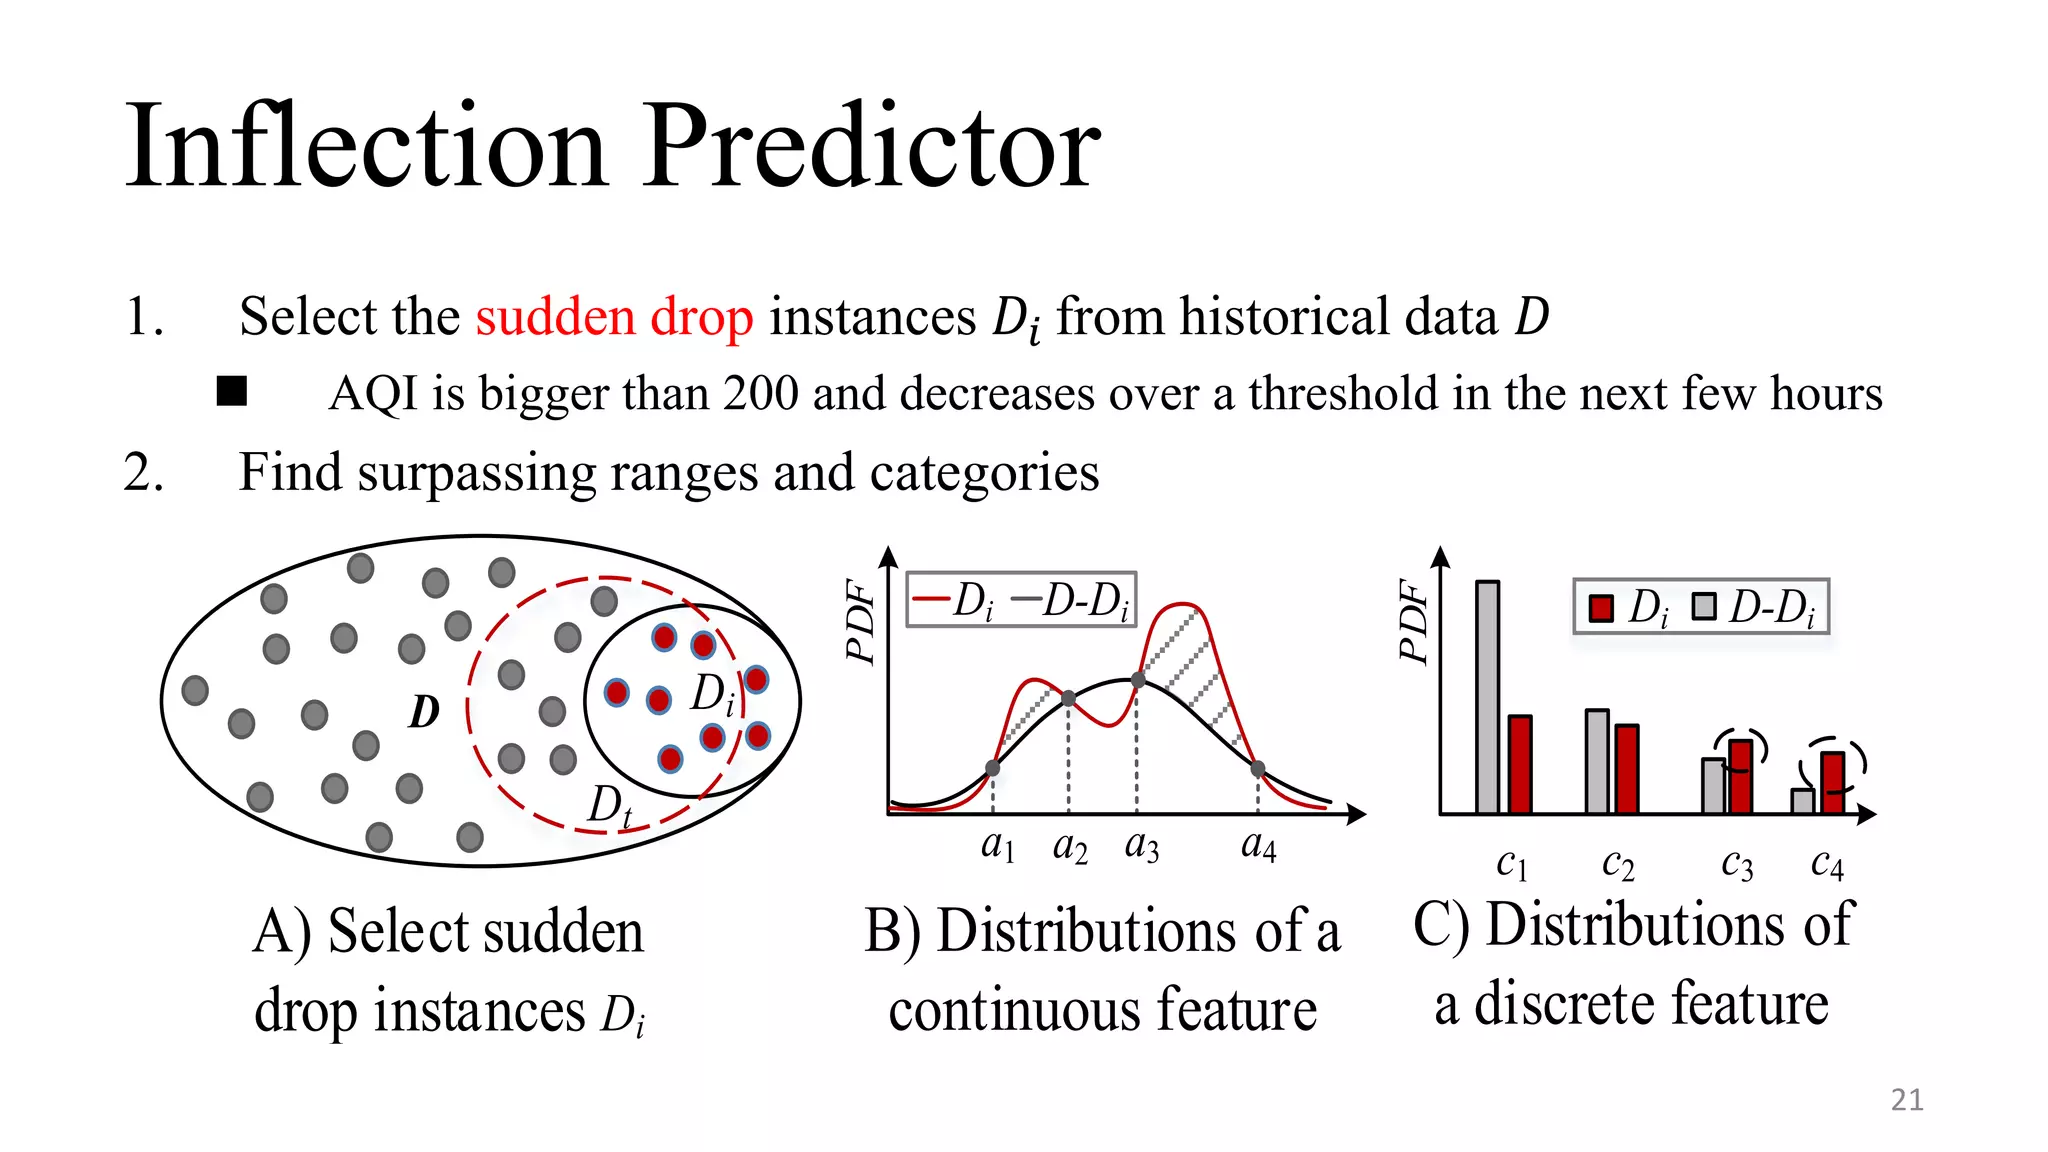
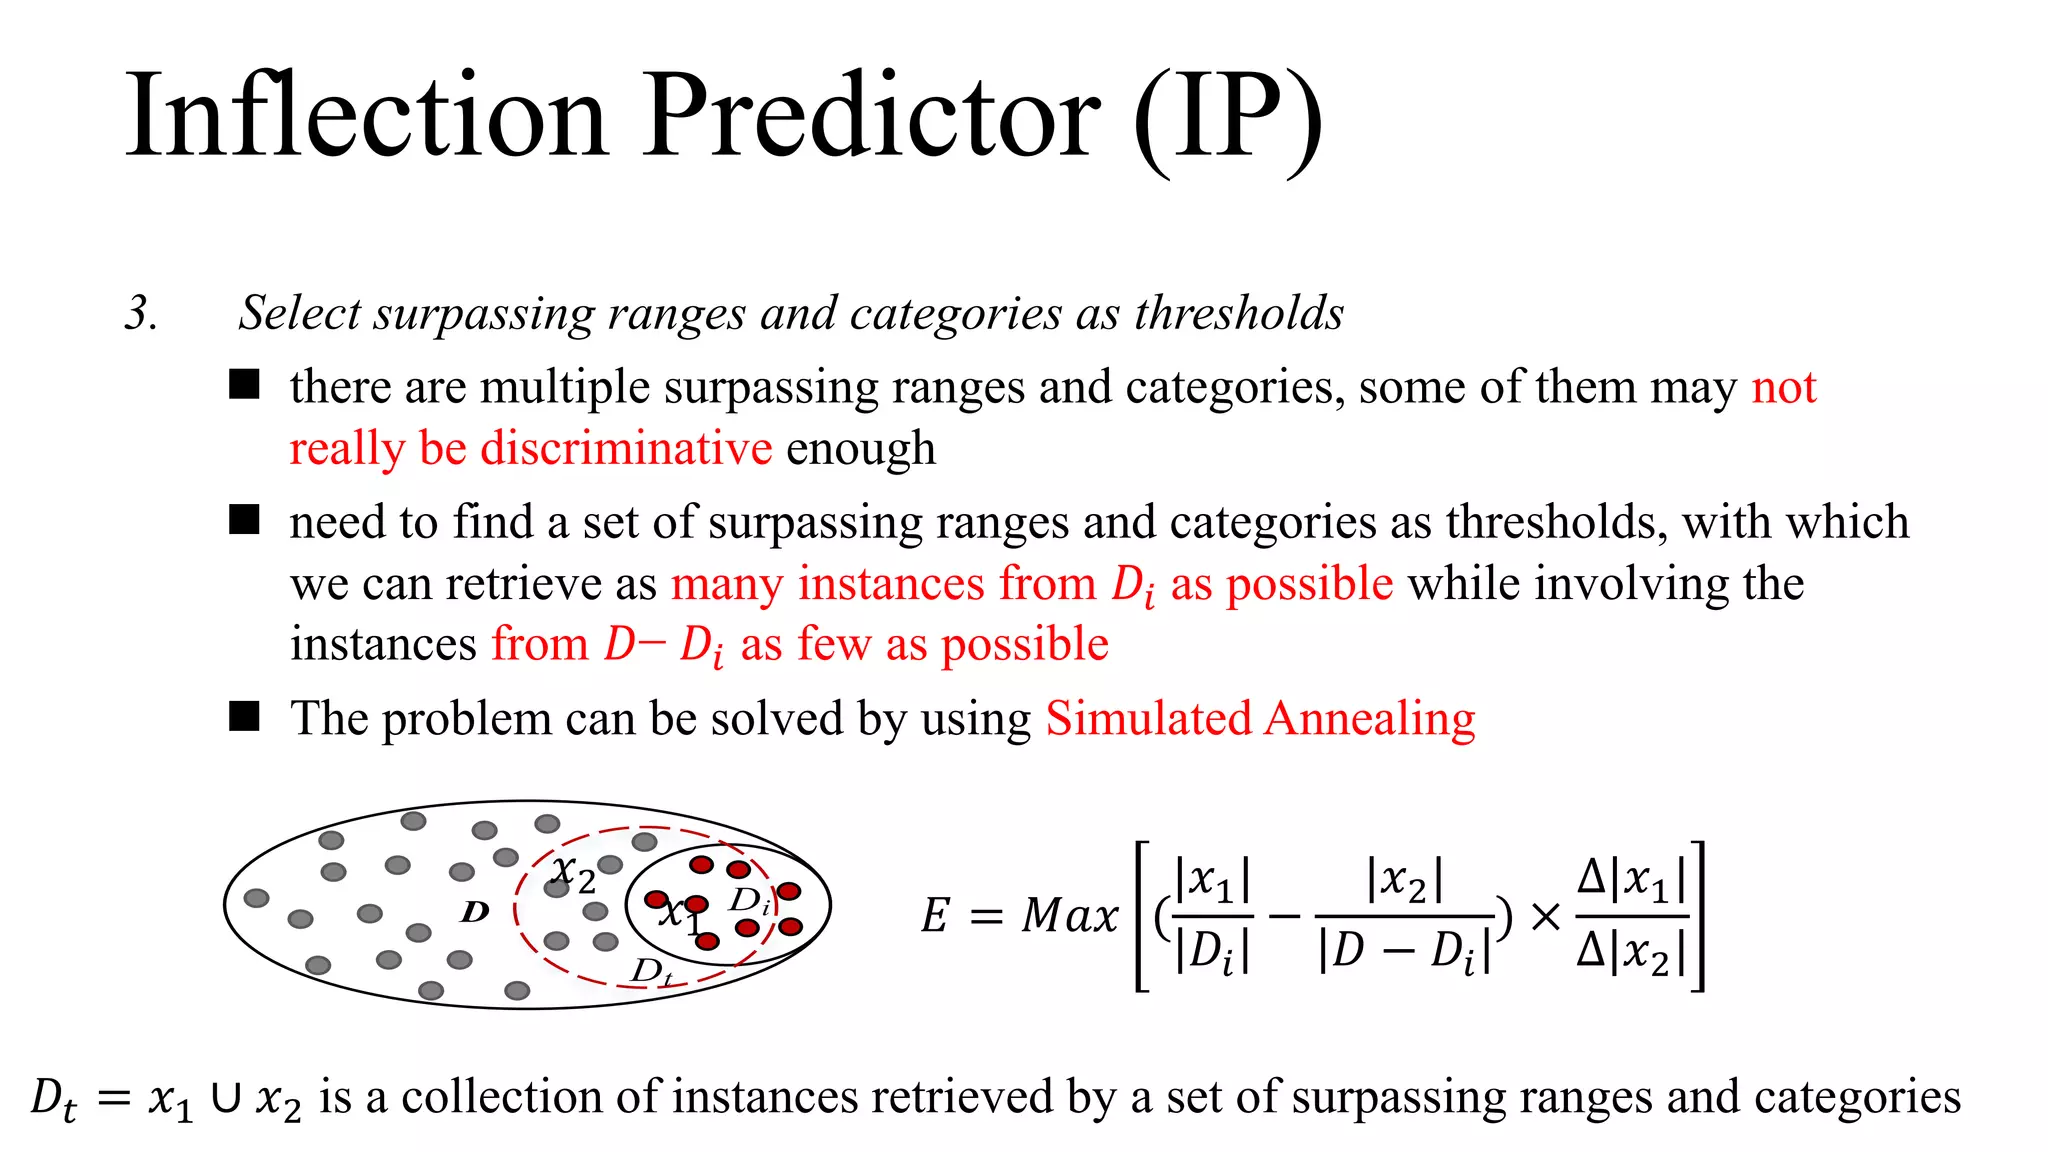
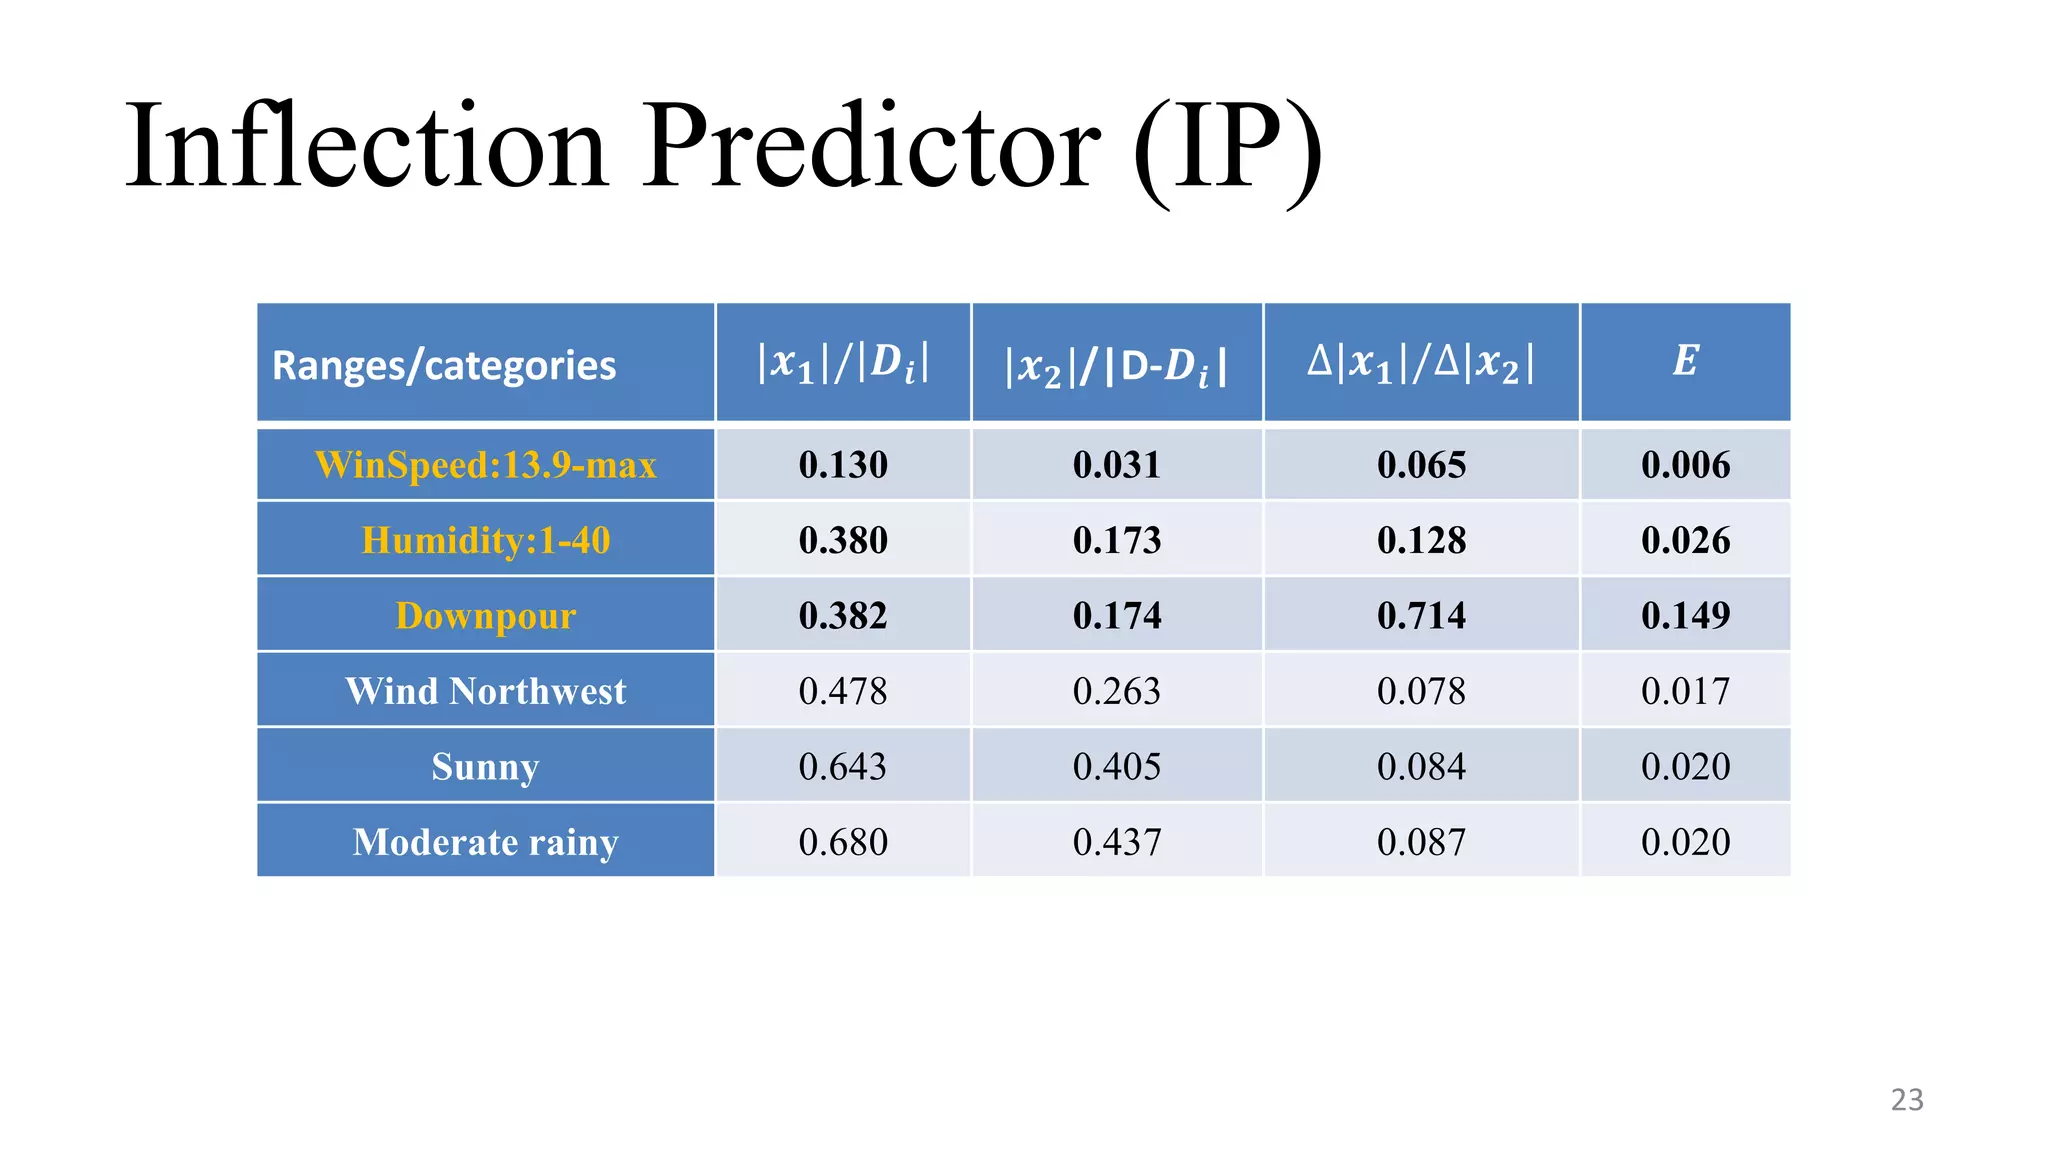
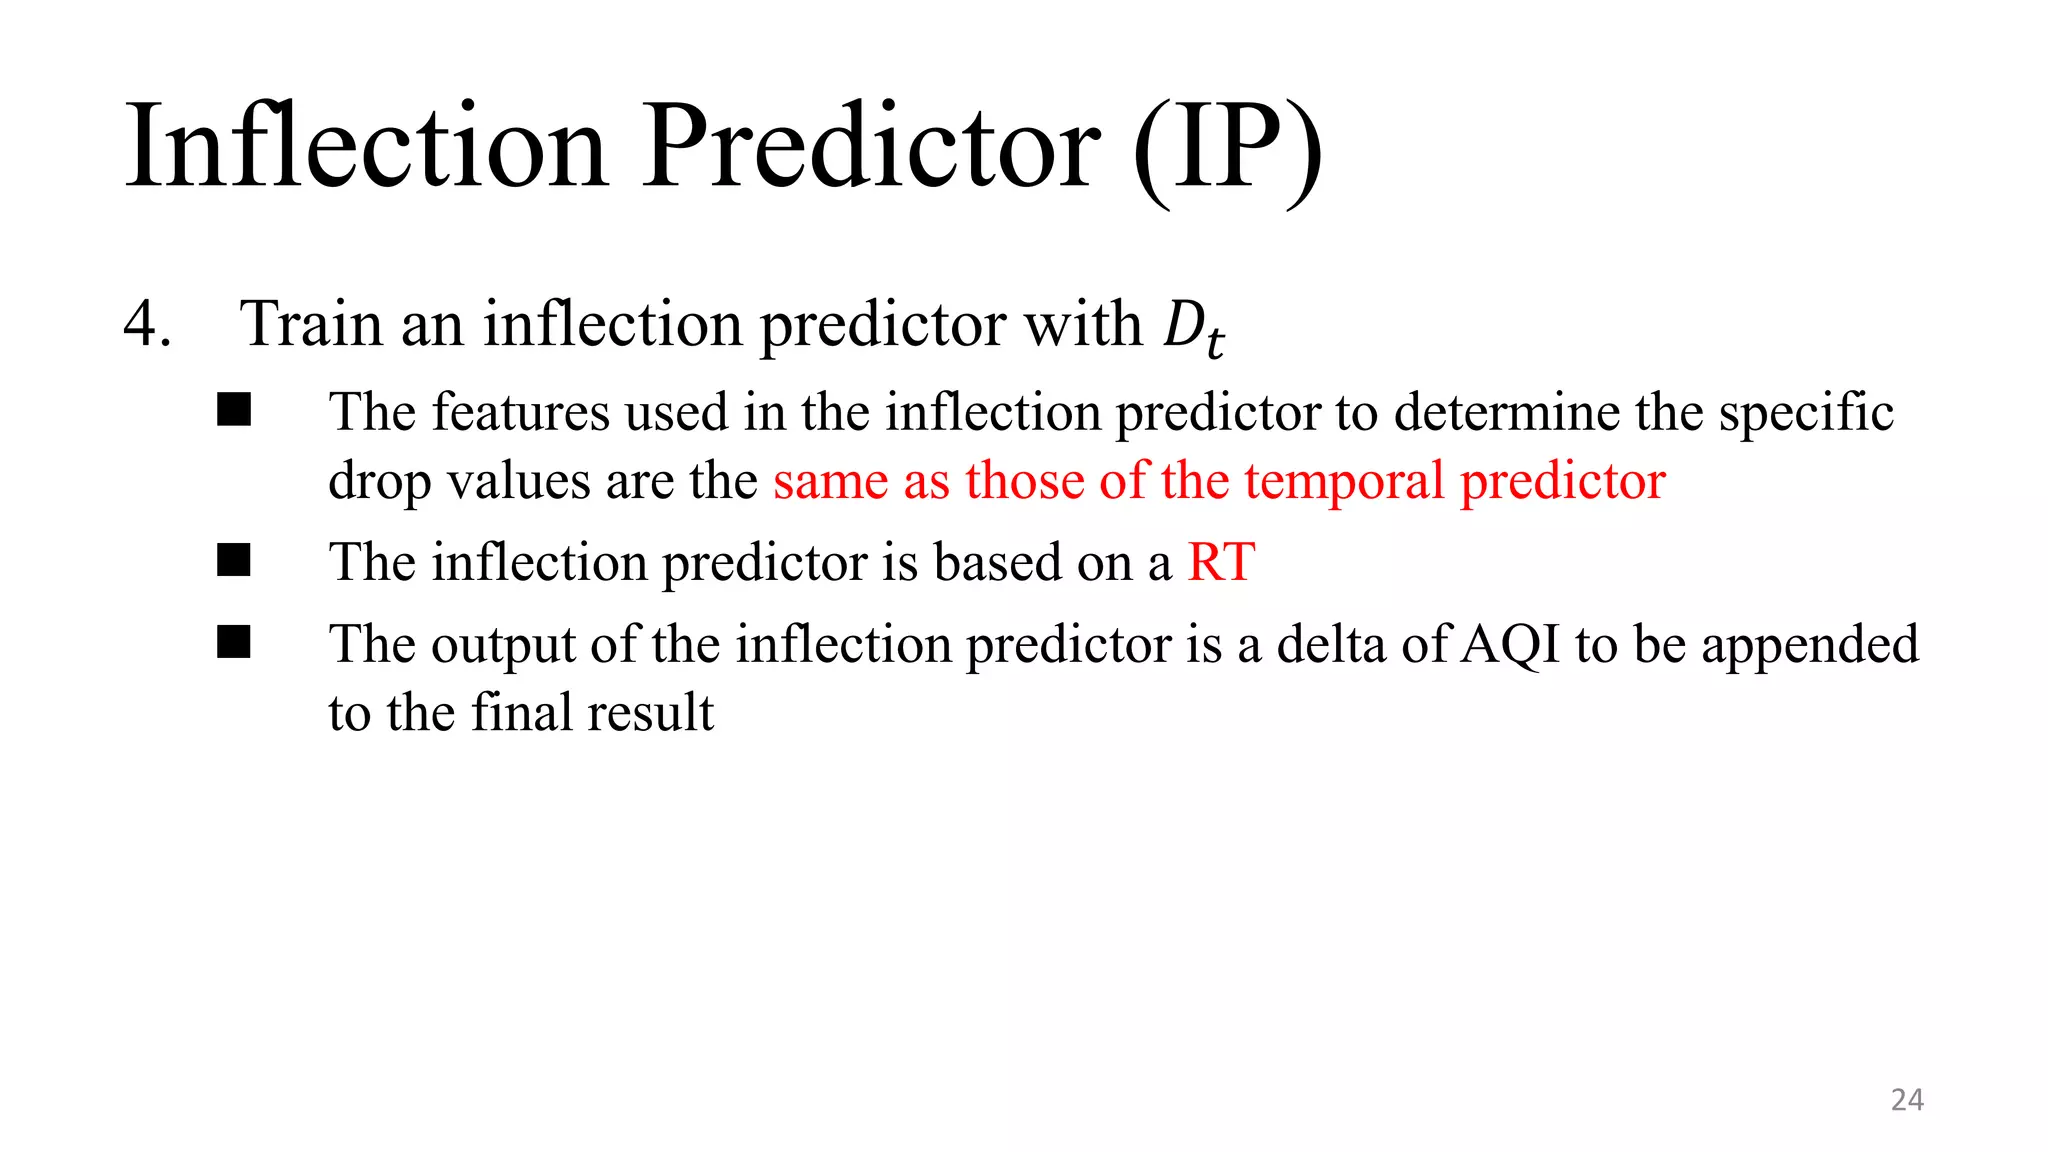
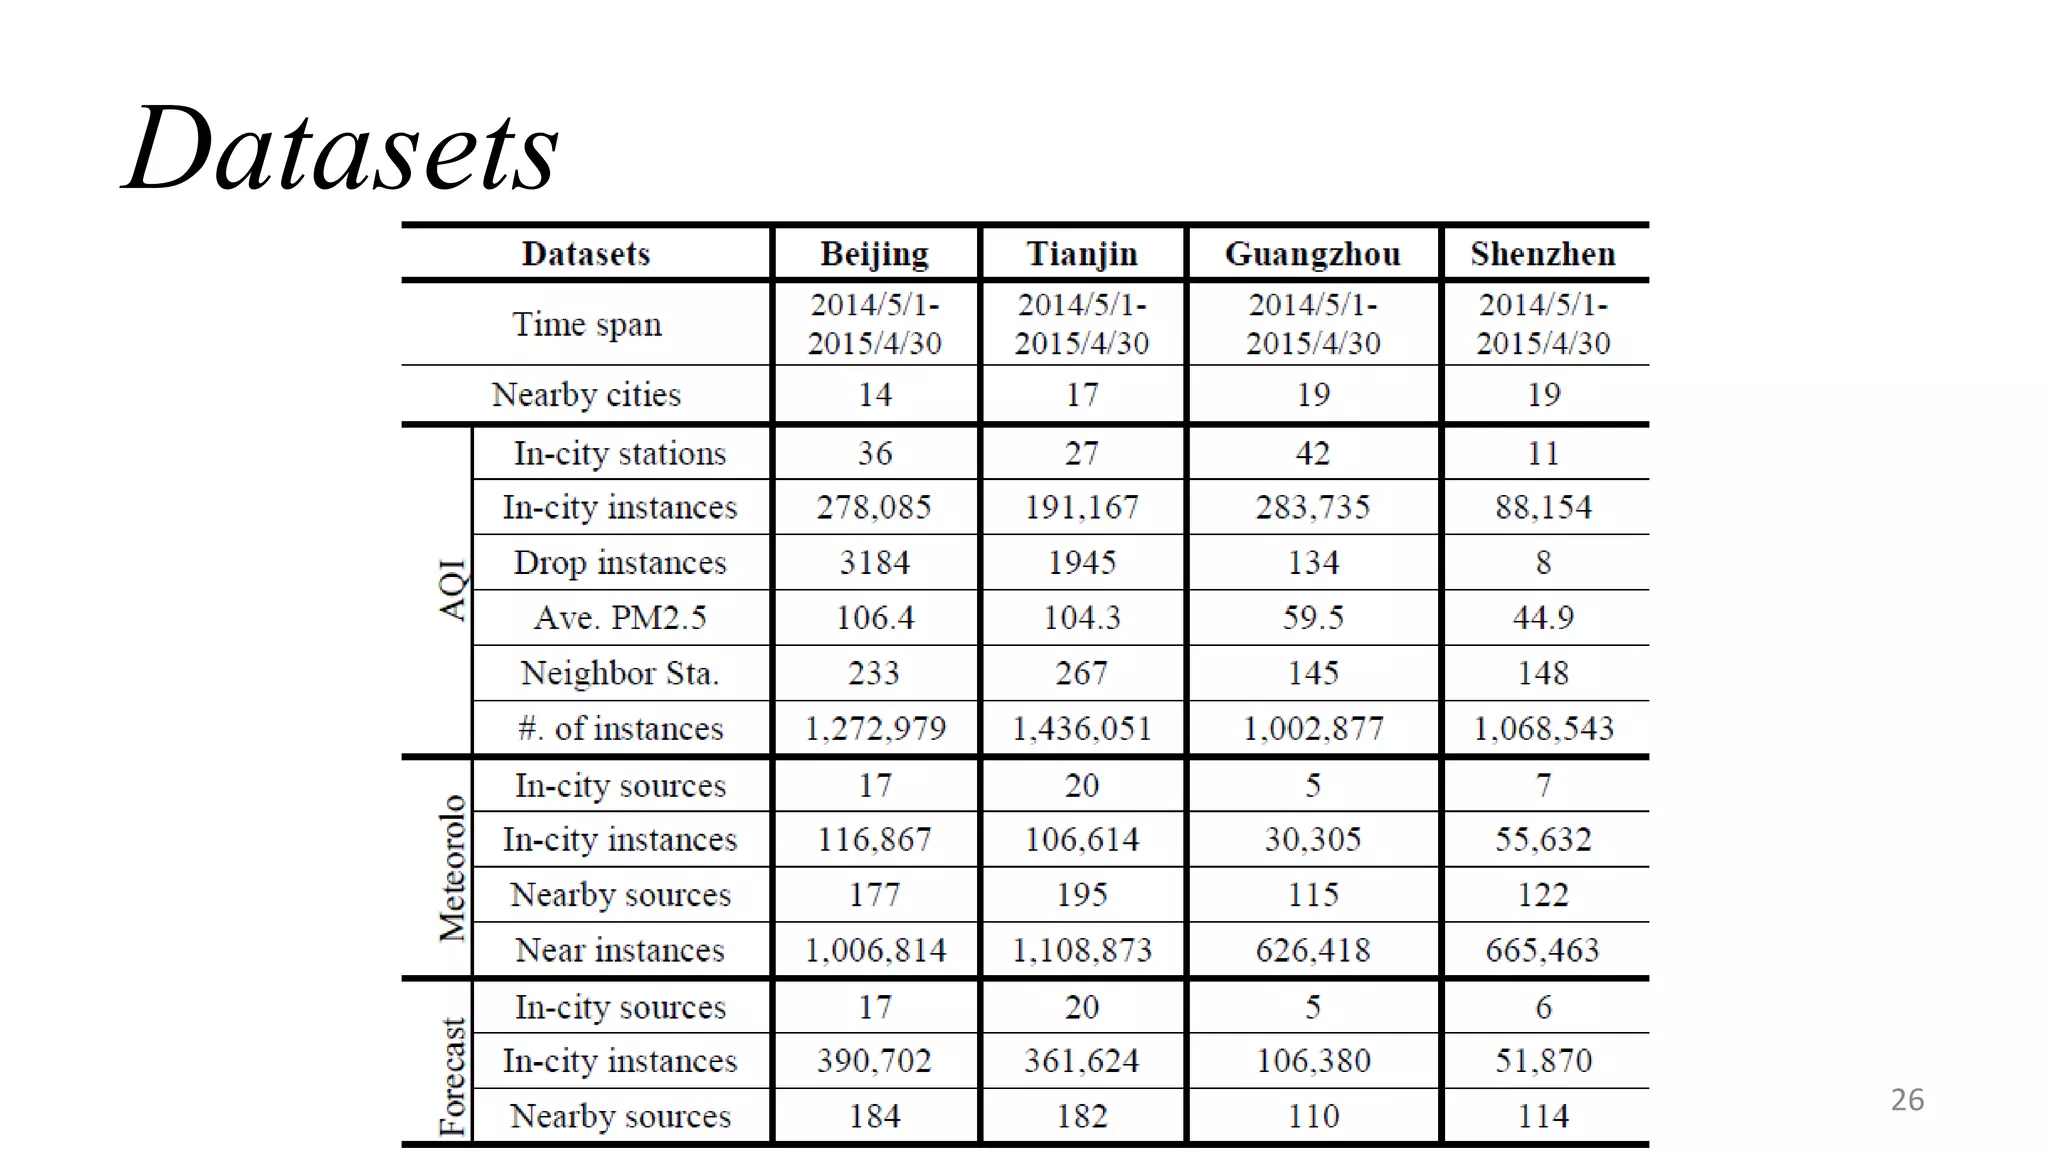
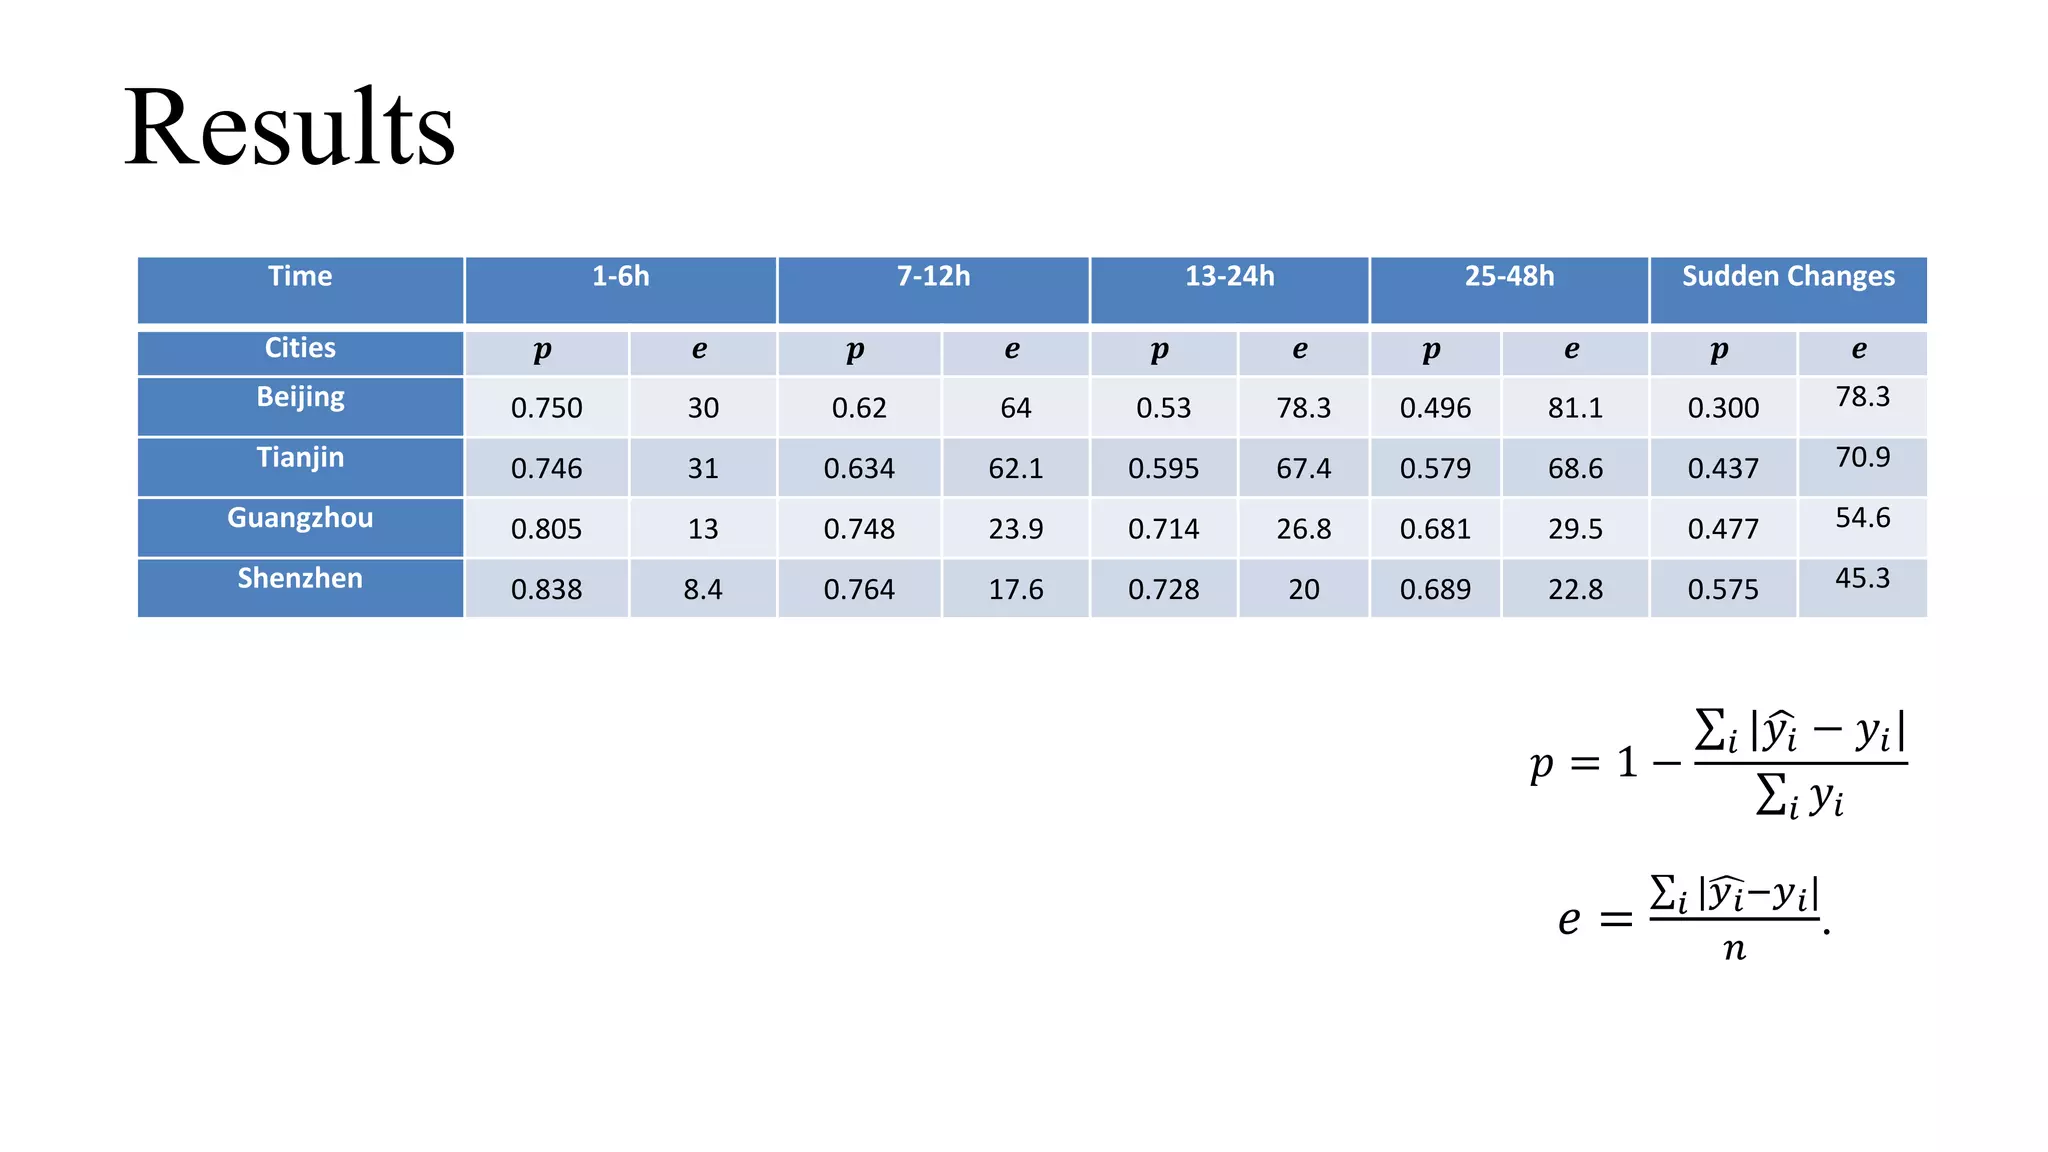
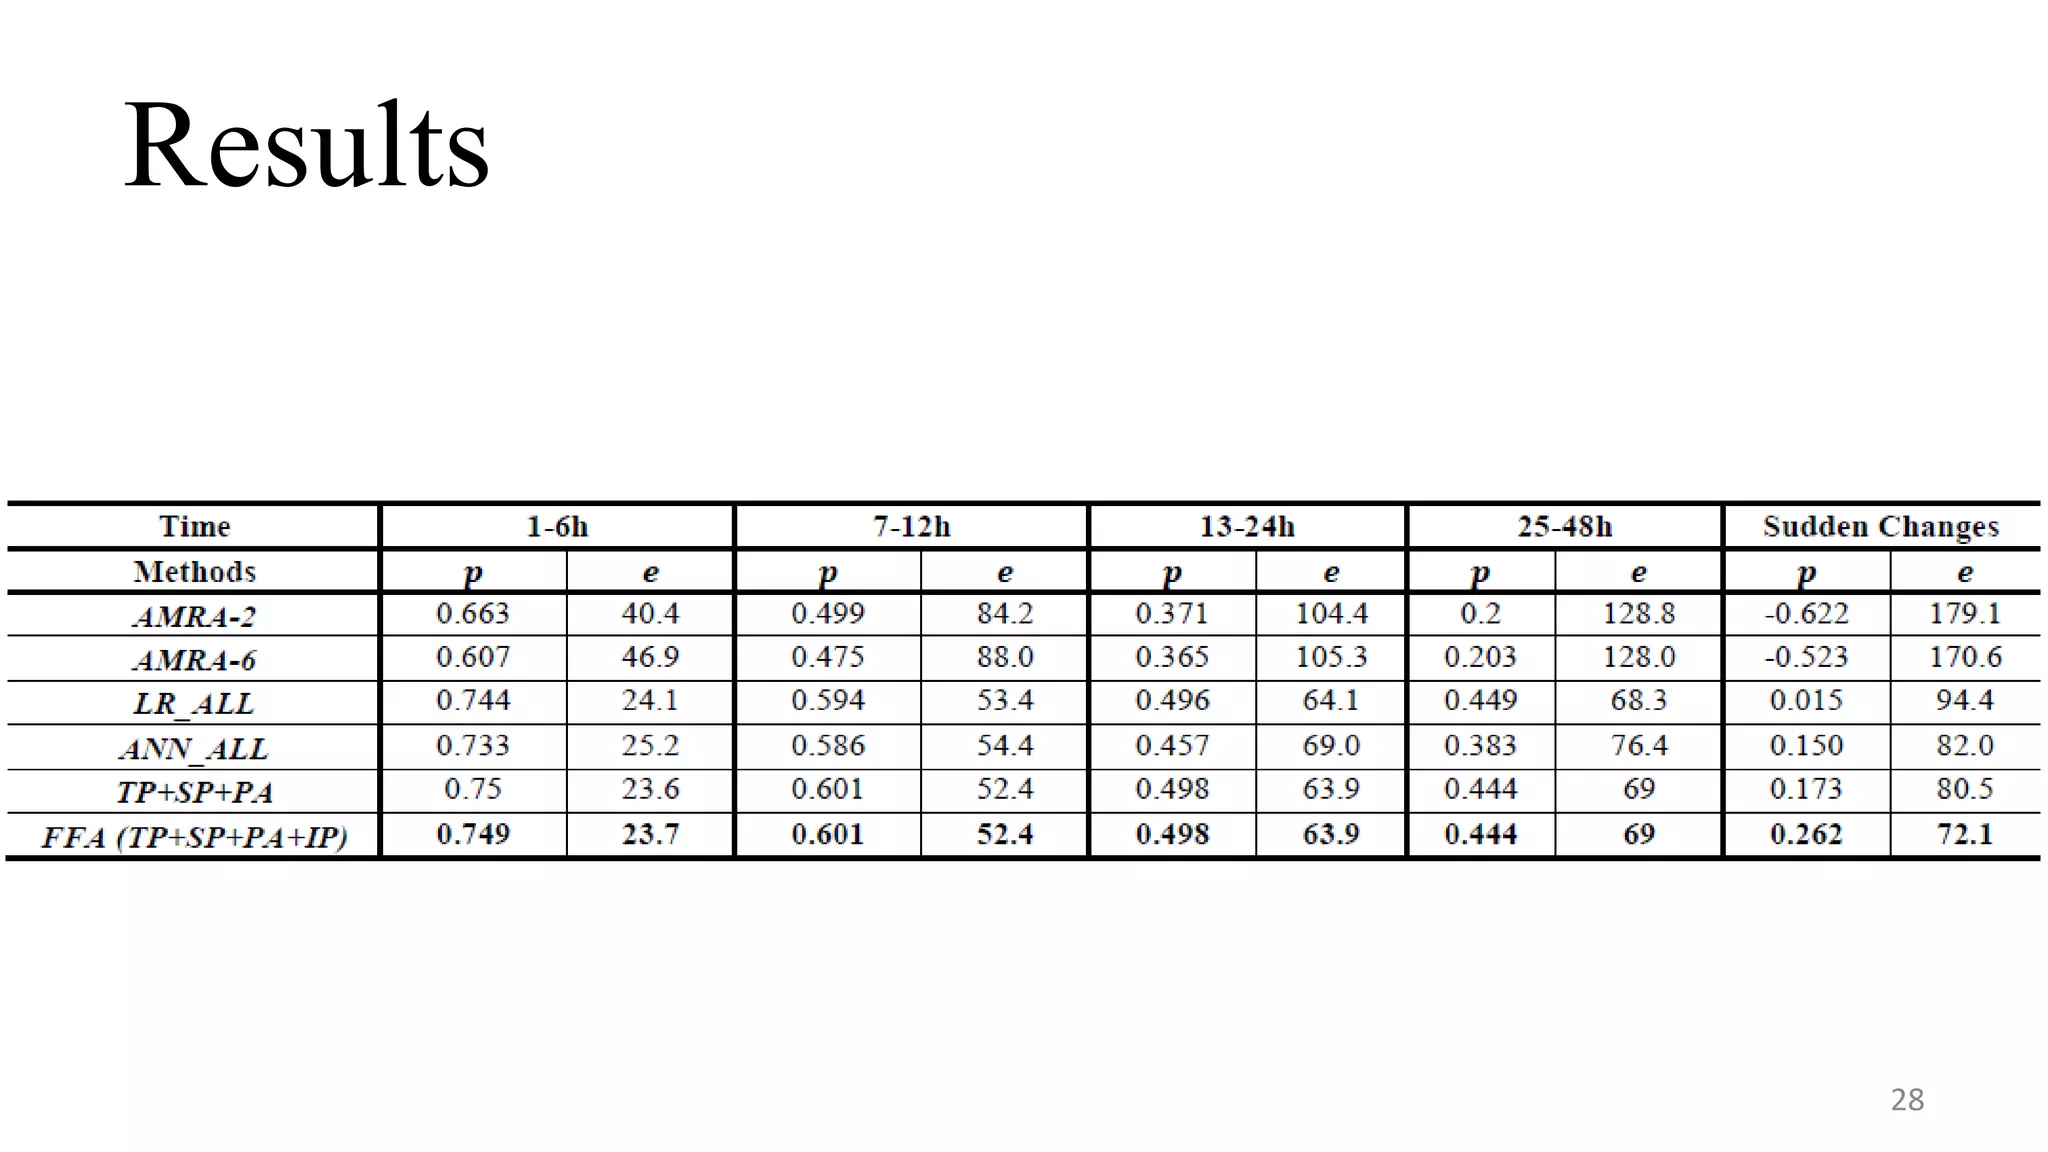
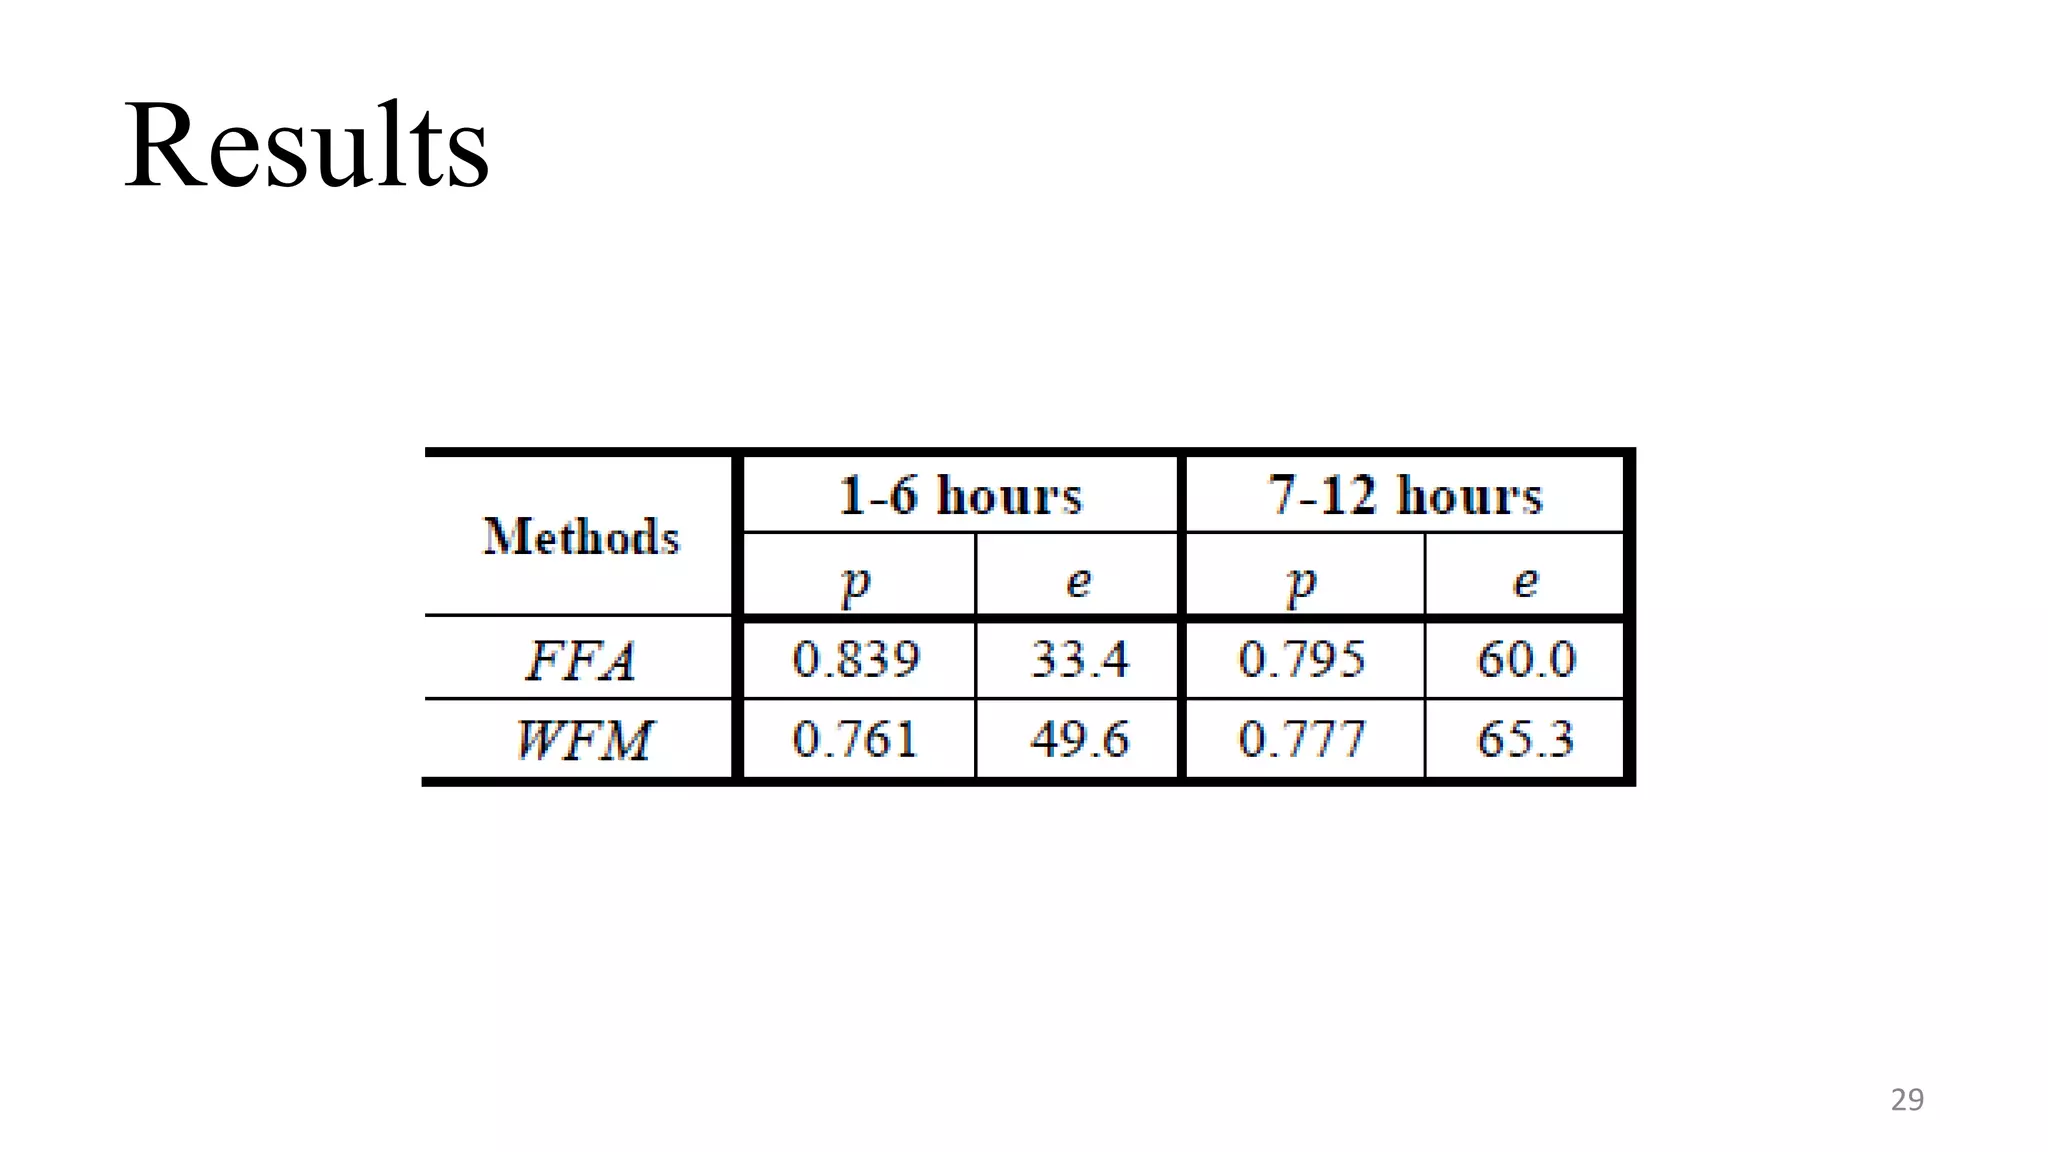
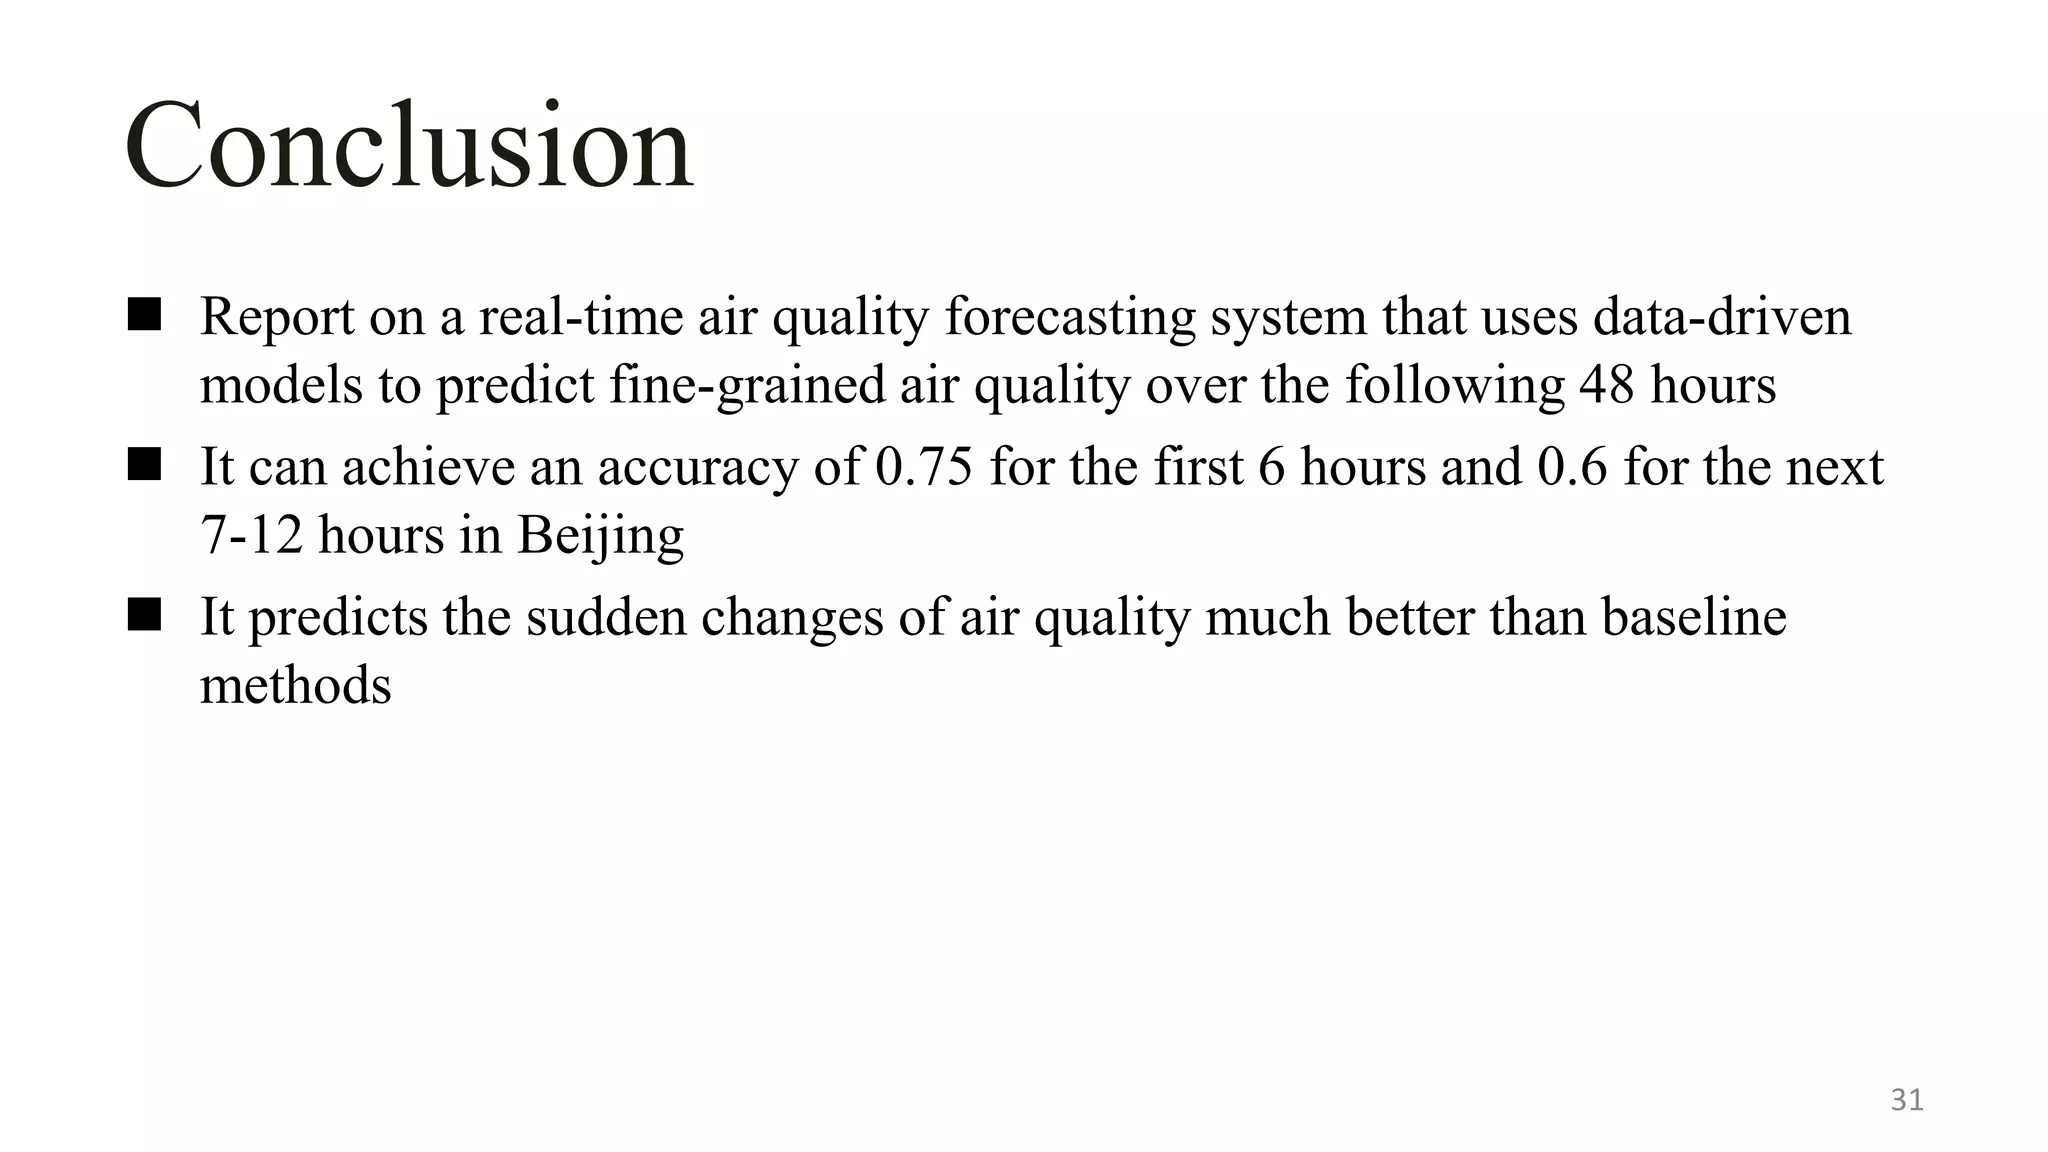
Forecasting Fine-Grained Air Quality
Based on Big Data
Date: 2015/10/15
Author: Yu Zheng, Xiuwen Yi, Ming Li1, Ruiyuan Li1, Zhangqing
Shan, Eric Chang, Tianrui Li
Source: KDD '15
Advisor: Jia-ling Koh
Spearker: LIN,CI-JIE
1
Outline
Introduction
Method
Experiment
Conclusion
2
Introduction
 People are increasingly concerned with air pollution, which impacts human
health and sustainable development around the world
 There is a rising demand for the prediction of future air quality, which can
inform people’s decision making
3
Challenges
 Multiple complex factors vs. insufficient and inaccurate data
 Urban air changes over location and time significantly
 Inflection points and sudden changes
Good [0-50) Moderate [50-100) Unhealthy [150-200)
Very Unhealthy [200-300)Unhealthy for sensitive [100-150)
A) Monitoring stations B) Distribution of the max-min gaps
C) AQI of different stations changing over time of day
Inflection Points
Introduction
 Goal: construct a real-time air quality forecasting system that
uses data-driven models to predict fine-grained air quality over
the following 48 hours(first 6, 7-12, 12-24, and 24-48 hours)
5
Outline
Introduction
Method
Experiment
Conclusion
6
Architecture of our system
7
Framework
Temporal Predictor
Inflection
Predictor
Spatial Predictor
Local Data
Shape
features
Recent
Meteorology
Weather
Forecast
Recent
AQI
AQIAQI
Prediction Aggregator
Spatial Neighbor Data
AQI
Recent Meteorology
Selected factors
Recent
AQI
Threshold
Final AQI
AQI
AQI
Framework
Temporal Predictor
Inflection
Predictor
Spatial Predictor
Local Data
Shape
features
Recent
Meteorology
Weather
Forecast
Recent
AQI
AQIAQI
Prediction Aggregator
Spatial Neighbor Data
AQI
Recent Meteorology
Selected factors
Recent
AQI
Threshold
Final AQI
AQI
AQI
Temporal Predictor (TP)
 Considering the prediction more from its own historical and future
conditions (local)
 A linear regression is employed to model the local change of air quality
 Train a model respectively for each hour in the next six hours, and two
models for each time interval (from 7 to 48 hours) to predict its maximum
and minimum values
10
tc-1 tctc-2tc-h+1 tc+1 tc+6tc+2 tc+7 tc+12 tc+24 tc+48tc+13 tc+25
Features
 The AQIs of the past ℎ hours at the station
 The local meteorology (such as sunny, overcast, cloudy, foggy, humidity,
wind speed, and direction) at the current time 𝑡 𝑐
 Time of day and day of the week
 The weather forecasts (including Sunny/overcast/cloudy, wind speed, and
wind direction) of the time interval we are going to predict
11
Framework
Temporal Predictor
Inflection
Predictor
Spatial Predictor
Local Data
Shape
features
Recent
Meteorology
Weather
Forecast
Recent
AQI
AQIAQI
Prediction Aggregator
Spatial Neighbor Data
AQI
Recent Meteorology
Selected factors
Recent
AQI
Threshold
Final AQI
AQI
AQI
Spatial Predictor (SP)
 Modeling the spatial correlation of air pollution
 Predicting the air quality from other locations’ status consisting of AQIs
and meteorological data
 Train multiple spatial predictors corresponding to different future time
intervals
 Two major steps:
 Spatial partition and aggregation
 Prediction based on a Neural Network
Spatial partition and aggregation
 Partition the spatial space into regions by using three circles with different
diameters
 Calculate the average AQI for a given kind of air pollutant; same for
temperature and humidity
 Each region will only have one set of aggregated air quality readings and
meteorology
14
A) Spatial partition B) Spatial aggregation
S
Spatial Predictor
15
 Features of SP
 the AQI of the past three hours (𝑨𝑸𝑰𝑖)
 meteorological features (𝑀 𝑖), including the wind speed and direction,
of the current time 𝑡 𝑐.
Framework
Temporal Predictor
Inflection
Predictor
Spatial Predictor
Local Data
Shape
features
Recent
Meteorology
Weather
Forecast
Recent
AQI
AQIAQI
Prediction Aggregator
Spatial Neighbor Data
AQI
Recent Meteorology
Selected factors
Recent
AQI
Threshold
Final AQI
AQI
AQI
Prediction Aggregator(PA)
 The prediction aggregator dynamically integrates the predictions that the
spatial and temporal predictors have made for a location
 Feature Set
 wind speed, direction, humidity, sunny, cloudy, overcast, and foggy
 the predictions generated by the spatial and temporal predictors
 the corresponding Δ𝐴𝑄𝐼 (from the ground truth)
 Train a Regression Tree (RT) to model the dynamic combination of these
factors and predictions
17
Prediction Aggregator(PA)
18
Spatial
0.003 >0.003
Temporal
-0.001
Foggy
Humidity
=1
54.56.62 >6.62
LM2 LM3
>-0.001
LM5
Temporal
LM4
-0.08 >-0.08
Spatial
Wind speed
>-0.14-0.14
LM1 LM8
=0
LM7
>54.5
LM6
LM 3:
AQI = 0.666×Spatial +
0.1627×Temporal +
0.001×isSunnyCloudyOvercast +
0.002×Foggy - 0.001×Wind_Dir_SE -
0.022×Wind_Dir_NE - 0.003×WinSpeed
- 0.0003×Humidity - 0.0452
LM 2:
AQI =
0.186×Spatial+2.52×Temporal+
0.001×SunnyCloudyOvercast +
0.002×Foggy-0.001×Wind_Dir_SE -
0.09×Wind_Dir_NE - 0.007×WinSpeed -
0.001×Humidity + 0.399
Framework
Temporal Predictor
Inflection
Predictor
Spatial Predictor
Local Data
Shape
features
Recent
Meteorology
Weather
Forecast
Recent
AQI
AQIAQI
Prediction Aggregator
Spatial Neighbor Data
AQI
Recent Meteorology
Selected factors
Recent
AQI
Threshold
Final AQI
AQI
AQI
Inflection Predictor
 The air quality of a location changes sharply in a few hours
 Too infrequent to be predicted
 Invoke to handle sudden changes
 Need to know when to invoke the IP model
20
Good [0-50) Moderate [50-100) Unhealthy [150-200)
Very Unhealthy [200-300)Unhealthy for sensitive [100-150)
A) Monitoring stations B) Distribution of the max-min gaps
C) AQI of different stations changing over time of day
Inflection Points
Inflection Predictor
1. Select the sudden drop instances 𝐷𝑖 from historical data 𝐷
 AQI is bigger than 200 and decreases over a threshold in the next few hours
2. Find surpassing ranges and categories
21
D Di
Dt
PDF
PDF
c1 c2 c3 c4
a1 a2 a4a3
A) Select sudden
drop instances Di
B) Distributions of a
continuous feature
Di D-Di Di D-Di
C) Distributions of
a discrete feature
D Di
Dt
Inflection Predictor (IP)
𝐸 = 𝑀𝑎𝑥 (
|𝑥1|
𝐷𝑖
−
|𝑥2|
𝐷 − 𝐷𝑖
) ×
∆|𝑥1|
∆|𝑥2|
𝐷𝑡 = 𝑥1 ∪ 𝑥2 is a collection of instances retrieved by a set of surpassing ranges and categories
𝑥1
𝑥2
3. Select surpassing ranges and categories as thresholds
 there are multiple surpassing ranges and categories, some of them may not
really be discriminative enough
 need to find a set of surpassing ranges and categories as thresholds, with which
we can retrieve as many instances from 𝐷𝑖 as possible while involving the
instances from 𝐷− 𝐷𝑖 as few as possible
 The problem can be solved by using Simulated Annealing
Inflection Predictor (IP)
23
Ranges/categories |𝒙 𝟏|/ 𝑫𝒊 |𝒙 𝟐|/|D-𝑫𝒊| ∆|𝒙 𝟏|/∆|𝒙 𝟐| 𝑬
WinSpeed:13.9-max 0.130 0.031 0.065 0.006
Humidity:1-40 0.380 0.173 0.128 0.026
Downpour 0.382 0.174 0.714 0.149
Wind Northwest 0.478 0.263 0.078 0.017
Sunny 0.643 0.405 0.084 0.020
Moderate rainy 0.680 0.437 0.087 0.020
Inflection Predictor (IP)
4. Train an inflection predictor with 𝐷𝑡
 The features used in the inflection predictor to determine the specific
drop values are the same as those of the temporal predictor
 The inflection predictor is based on a RT
 The output of the inflection predictor is a delta of AQI to be appended
to the final result
24
Outline
Introduction
Method
Experiment
Conclusion
25
Datasets
26
Results
Time 1-6h 7-12h 13-24h 25-48h Sudden Changes
Cities 𝒑 𝒆 𝒑 𝒆 𝒑 𝒆 𝒑 𝒆 𝒑 𝒆
Beijing 0.750 30 0.62 64 0.53 78.3 0.496 81.1 0.300 78.3
Tianjin 0.746 31 0.634 62.1 0.595 67.4 0.579 68.6 0.437 70.9
Guangzhou 0.805 13 0.748 23.9 0.714 26.8 0.681 29.5 0.477 54.6
Shenzhen 0.838 8.4 0.764 17.6 0.728 20 0.689 22.8 0.575 45.3
𝑝 = 1 −
𝑖 | 𝑦𝑖 − 𝑦𝑖|
𝑖 𝑦𝑖
𝑒 = 𝑖 | 𝑦 𝑖−𝑦 𝑖|
𝑛
.
Results
28
Results
29
Outline
Introduction
Method
Experiment
Conclusion
30
Conclusion
 Report on a real-time air quality forecasting system that uses data-driven
models to predict fine-grained air quality over the following 48 hours
 It can achieve an accuracy of 0.75 for the first 6 hours and 0.6 for the next
7-12 hours in Beijing
 It predicts the sudden changes of air quality much better than baseline
methods
31
Thanks for listening
32

Forecasting fine grained air quality based on big data

  • 1.
    Forecasting Fine-Grained AirQuality Based on Big Data Date: 2015/10/15 Author: Yu Zheng, Xiuwen Yi, Ming Li1, Ruiyuan Li1, Zhangqing Shan, Eric Chang, Tianrui Li Source: KDD '15 Advisor: Jia-ling Koh Spearker: LIN,CI-JIE 1
  • 2.
  • 3.
    Introduction  People areincreasingly concerned with air pollution, which impacts human health and sustainable development around the world  There is a rising demand for the prediction of future air quality, which can inform people’s decision making 3
  • 4.
    Challenges  Multiple complexfactors vs. insufficient and inaccurate data  Urban air changes over location and time significantly  Inflection points and sudden changes Good [0-50) Moderate [50-100) Unhealthy [150-200) Very Unhealthy [200-300)Unhealthy for sensitive [100-150) A) Monitoring stations B) Distribution of the max-min gaps C) AQI of different stations changing over time of day Inflection Points
  • 5.
    Introduction  Goal: constructa real-time air quality forecasting system that uses data-driven models to predict fine-grained air quality over the following 48 hours(first 6, 7-12, 12-24, and 24-48 hours) 5
  • 6.
  • 7.
  • 8.
    Framework Temporal Predictor Inflection Predictor Spatial Predictor LocalData Shape features Recent Meteorology Weather Forecast Recent AQI AQIAQI Prediction Aggregator Spatial Neighbor Data AQI Recent Meteorology Selected factors Recent AQI Threshold Final AQI AQI AQI
  • 9.
    Framework Temporal Predictor Inflection Predictor Spatial Predictor LocalData Shape features Recent Meteorology Weather Forecast Recent AQI AQIAQI Prediction Aggregator Spatial Neighbor Data AQI Recent Meteorology Selected factors Recent AQI Threshold Final AQI AQI AQI
  • 10.
    Temporal Predictor (TP) Considering the prediction more from its own historical and future conditions (local)  A linear regression is employed to model the local change of air quality  Train a model respectively for each hour in the next six hours, and two models for each time interval (from 7 to 48 hours) to predict its maximum and minimum values 10 tc-1 tctc-2tc-h+1 tc+1 tc+6tc+2 tc+7 tc+12 tc+24 tc+48tc+13 tc+25
  • 11.
    Features  The AQIsof the past ℎ hours at the station  The local meteorology (such as sunny, overcast, cloudy, foggy, humidity, wind speed, and direction) at the current time 𝑡 𝑐  Time of day and day of the week  The weather forecasts (including Sunny/overcast/cloudy, wind speed, and wind direction) of the time interval we are going to predict 11
  • 12.
    Framework Temporal Predictor Inflection Predictor Spatial Predictor LocalData Shape features Recent Meteorology Weather Forecast Recent AQI AQIAQI Prediction Aggregator Spatial Neighbor Data AQI Recent Meteorology Selected factors Recent AQI Threshold Final AQI AQI AQI
  • 13.
    Spatial Predictor (SP) Modeling the spatial correlation of air pollution  Predicting the air quality from other locations’ status consisting of AQIs and meteorological data  Train multiple spatial predictors corresponding to different future time intervals  Two major steps:  Spatial partition and aggregation  Prediction based on a Neural Network
  • 14.
    Spatial partition andaggregation  Partition the spatial space into regions by using three circles with different diameters  Calculate the average AQI for a given kind of air pollutant; same for temperature and humidity  Each region will only have one set of aggregated air quality readings and meteorology 14 A) Spatial partition B) Spatial aggregation S
  • 15.
    Spatial Predictor 15  Featuresof SP  the AQI of the past three hours (𝑨𝑸𝑰𝑖)  meteorological features (𝑀 𝑖), including the wind speed and direction, of the current time 𝑡 𝑐.
  • 16.
    Framework Temporal Predictor Inflection Predictor Spatial Predictor LocalData Shape features Recent Meteorology Weather Forecast Recent AQI AQIAQI Prediction Aggregator Spatial Neighbor Data AQI Recent Meteorology Selected factors Recent AQI Threshold Final AQI AQI AQI
  • 17.
    Prediction Aggregator(PA)  Theprediction aggregator dynamically integrates the predictions that the spatial and temporal predictors have made for a location  Feature Set  wind speed, direction, humidity, sunny, cloudy, overcast, and foggy  the predictions generated by the spatial and temporal predictors  the corresponding Δ𝐴𝑄𝐼 (from the ground truth)  Train a Regression Tree (RT) to model the dynamic combination of these factors and predictions 17
  • 18.
    Prediction Aggregator(PA) 18 Spatial 0.003 >0.003 Temporal -0.001 Foggy Humidity =1 54.56.62>6.62 LM2 LM3 >-0.001 LM5 Temporal LM4 -0.08 >-0.08 Spatial Wind speed >-0.14-0.14 LM1 LM8 =0 LM7 >54.5 LM6 LM 3: AQI = 0.666×Spatial + 0.1627×Temporal + 0.001×isSunnyCloudyOvercast + 0.002×Foggy - 0.001×Wind_Dir_SE - 0.022×Wind_Dir_NE - 0.003×WinSpeed - 0.0003×Humidity - 0.0452 LM 2: AQI = 0.186×Spatial+2.52×Temporal+ 0.001×SunnyCloudyOvercast + 0.002×Foggy-0.001×Wind_Dir_SE - 0.09×Wind_Dir_NE - 0.007×WinSpeed - 0.001×Humidity + 0.399
  • 19.
    Framework Temporal Predictor Inflection Predictor Spatial Predictor LocalData Shape features Recent Meteorology Weather Forecast Recent AQI AQIAQI Prediction Aggregator Spatial Neighbor Data AQI Recent Meteorology Selected factors Recent AQI Threshold Final AQI AQI AQI
  • 20.
    Inflection Predictor  Theair quality of a location changes sharply in a few hours  Too infrequent to be predicted  Invoke to handle sudden changes  Need to know when to invoke the IP model 20 Good [0-50) Moderate [50-100) Unhealthy [150-200) Very Unhealthy [200-300)Unhealthy for sensitive [100-150) A) Monitoring stations B) Distribution of the max-min gaps C) AQI of different stations changing over time of day Inflection Points
  • 21.
    Inflection Predictor 1. Selectthe sudden drop instances 𝐷𝑖 from historical data 𝐷  AQI is bigger than 200 and decreases over a threshold in the next few hours 2. Find surpassing ranges and categories 21 D Di Dt PDF PDF c1 c2 c3 c4 a1 a2 a4a3 A) Select sudden drop instances Di B) Distributions of a continuous feature Di D-Di Di D-Di C) Distributions of a discrete feature
  • 22.
    D Di Dt Inflection Predictor(IP) 𝐸 = 𝑀𝑎𝑥 ( |𝑥1| 𝐷𝑖 − |𝑥2| 𝐷 − 𝐷𝑖 ) × ∆|𝑥1| ∆|𝑥2| 𝐷𝑡 = 𝑥1 ∪ 𝑥2 is a collection of instances retrieved by a set of surpassing ranges and categories 𝑥1 𝑥2 3. Select surpassing ranges and categories as thresholds  there are multiple surpassing ranges and categories, some of them may not really be discriminative enough  need to find a set of surpassing ranges and categories as thresholds, with which we can retrieve as many instances from 𝐷𝑖 as possible while involving the instances from 𝐷− 𝐷𝑖 as few as possible  The problem can be solved by using Simulated Annealing
  • 23.
    Inflection Predictor (IP) 23 Ranges/categories|𝒙 𝟏|/ 𝑫𝒊 |𝒙 𝟐|/|D-𝑫𝒊| ∆|𝒙 𝟏|/∆|𝒙 𝟐| 𝑬 WinSpeed:13.9-max 0.130 0.031 0.065 0.006 Humidity:1-40 0.380 0.173 0.128 0.026 Downpour 0.382 0.174 0.714 0.149 Wind Northwest 0.478 0.263 0.078 0.017 Sunny 0.643 0.405 0.084 0.020 Moderate rainy 0.680 0.437 0.087 0.020
  • 24.
    Inflection Predictor (IP) 4.Train an inflection predictor with 𝐷𝑡  The features used in the inflection predictor to determine the specific drop values are the same as those of the temporal predictor  The inflection predictor is based on a RT  The output of the inflection predictor is a delta of AQI to be appended to the final result 24
  • 25.
  • 26.
  • 27.
    Results Time 1-6h 7-12h13-24h 25-48h Sudden Changes Cities 𝒑 𝒆 𝒑 𝒆 𝒑 𝒆 𝒑 𝒆 𝒑 𝒆 Beijing 0.750 30 0.62 64 0.53 78.3 0.496 81.1 0.300 78.3 Tianjin 0.746 31 0.634 62.1 0.595 67.4 0.579 68.6 0.437 70.9 Guangzhou 0.805 13 0.748 23.9 0.714 26.8 0.681 29.5 0.477 54.6 Shenzhen 0.838 8.4 0.764 17.6 0.728 20 0.689 22.8 0.575 45.3 𝑝 = 1 − 𝑖 | 𝑦𝑖 − 𝑦𝑖| 𝑖 𝑦𝑖 𝑒 = 𝑖 | 𝑦 𝑖−𝑦 𝑖| 𝑛 .
  • 28.
  • 29.
  • 30.
  • 31.
    Conclusion  Report ona real-time air quality forecasting system that uses data-driven models to predict fine-grained air quality over the following 48 hours  It can achieve an accuracy of 0.75 for the first 6 hours and 0.6 for the next 7-12 hours in Beijing  It predicts the sudden changes of air quality much better than baseline methods 31
  • 32.

Editor's Notes

  • #24 WinSpeed:13.9-max or Humidity:1-40 or Downpour