Download to read offline
![International Research Journal of Engineering and Technology (IRJET) e-ISSN: 2395-0056
Volume: 06 Issue: 12 | Dec 2019 www.irjet.net p-ISSN: 2395-0072
© 2019, IRJET | Impact Factor value: 7.34 | ISO 9001:2008 Certified Journal | Page 993
Trend: The optional and often linear increasing or
decreasing behavior of the series over time.
Seasonality: The optional repeating patterns or
cycles of behavior over time.
Noise: The optional variability in the observations
that cannot be explained by the model.
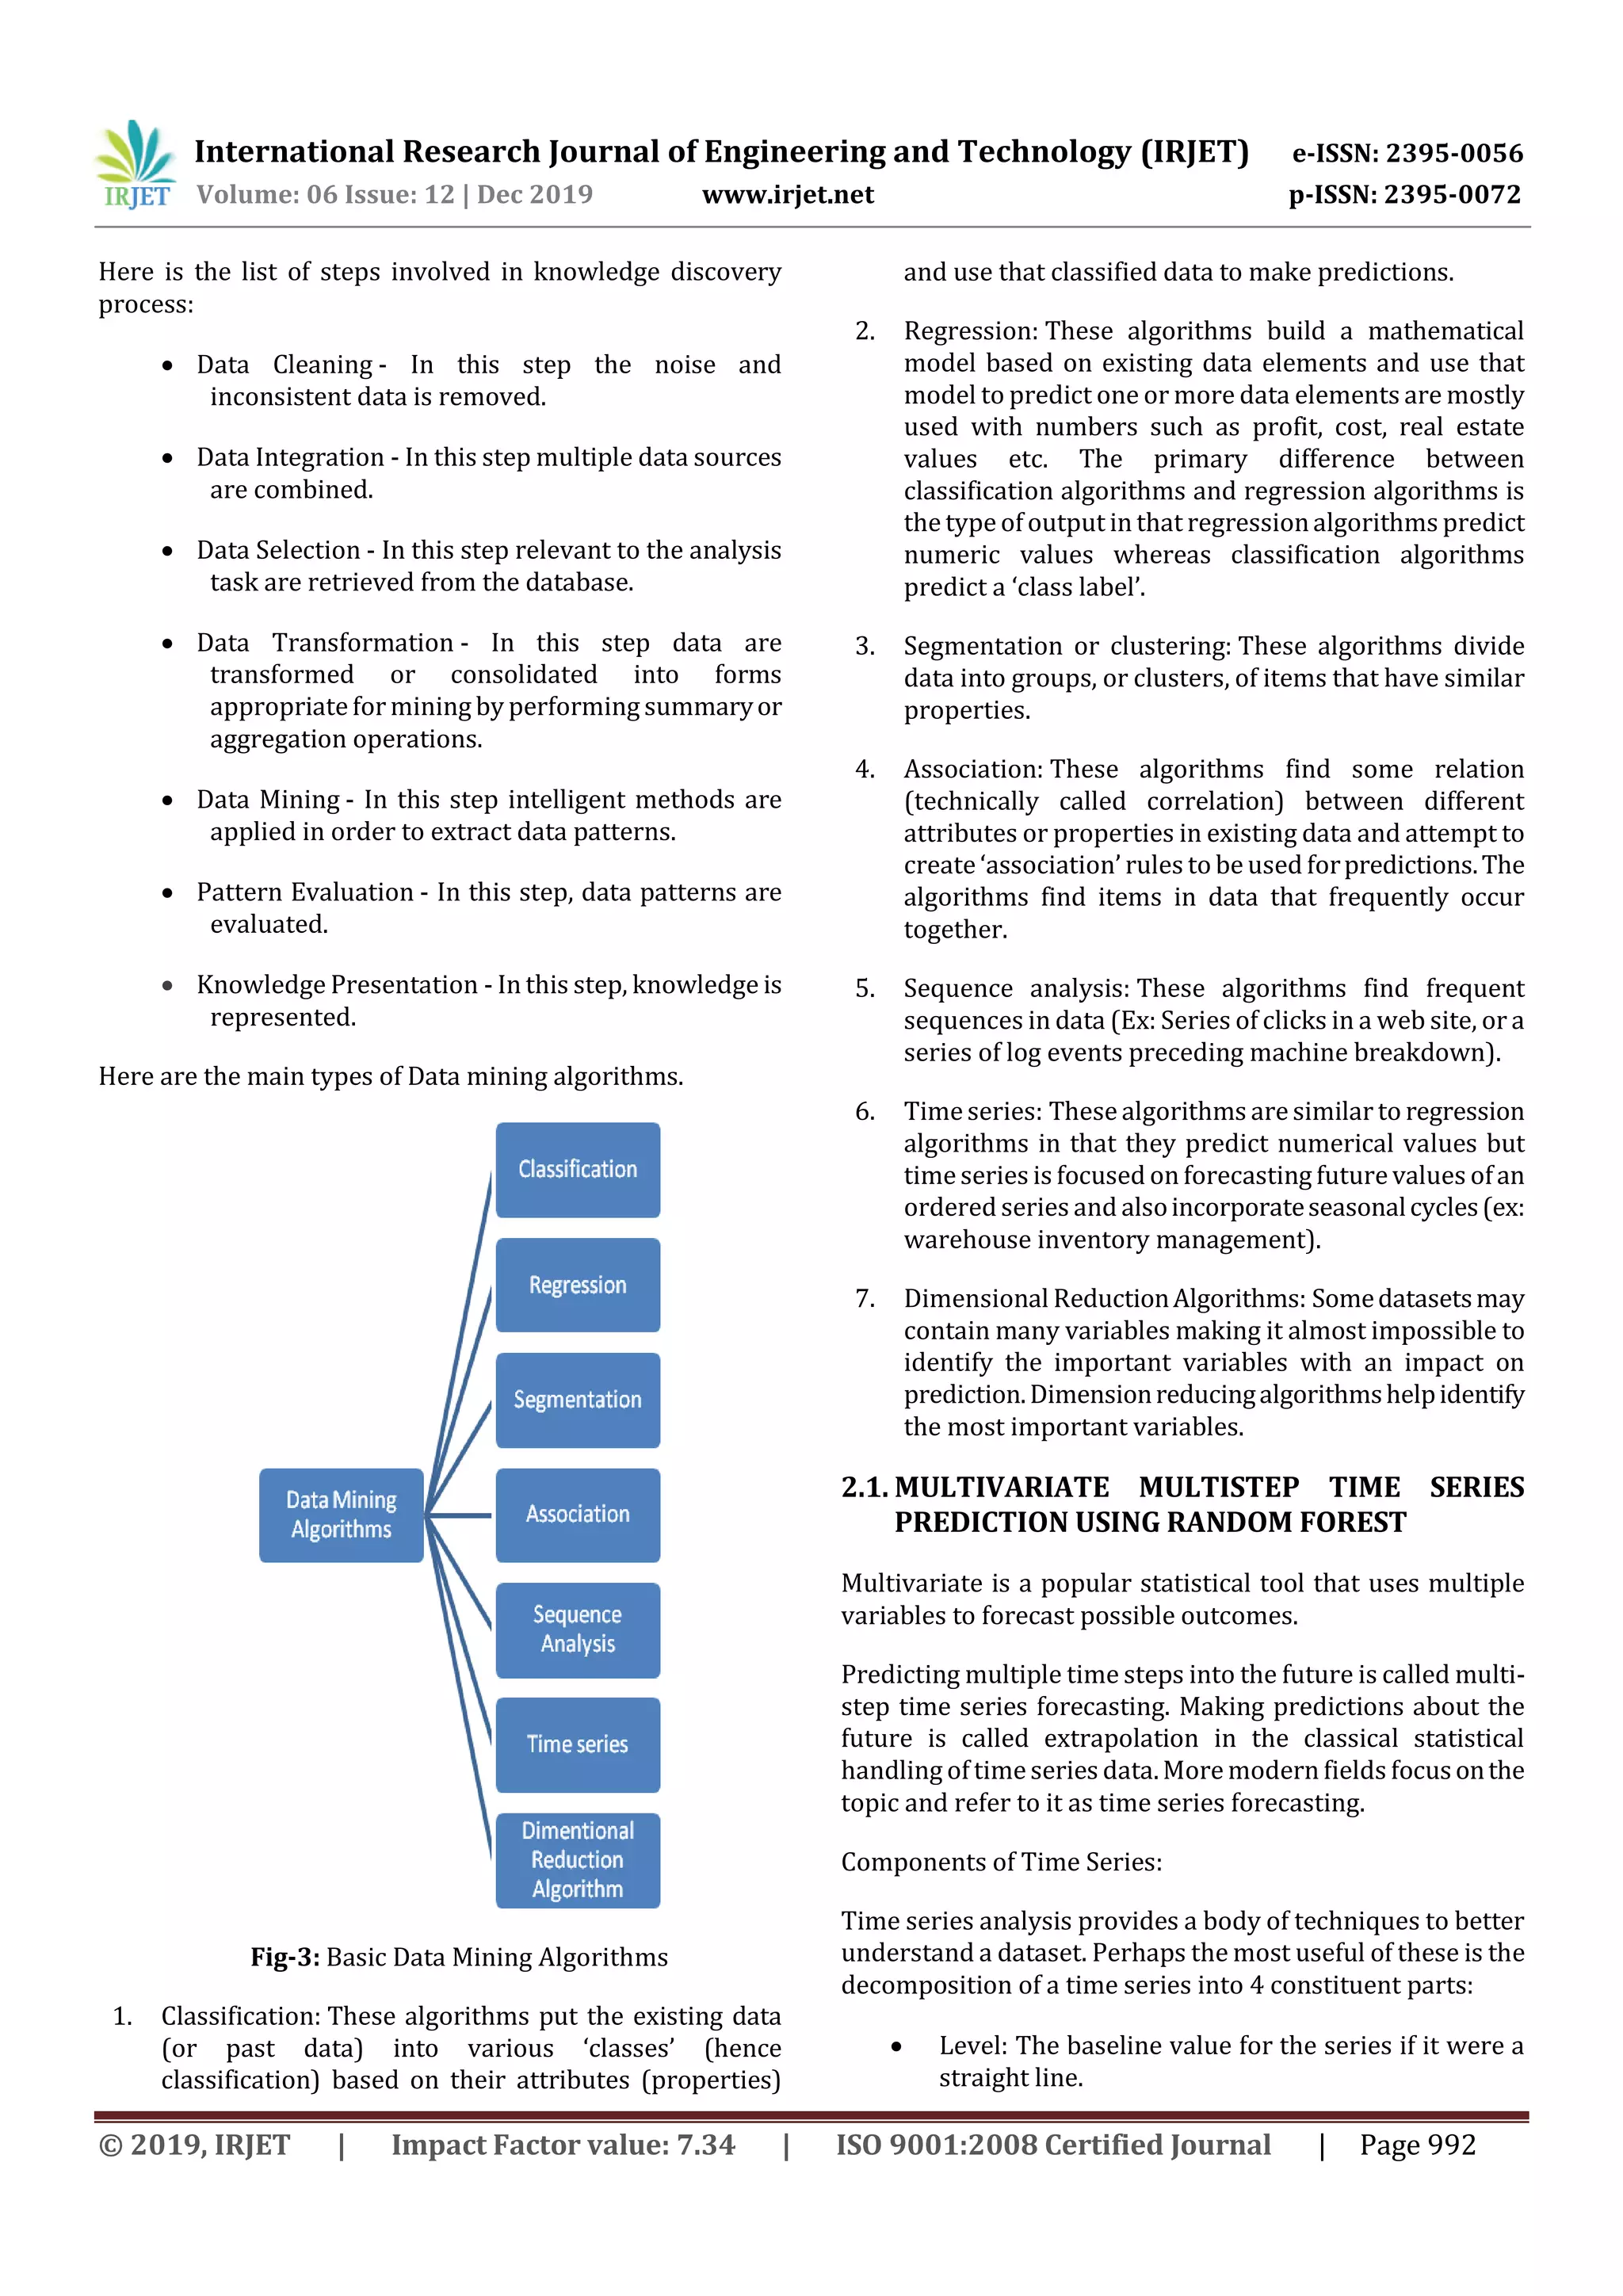
Random forest algorithm is a supervised classification
algorithm. As the name suggest, this algorithm creates the
forest with a number of trees. In general, the more trees in
the forest the more robust the forest looks like. In the same
way in the random forest classifier,the higherthe number of
trees in the forest gives the high accuracy results.Sohere we
are going to use all this technique to make prediction of air
pollution in smart cities.
3. RELATEDWORK
In this section, we discuss the different papers related to
air pollution prediction technique. We take all the recent
years papers.
Shweta Taneja, Dr. Nidhi Sharma, Kettun Oberoi, Yash
Navoria, proposed paper of Predicting Trends in Air
Pollution in Delhi using Data Mining.InthisPaper,Theyhave
used time series analysis method for analyzing the pollution
trends in Delhi and predicting about the future. The time
series method includes Multilayer Perceptron and Linear
Regression[1].
In Elseviere(2018) paper, Forecasting air pollution load in
Delhi using data analysis tools. In this paper, A systematic
approach has been followed in this analysis. The approach
starts with the collection of dataset from CPCB. Collected
data has been pre processed to remove the redundancy. Pre
processing of data includes steps like parsing of dates, noise
removal, cleaning, training and scaling. Further, descriptive
analysis has been carried out on two different platforms-
Rstudio and Tableau for different stations.Forobservingthe
forecasted results, predictive analysis has been done[2].
KRZYSZTOFSIWEK,STANISŁAWOSOWSKI,Proposed paper
for Data Mining methods for Prediction of Air Pollution. The
paper will discuss the numerical aspects of the air pollution
prediction problem, concentrating on the methods of data
mining used for building the most accurate model of
prediction. In this paper feature selection is done by using
the genetic algorithm (GA). The application of several
predictors and feature selection methods allowed
integrating their results into one final forecast. The best
results of integration were obtained in the directapplication
of selected features to the RF, performing at the same time
the role of regression and integration[3].
In Springer (2019) Paper, Prediction of Air Quality Using
Time Series Data Mining. Many of the modern databases are
temporal, which makes the task of studying and developing
time series data mining techniques an important and much
needed task. Time series data mining identifies time-
dependent features from time series databases. These
features are used for building predictive models. This paper
proposes an efficient algorithm to predict the concentration
of the various air pollutants by using time series datamining
techniques. The time series datamining algorithm CTSPD or
Continuous Target Sequence Pattern Discovery has been
used for the prediction of air pollutants. The predictions
made by the proposed solution are compared with the
predictions made by SAFAR-India and found that the
proposed solution provides more accurate results. By
studying the obtained air quality patterns, it was found that
the concentration of a pollutant need not depend on all the
other pollutants[4].
In Springer (2018) Paper, Air Pollution Prediction Using
Extreme Learning Machine: A Case Study on Delhi. In this
work multi-variable linear regression model of ELM is used
to predict air quality index for PM10, PM2.5, NO2, CO, O3. In
the proposed model, the previous day air quality index of
pollutants and meteorological conditions are used for
prediction. Performance of the proposed model was
compared with the prediction of an existing prediction
system, SAFAR as well as with the actual values of next day.
ELM-based prediction was found to have greater accuracy
than the existing[5].
Khaled Bashir Shaban, SeniorMember,IEEE,AbdullahKadri,
Member, IEEE, and Eman Rezk Proposed Paper of Urban Air
Pollution Monitoring System With Forecasting Models. In
this paper air quality data are collected wirelessly from
monitoring motes that are equipped with an array of
gaseous and meteorological sensors. Thesedata areanalyzed
and used in forecasting concentration values of pollutants
using intelligent machine to machine platform.Theplatform
uses ML-based algorithms to buildtheforecastingmodelsby
learning from the collected data. These models predict 1, 8,
12,nd 24 hours ahead of concentration values. Based on
extensive experiments, M5P outperforms other algorithms
for all gases in all horizons in terms of NRMSE and PTA
because of the tree structure efficiency and powerful
generalization ability. On the other hand, ANN achieved the
worst results because of its poor generalizationabilitywhen
working on small dataset with many attributes that leads to
a complex network that overfit the data, while having SVM
better than ANN in our case due to its adaptability with high
dimensional data[6].
Table -1: Comparison Table
PUBLICATI
ON
TITLE METHOD LIMITATION
IEEE, Predicting
Trends in
Linear
regression,
Linear
regression](https://image.slidesharecdn.com/irjet-v6i12159-200107063640/75/IRJET-Air-Pollution-Prediction-System-for-Smart-City-using-Data-Mining-Technique-A-Survey-4-2048.jpg)
![International Research Journal of Engineering and Technology (IRJET) e-ISSN: 2395-0056
Volume: 06 Issue: 12 | Dec 2019 www.irjet.net p-ISSN: 2395-0072
© 2019, IRJET | Impact Factor value: 7.34 | ISO 9001:2008 Certified Journal | Page 995
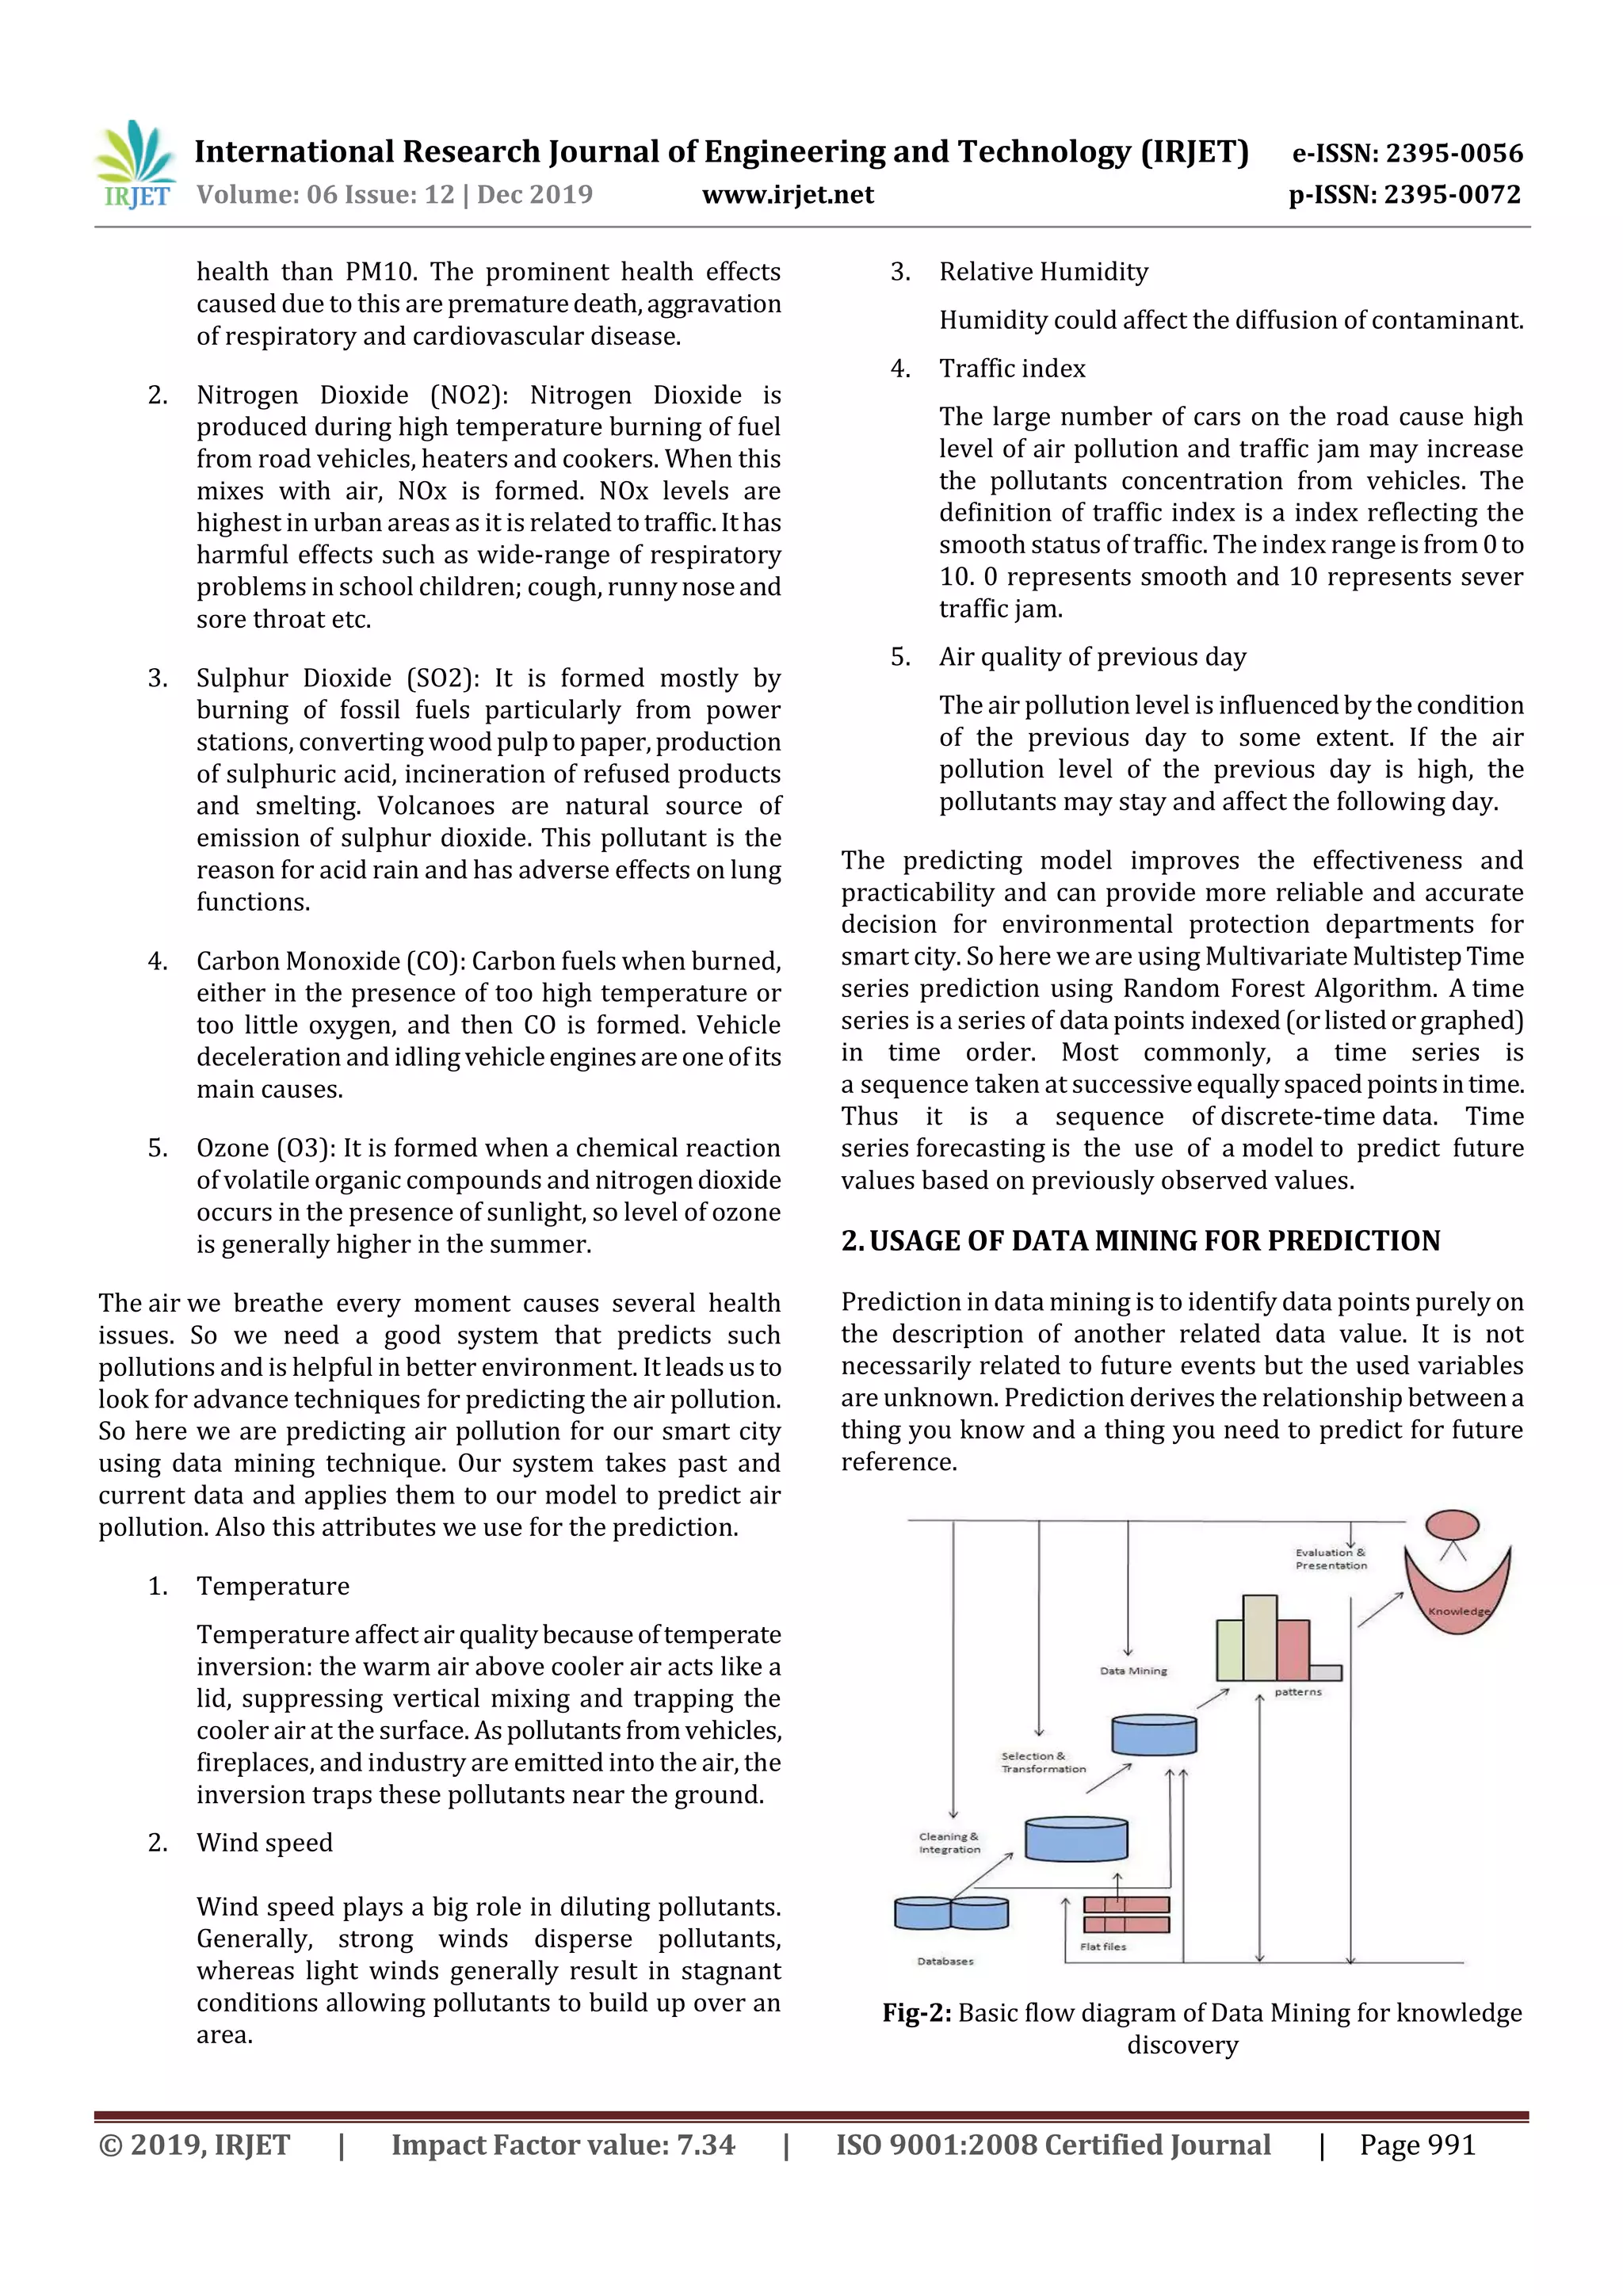
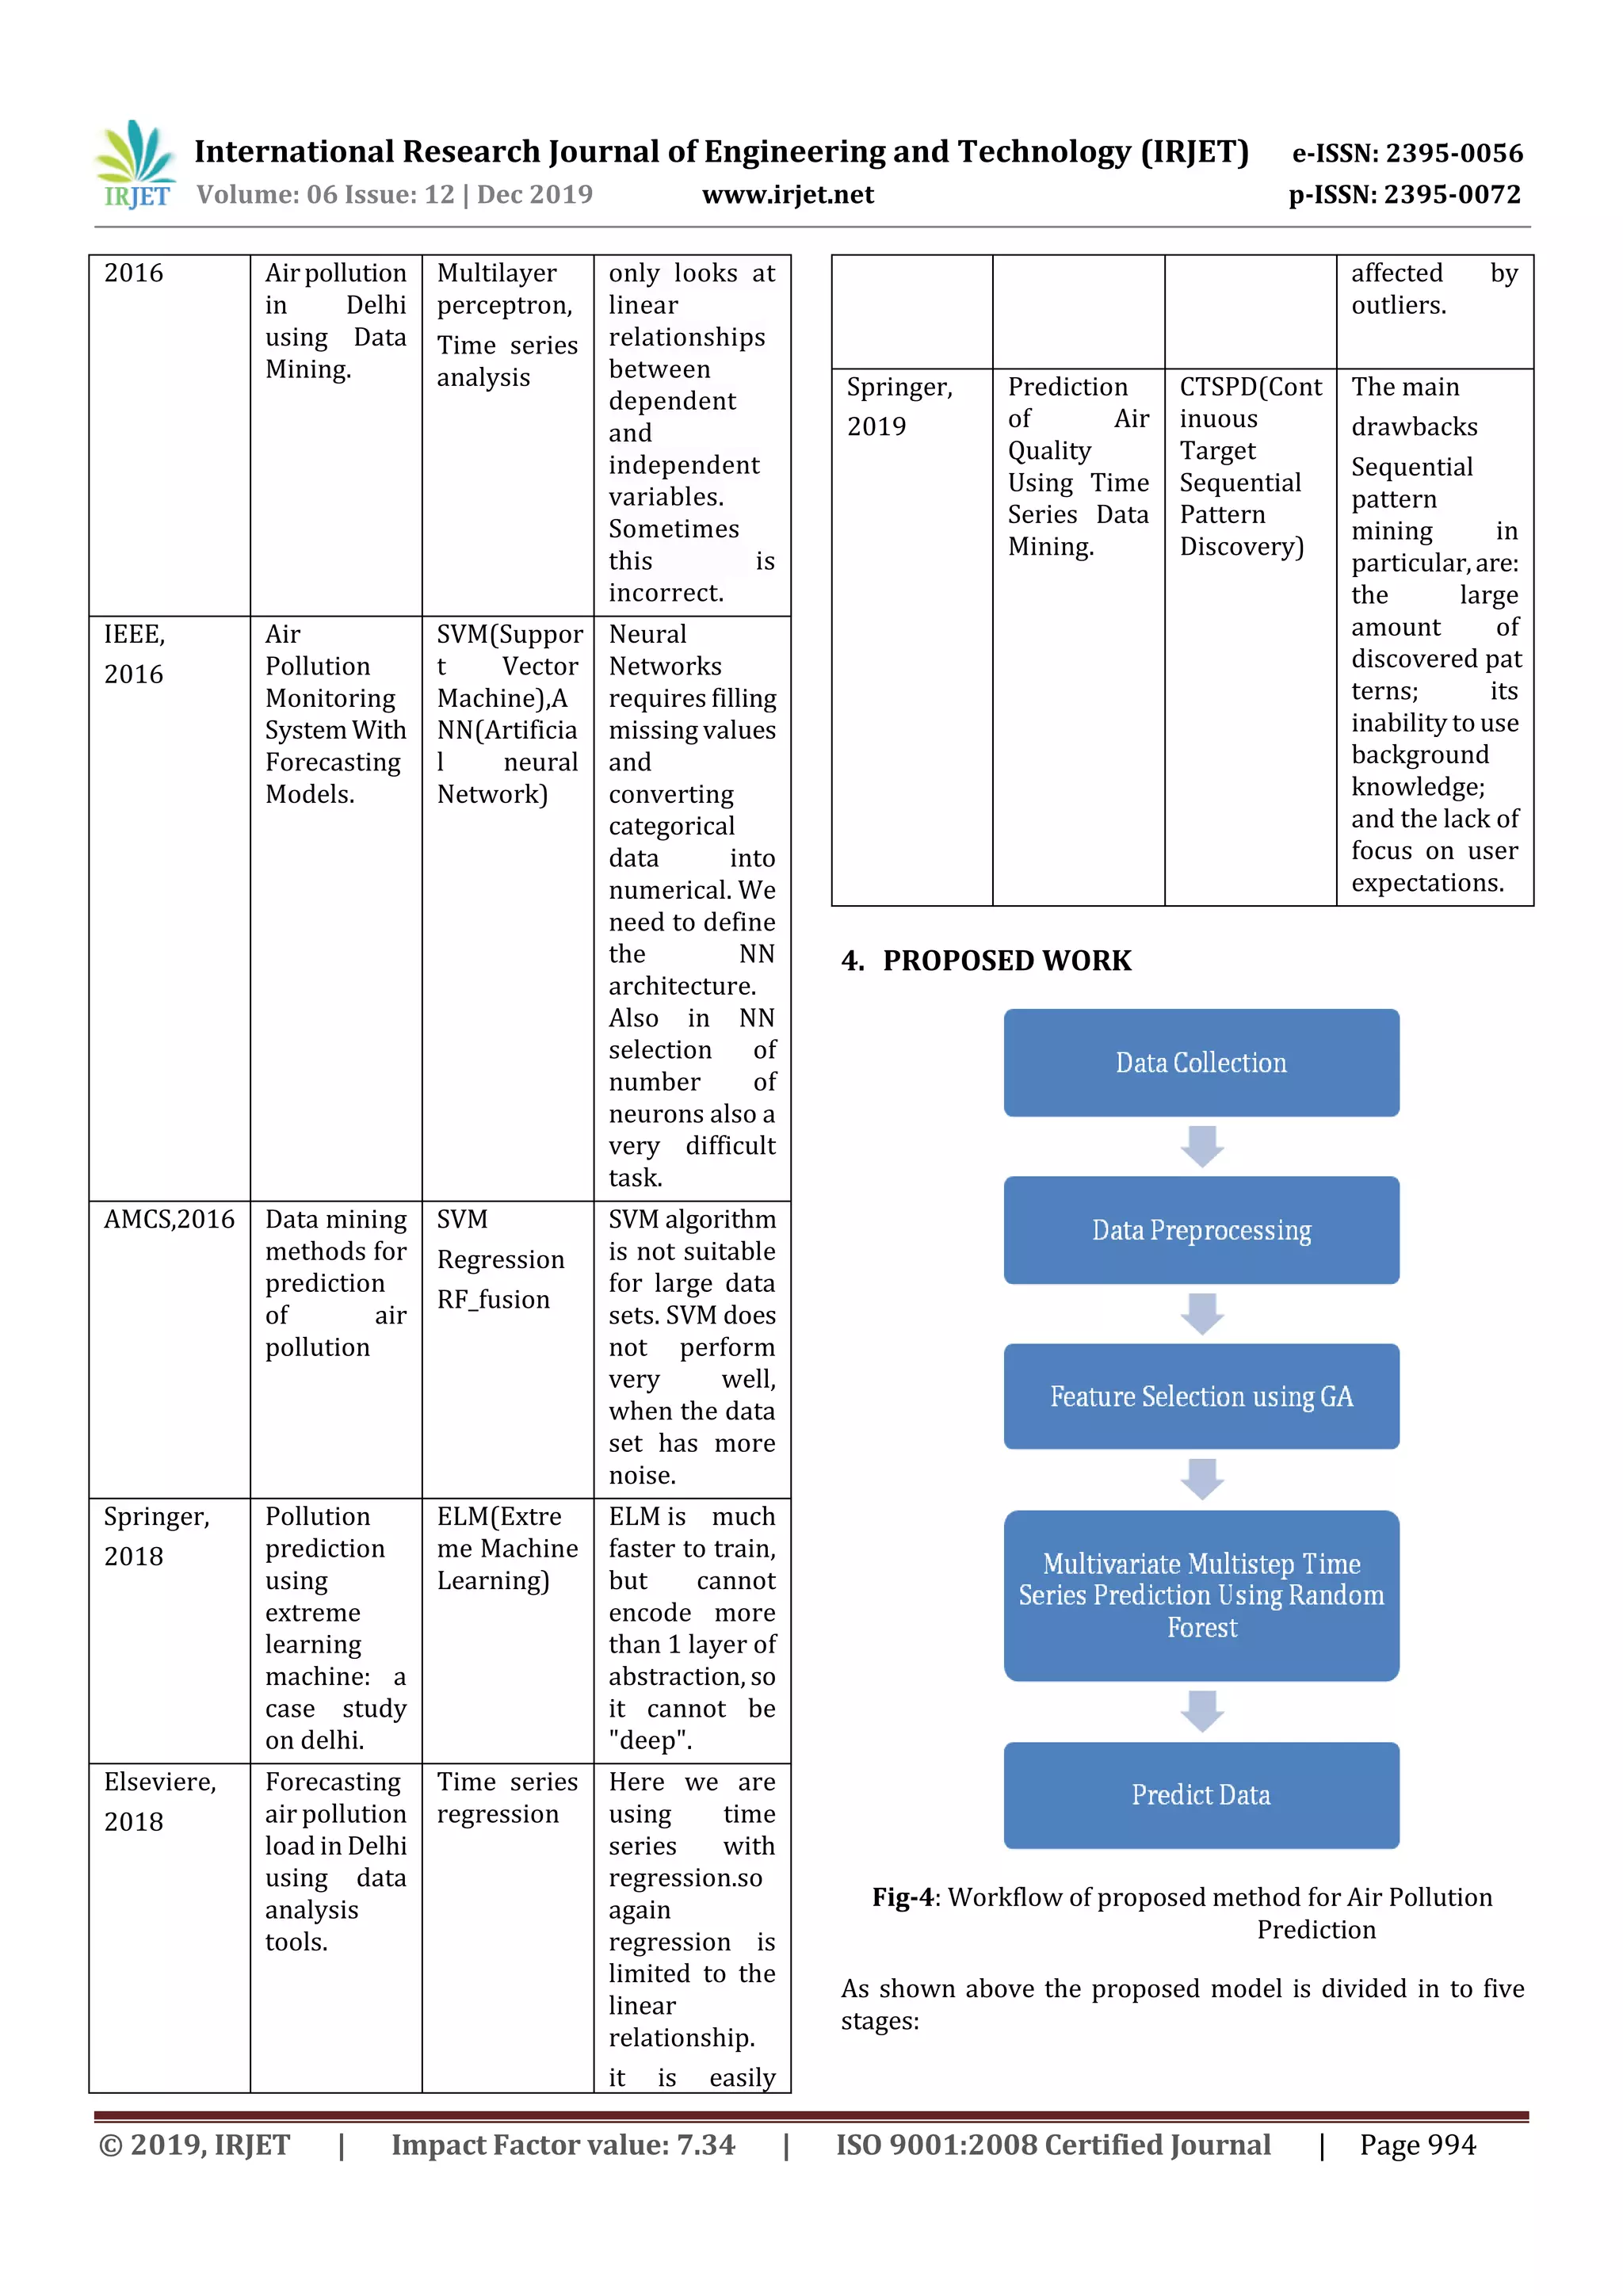
Stage 1 Data Collection: Here we are collecting all the data of
attribute which are affect the air pollution. There are many
sensors available in smart cities which sense the pollutants.
Stage 2 Data Preprocessing: data are cleaned by removing
noise and filling up the missing values.
Stage 3 Feature Selection using GA: Feature selection is the
process of finding the most relevant inputs for predictive
model. These technique can be used to identify and
remove unneeded, irrelevant and redundant features that
do not contribute or decrease the accuracy of the
predictive model.
Stage 4 Multivariate Multistep Time Series PredictionUsing
Random Forest: In this stage we are taking multivariate
multistep time series data and using random forest
algorithm we are predicting the air pollution. There are
multiple trees and each tree is trained on a subset of time
series data.
Stage 5 Prediction: Here our system predict the air
pollution.
5. CONCLUSION
The proposed system will definitely help in improving the
prediction of air pollution in our smart city. Multivariate
Multistep Time Series Prediction Using Random Forest
technique improve the the performance and reduce the
complexity of theairpollutionpredictionmodel.Alsoherewe
are using feature selection technique which make our
prediction even better.
REFERENCES
[1] Shweta Taneja, Dr. Nidhi Sharma, Kettun Oberoi, Yash
Navoria ,”Predicting Trends in Air Pollution in Delhi
using Data Mining”, IEEE(2016)
[2] NidhiSharmaa,ShwetaTanejab*,VaishaliSagarc,Arshita
Bhattd, “ForecastingairpollutionloadinDelhiusingdata
analysis tools.”, Elseviere (ICCIDS 2018)
[3] KRZYSZTOF SIWEK, STANISŁAW OSOWSKI,” Data
mining methods for prediction of Air Pollution”,
amcs(2016)
[4] Mansi Yadav, Suruchi Jain and K. R. Seeja,” Prediction of
Air Quality Using Time Series Data Mining”, Springer
(2019)
[5] Manisha Bisht and K.R. Seeja,” Air Pollution Prediction
Using Extreme Learning Machine: A Case Study on
Delhi.”, Springer(2018)
[6] Khaled Bashir Shaban, Senior Member, IEEE, Abdullah
Kadri, Member, IEEE, and Eman Rezk,” Air Pollution
Monitoring System With Forecasting Models.”,
IEEE(2016)
[7] Khaled Bashir Shaban, Abdullah Kadri, Eman Rezk,
”Urban Air Pollution Monitoring System With
Forecasting Models”,IEEE SENSORS JOURNAL, VOL. 16,
NO. 8, APRIL 15, 2016
[8] Forecasting Criteria Air Pollutants Using Data Driven
Approaches; An Indian Case Study Tikhe Shruti, Dr. Mrs.
Khare , Dr. Londhe ,IOSR-JESTFT (Mar. - Apr. 2013)
[9] Forecasting Criteria Air Pollutants Using Data Driven
Approaches; An Indian Case Study Tikhe Shruti, Dr. Mrs.
Khare , Dr. Londhe,IOSR-JESTFT (Mar. - Apr. 2013)
[10] Air Quality Forecasting Methods,
https://www.airvisual.com/air-pollution-
information/research/air-quality-forecast-methods
[11] Multivariate Multistep Time series Forecasting model
for Air Pollution.
https://machinelearningmastery.com/how-to-develop-
machine-learning-models-for-multivariate-multi-step-
air-pollution-time-series-forecasting/K. Elissa, “Title of
paper if known,” unpublished.
[12] Yi-Ting Tsai, Yu-Ren,Zeng, Yue-Shan Chang, “Air
pollution forecastingusingRNNwithLSTM”,IEEE(2018)
[13] Min Huang, TaoZhang, Jingyang Wang and LikunZhu,”A
New Air Quality Forecasting Model Using Data
Mining and Artificial Neural Network”, IEEE,(2015)
[14] Gaganjot Kaur Kang, Jerry Zeyu Gao, Sen Chiao,
hengqiang Lu, and Gang Xie,” Air Quality Prediction: Big
Data and Machine Learning Approaches” , International
Journal of Environmental Science and Development,Vol.
9, No. 1, January 2018
[15] Ebrahim Sahafizadeh, Esmail Ahmadi,” Prediction of Air
Pollution of Boushehr City Using Data Mining”, 2009
Second International Conference on Environmental and
Computer Science.](https://image.slidesharecdn.com/irjet-v6i12159-200107063640/75/IRJET-Air-Pollution-Prediction-System-for-Smart-City-using-Data-Mining-Technique-A-Survey-6-2048.jpg)

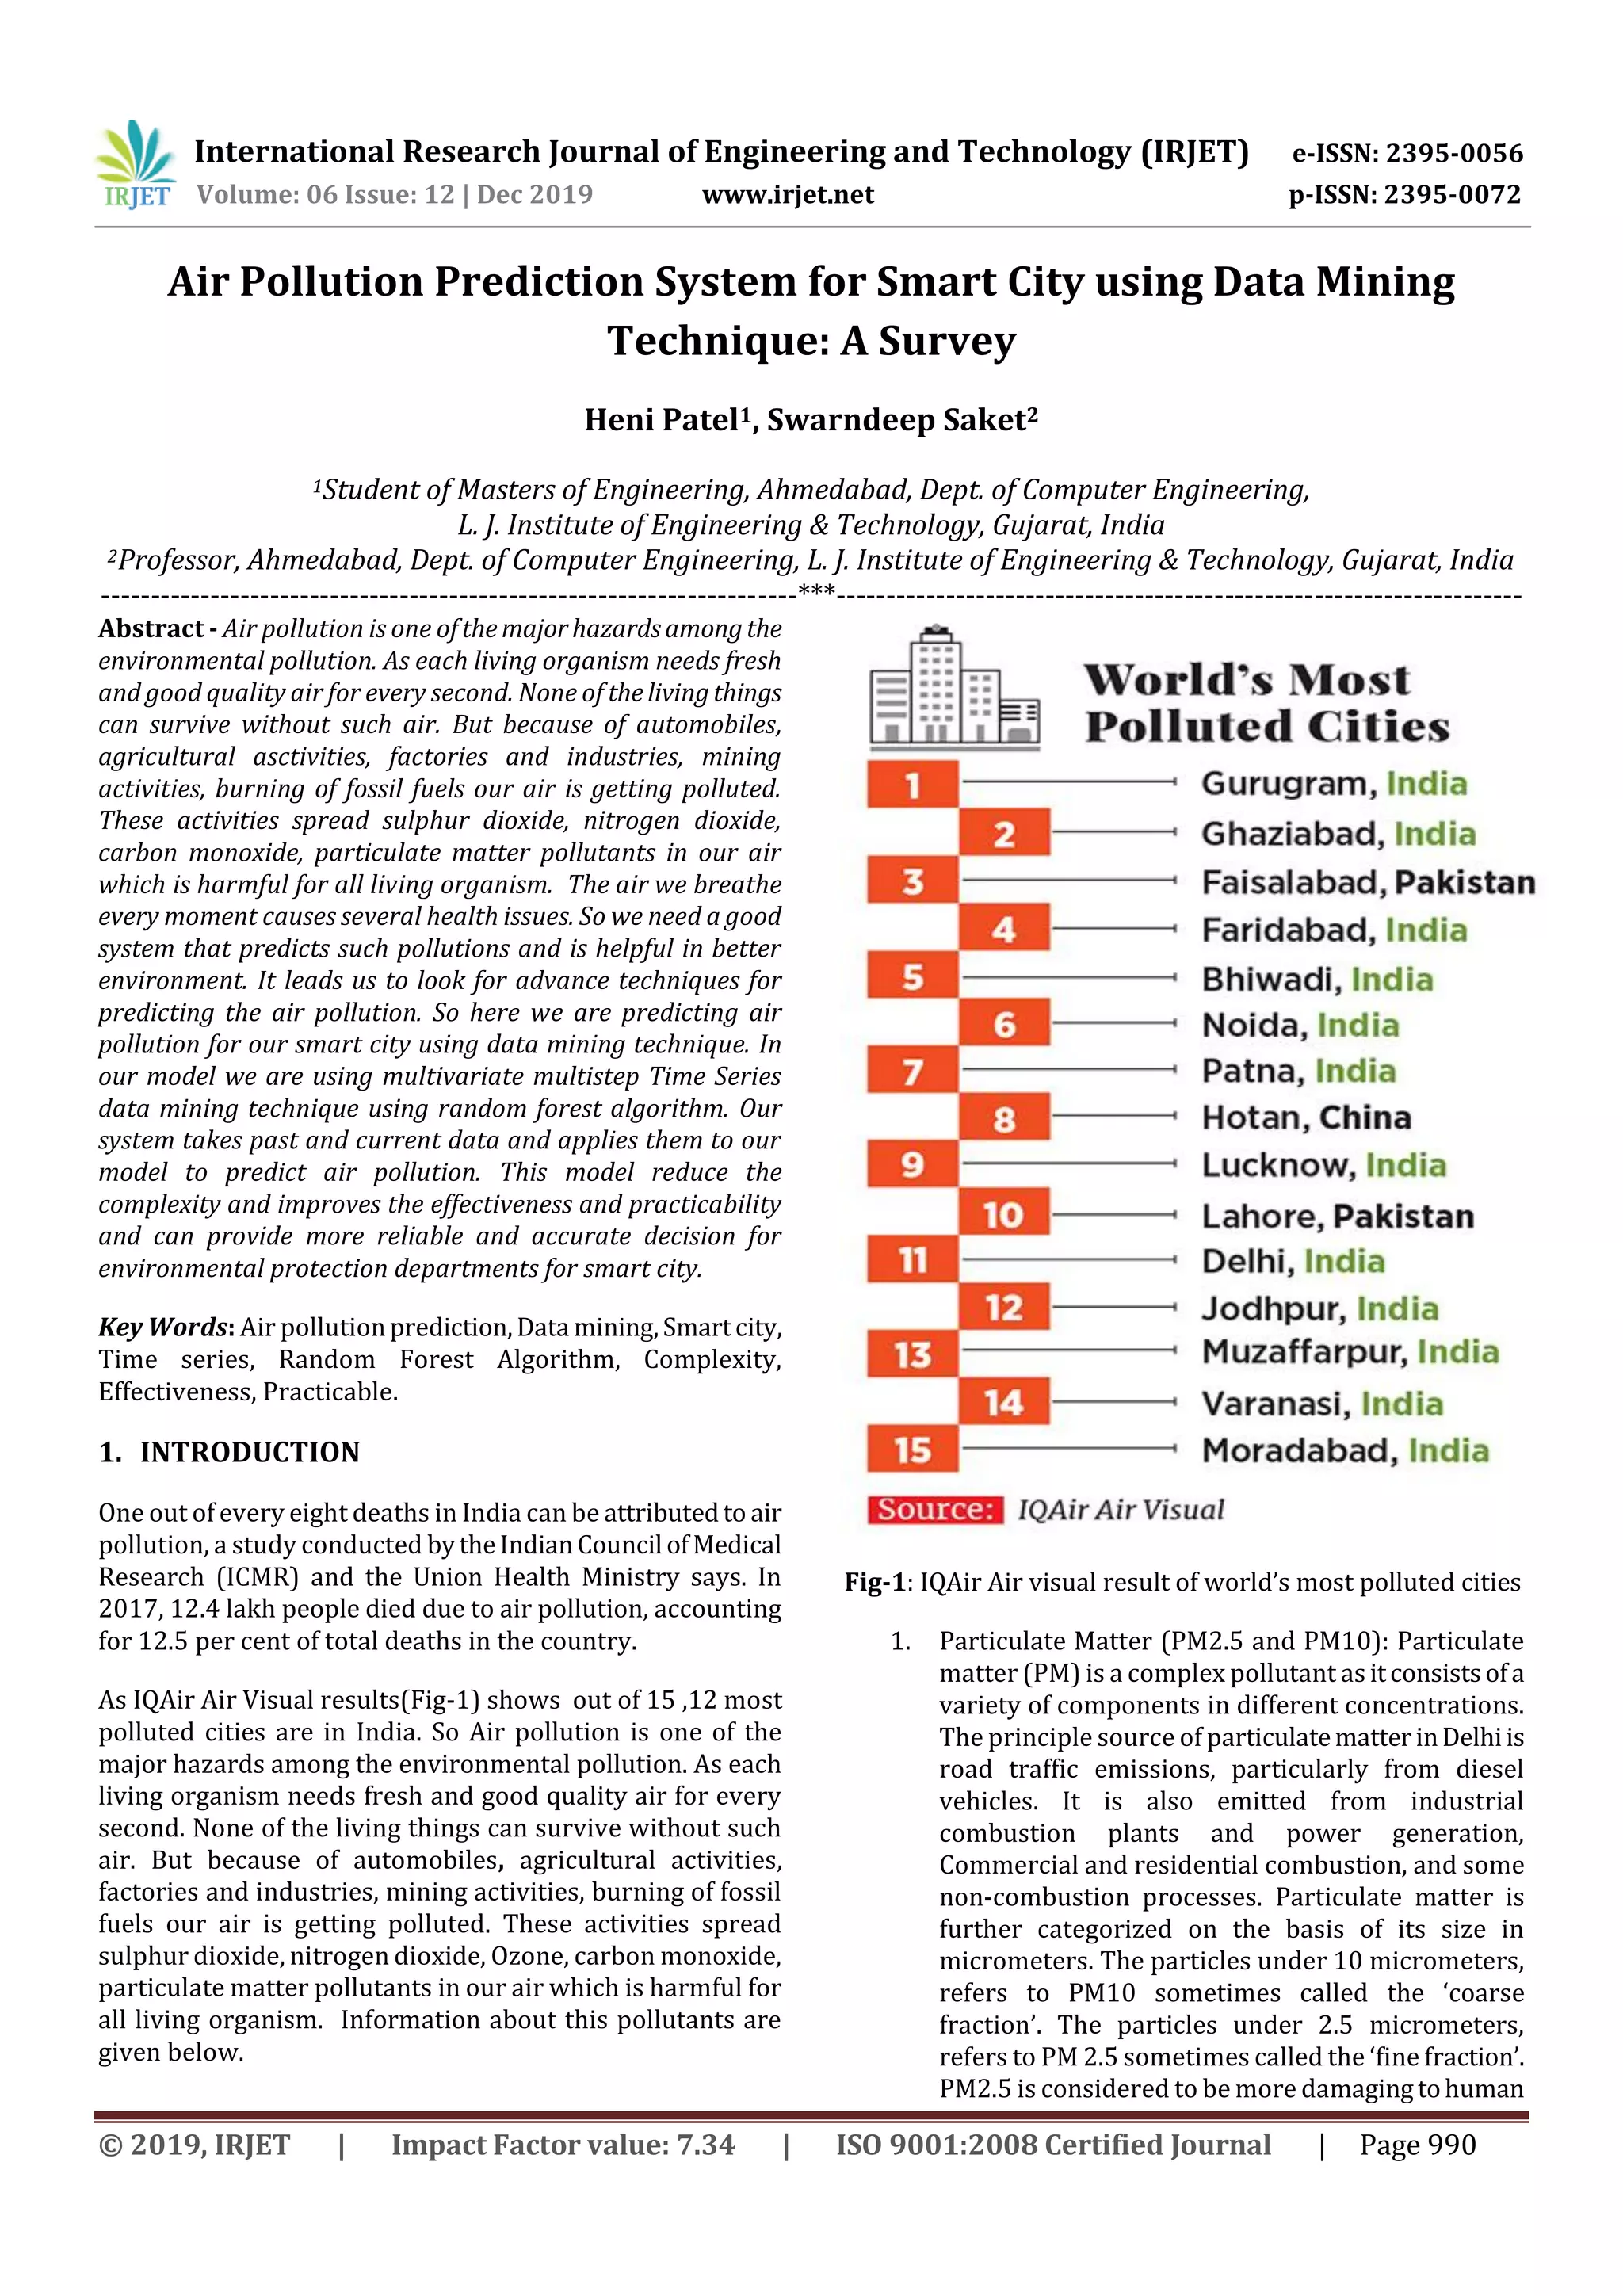
This document discusses using data mining techniques to predict air pollution levels in a smart city. It begins with background on the health impacts of various air pollutants like particulate matter, nitrogen dioxide, sulfur dioxide, and carbon monoxide. It then describes using a multivariate, multistep time series approach with a random forest algorithm to predict future air pollution levels based on past and current pollution data as well as other attributes like temperature, wind speed, humidity, traffic levels, and the previous day's air quality. Finally, it reviews several related works that used techniques like neural networks, linear regression, extreme learning learning, and decision trees to predict pollution trends in other cities and compares their limitations and accuracies.