SlideShare a Scribd company logo
BOHR International Journal of Internet of things,
Artificial Intelligence and Machine Learning
2023, Vol. 2, No. 1, pp. 65–69
DOI: 10.54646/bijiam.2023.18
www.bohrpub.com
RESEARCH
Air quality forecasting using convolutional neural networks
G. R. Ashika* and M. Germin Nisha
Department of Electrical and Electronics Engineering, St. Xavier’s Catholic College of Engineering, Chunkankadai, Nagercoil,
India
*Correspondence:
G. R. Ashika,
ashikagr1999@gmail.com
Received: 22 June 2023; Accepted: 12 August 2023; Published: 26 September 2023
Air pollution is now one of the biggest environmental risks, which causes more than 6 million premature deaths
each year from heart diseases, stroke, diabetes, respiratory disease, and so on. Protecting humans from the
damage which is caused by air pollution is one of the major issues for the global community. The prediction of
air pollution can be done by machine learning (ML) algorithms. ML combines statistics and computer science to
maximize the prediction power. ML can be also used to predict the air quality index (AQI). The aim of this research
is to develop a convolutional neural network (CNN) model to predict air quality from the unseen data set, which
includes concentration of nitrogen dioxide (NO2), carbon monoxide (CO), and sulfur dioxide (SO2). The proposed
system will be implemented in two steps; the first step will focus on data analysis and pre-processing, including
filtering, feature extraction, constructing convolutional neural network layers, and optimizing the parameters of
each layer, while the second step is used to evaluate its model accuracy. The output is predicted as AQI for the
developed CNN model. The developed CNN model achieves a root-mean-square error of 13.4150 and a high
accuracy of 86.585%. The overall model is implemented using MATLAB software.
Keywords: air quality prediction, air pollution, deep learning algorithm, convolutional neural network, air quality
index
1. Introduction
Artificial intelligence (AI) is a powerful tool that is used
for measuring and solving people’s problems. AI technology
allows machines to mimic human behavior. The different
neural network architectures like deep neural network
(DNN), recurrent neural network (RNN), and convolutional
neural network (CNN) and machine learning algorithms
ensure that future air quality indexes (AQIs) can be
predicted. Supervised learning, unsupervised learning, and
reinforcement learning are the learning algorithms used in
machine learning (ML) of AI (1).
Air pollution refers to indoor or outdoor air pollution.
When pollutants enter the environment, the air becomes
polluted, making plants, animals, and humans unable to
live. One of the leading causes of death is air pollution (2).
Air pollution killed 6.6 million people in 2020. Therefore,
we need a reliable forecasting system. Sulfur dioxide (SO2),
carbon monoxide (CO), particulate matter (PM), nitrogen
oxide (NO), and other pollutants are the most harmful air
pollutants. AQI is a standard used to measure the air quality.
This article focuses on an important aspect of deep
learning such as CNN that is used to predict quality of
air. The aim of this research is to develop a CNN model
to predict air quality from invisible data, including the
concentration of pollutants.
2. Air quality prediction model
The proposed air quality prediction (AQP) model is
mainly based on CNN.
2.1. Deep learning algorithm
Deep learning uses ANNs to perform the complex
calculations on large datasets. It is based on the structure
65
66 Ashika and Nisha
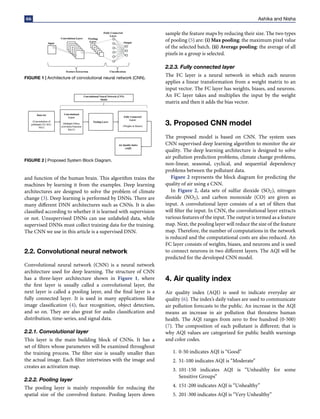
FIGURE 1 | Architecture of convolutional neural network (CNN).
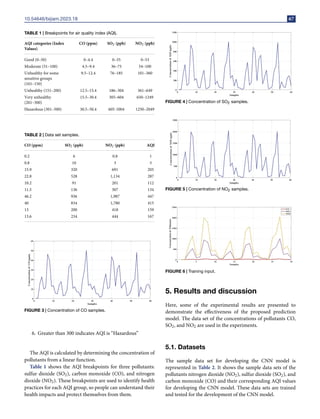
FIGURE 2 | Proposed System Block Diagram.
and function of the human brain. This algorithm trains the
machines by learning it from the examples. Deep learning
architectures are designed to solve the problem of climate
change (3). Deep learning is performed by DNNs. There are
many different DNN architectures such as CNNs. It is also
classified according to whether it is learned with supervision
or not. Unsupervised DNNs can use unlabeled data, while
supervised DNNs must collect training data for the training.
The CNN we use in this article is a supervised DNN.
2.2. Convolutional neural network
Convolutional neural network (CNN) is a neural network
architecture used for deep learning. The structure of CNN
has a three-layer architecture shown in Figure 1, where
the first layer is usually called a convolutional layer, the
next layer is called a pooling layer, and the final layer is a
fully connected layer. It is used in many applications like
image classification (4), face recognition, object detection,
and so on. They are also great for audio classification and
distribution, time-series, and signal data.
2.2.1. Convolutional layer
This layer is the main building block of CNNs. It has a
set of filters whose parameters will be examined throughout
the training process. The filter size is usually smaller than
the actual image. Each filter intertwines with the image and
creates an activation map.
2.2.2. Pooling layer
The pooling layer is mainly responsible for reducing the
spatial size of the convolved feature. Pooling layers down
sample the feature maps by reducing their size. The two types
of pooling (5) are: (i) Max pooling: the maximum pixel value
of the selected batch. (ii) Average pooling: the average of all
pixels in a group is selected.
2.2.3. Fully connected layer
The FC layer is a neural network in which each neuron
applies a linear transformation from a weight matrix to an
input vector. The FC layer has weights, biases, and neurons.
An FC layer takes and multiplies the input by the weight
matrix and then it adds the bias vector.
3. Proposed CNN model
The proposed model is based on CNN. The system uses
CNN supervised deep learning algorithm to monitor the air
quality. The deep learning architecture is designed to solve
air pollution prediction problems, climate change problems,
non-linear, seasonal, cyclical, and sequential dependency
problems between the pollutant data.
Figure 2 represents the block diagram for predicting the
quality of air using a CNN.
In Figure 2, data sets of sulfur dioxide (SO2), nitrogen
dioxide (NO2), and carbon monoxide (CO) are given as
input. A convolutional layer consists of a set of filters that
will filter the input. In CNN, the convolutional layer extracts
various features of the input. The output is termed as a feature
map. Next, the pooling layer will reduce the size of the feature
map. Therefore, the number of computations in the network
is reduced and the computational costs are also reduced. An
FC layer consists of weights, biases, and neurons and is used
to connect neurons in two different layers. The AQI will be
predicted for the developed CNN model.
4. Air quality index
Air quality index (AQI) is used to indicate everyday air
quality (6). The index’s daily values are used to communicate
air pollution forecasts to the public. An increase in the AQI
means an increase in air pollution that threatens human
health. The AQI ranges from zero to five hundred (0-500)
(7). The composition of each pollutant is different; that is
why AQI values are categorized for public health warnings
and color codes.
1. 0-50 indicates AQI is “Good”
2. 51-100 indicates AQI is “Moderate”
3. 101-150 indicates AQI is “Unhealthy for some
Sensitive Groups”
4. 151-200 indicates AQI is “Unhealthy”
5. 201-300 indicates AQI is “Very Unhealthy”
10.54646/bijiam.2023.18 67
TABLE 1 | Breakpoints for air quality index (AQI).
AQI categories (Index
Values)
CO (ppm) SO2 (ppb) NO2 (ppb)
Good (0–50) 0–4.4 0–35 0–53
Moderate (51–100) 4.5–9.4 36–75 54–100
Unhealthy for some
sensitive groups
(101–150)
9.5–12.4 76–185 101–360
Unhealthy (151–200) 12.5–15.4 186–304 361–649
Very unhealthy
(201–300)
15.5–30.4 305–604 650–1249
Hazardous (301–500) 30.5–50.4 605-1004 1250–2049
TABLE 2 | Data set samples.
CO (ppm) SO2 (ppb) NO2 (ppb) AQI
0.2 6 0.8 1
0.8 10 3 5
15.9 320 691 205
22.8 528 1,134 287
10.2 91 201 112
11.5 136 307 134
46.2 936 1,987 447
40 834 1,780 415
13 200 418 159
13.6 234 444 167
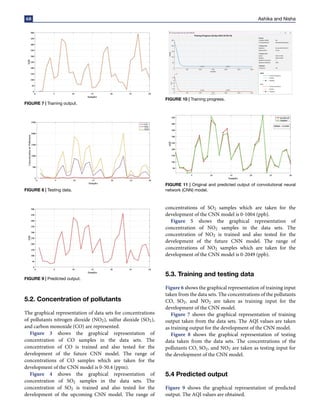
FIGURE 3 | Concentration of CO samples.
6. Greater than 300 indicates AQI is “Hazardous”
The AQI is calculated by determining the concentration of
pollutants from a linear function.
Table 1 shows the AQI breakpoints for three pollutants:
sulfur dioxide (SO2), carbon monoxide (CO), and nitrogen
dioxide (NO2). These breakpoints are used to identify health
practices for each AQI group, so people can understand their
health impacts and protect themselves from them.
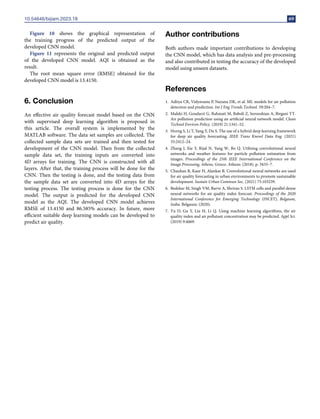
FIGURE 4 | Concentration of SO2 samples.
FIGURE 5 | Concentration of NO2 samples.
FIGURE 6 | Training input.
5. Results and discussion
Here, some of the experimental results are presented to
demonstrate the effectiveness of the proposed prediction
model. The data set of the concentrations of pollutants CO,
SO2, and NO2 are used in the experiments.
5.1. Datasets
The sample data set for developing the CNN model is
represented in Table 2. It shows the sample data sets of the
pollutants nitrogen dioxide (NO2), sulfur dioxide (SO2), and
carbon monoxide (CO) and their corresponding AQI values
for developing the CNN model. These data sets are trained
and tested for the development of the CNN model.
68 Ashika and Nisha
FIGURE 7 | Training output.
FIGURE 8 | Testing data.
FIGURE 9 | Predicted output.
5.2. Concentration of pollutants
The graphical representation of data sets for concentrations
of pollutants nitrogen dioxide (NO2), sulfur dioxide (SO2),
and carbon monoxide (CO) are represented.
Figure 3 shows the graphical representation of
concentration of CO samples in the data sets. The
concentration of CO is trained and also tested for the
development of the future CNN model. The range of
concentrations of CO samples which are taken for the
development of the CNN model is 0-50.4 (ppm).
Figure 4 shows the graphical representation of
concentration of SO2 samples in the data sets. The
concentration of SO2 is trained and also tested for the
development of the upcoming CNN model. The range of
FIGURE 10 | Training progress.
FIGURE 11 | Original and predicted output of convolutional neural
network (CNN) model.
concentrations of SO2 samples which are taken for the
development of the CNN model is 0-1004 (ppb).
Figure 5 shows the graphical representation of
concentration of NO2 samples in the data sets. The
concentration of NO2 is trained and also tested for the
development of the future CNN model. The range of
concentrations of NO2 samples which are taken for the
development of the CNN model is 0-2049 (ppb).
5.3. Training and testing data
Figure 6 shows the graphical representation of training input
taken from the data sets. The concentrations of the pollutants
CO, SO2, and NO2 are taken as training input for the
development of the CNN model.
Figure 7 shows the graphical representation of training
output taken from the data sets. The AQI values are taken
as training output for the development of the CNN model.
Figure 8 shows the graphical representation of testing
data taken from the data sets. The concentrations of the
pollutants CO, SO2, and NO2 are taken as testing input for
the development of the CNN model.
5.4 Predicted output
Figure 9 shows the graphical representation of predicted
output. The AQI values are obtained.
10.54646/bijiam.2023.18 69
Figure 10 shows the graphical representation of
the training progress of the predicted output of the
developed CNN model.
Figure 11 represents the original and predicted output
of the developed CNN model. AQI is obtained as the
result.
The root mean square error (RMSE) obtained for the
developed CNN model is 13.4150.
6. Conclusion
An effective air quality forecast model based on the CNN
with supervised deep learning algorithm is proposed in
this article. The overall system is implemented by the
MATLAB software. The data set samples are collected. The
collected sample data sets are trained and then tested for
development of the CNN model. Then from the collected
sample data set, the training inputs are converted into
4D arrays for training. The CNN is constructed with all
layers. After that, the training process will be done for the
CNN. Then the testing is done, and the testing data from
the sample data set are converted into 4D arrays for the
testing process. The testing process is done for the CNN
model. The output is predicted for the developed CNN
model as the AQI. The developed CNN model achieves
RMSE of 13.4150 and 86.585% accuracy. In future, more
efficient suitable deep learning models can be developed to
predict air quality.
Author contributions
Both authors made important contributions to developing
the CNN model, which has data analysis and pre-processing
and also contributed in testing the accuracy of the developed
model using unseen datasets.
References
1. Aditya CR, Vidyavastu P, Nayana DK, et al. ML models for air pollution
detection and prediction. Int J Eng Trends Technol. 59:204–7.
2. Maleki H, Goudarzi G, Rahmati M, Baboli Z, Sorooshian A, Birgani YT.
Air pollution prediction using an artificial neural network model. Clean
Technol Environ Policy. (2019) 21:1341–52.
3. Horng S, Li T, Yang Y, Du S. The use of a hybrid deep learning framework
for deep air quality forecasting. IEEE Trans Knowl Data Eng. (2021)
33:2412–24.
4. Zhang J, Xie Y, Rijal N, Yang W, Bo Q. Utilising convolutional neural
networks and weather features for particle pollution estimation from
images. Proceedings of the 25th IEEE International Conference on the
Image Processing, Athens, Greece. Athens: (2018). p. 3433–7.
5. Chauhan R, Kaur H, Alankar B. Convolutional neural networks are used
for air quality forecasting in urban environments to promote sustainable
development. Sustain Urban Commun Soc. (2021) 75:103239.
6. Bedekar M, Singh VM, Barve A, Shrirao S. LSTM cells and parallel dense
neural networks for air quality index forecast. Proceedings of the 2020
International Conference for Emerging Technology (INCET), Belgaum,
India. Belgaum: (2020).
7. Yu D, Gu Y, Liu H, Li Q. Using machine learning algorithms, the air
quality index and air pollutant concentration may be predicted. Appl Sci.
(2019) 9:4069.

More Related Content

Similar to Air quality forecasting using convolutional neural networks

Ae4102224236
Ae4102224236Ae4102224236
Ae4102224236
IJERA Editor
 
Air Quality Visualization
Air Quality VisualizationAir Quality Visualization
Air Quality Visualization
IRJET Journal
 
A REVIEW PAPER ON PULMONARY NODULE DETECTION
A REVIEW PAPER ON PULMONARY NODULE DETECTIONA REVIEW PAPER ON PULMONARY NODULE DETECTION
A REVIEW PAPER ON PULMONARY NODULE DETECTION
IRJET Journal
 
A Review on Covid Detection using Cross Dataset Analysis
A Review on Covid Detection using Cross Dataset AnalysisA Review on Covid Detection using Cross Dataset Analysis
A Review on Covid Detection using Cross Dataset Analysis
IRJET Journal
 
Lung Cancer Detection Using Convolutional Neural Network
Lung Cancer Detection Using Convolutional Neural NetworkLung Cancer Detection Using Convolutional Neural Network
Lung Cancer Detection Using Convolutional Neural Network
IRJET Journal
 
Deep Learning-based Diagnosis of Pneumonia using X-Ray Scans
Deep Learning-based Diagnosis of Pneumonia using X-Ray ScansDeep Learning-based Diagnosis of Pneumonia using X-Ray Scans
Deep Learning-based Diagnosis of Pneumonia using X-Ray Scans
IRJET Journal
 
x-RAYS PROJECT
x-RAYS PROJECTx-RAYS PROJECT
x-RAYS PROJECT
PunithaPalanisamy1
 
IRJET- A Comprehensive Review on Air Pollution Detection using Data Mingi...
IRJET-  	  A Comprehensive Review on Air Pollution Detection using Data Mingi...IRJET-  	  A Comprehensive Review on Air Pollution Detection using Data Mingi...
IRJET- A Comprehensive Review on Air Pollution Detection using Data Mingi...
IRJET Journal
 
Pneumonia Detection Using Deep Learning and Transfer Learning
Pneumonia Detection Using Deep Learning and Transfer LearningPneumonia Detection Using Deep Learning and Transfer Learning
Pneumonia Detection Using Deep Learning and Transfer Learning
IRJET Journal
 
ENVIRONMENTAL QUALITY PREDICTION AND ITS DEPLOYMENT
ENVIRONMENTAL QUALITY PREDICTION AND ITS DEPLOYMENTENVIRONMENTAL QUALITY PREDICTION AND ITS DEPLOYMENT
ENVIRONMENTAL QUALITY PREDICTION AND ITS DEPLOYMENT
IRJET Journal
 
CLASSIFICATION OF CANCER BY GENE EXPRESSION USING NEURAL NETWORK
CLASSIFICATION OF CANCER BY GENE EXPRESSION USING NEURAL NETWORKCLASSIFICATION OF CANCER BY GENE EXPRESSION USING NEURAL NETWORK
CLASSIFICATION OF CANCER BY GENE EXPRESSION USING NEURAL NETWORK
International Research Journal of Modernization in Engineering Technology and Science
 
Classification of pneumonia from X-ray images using siamese convolutional net...
Classification of pneumonia from X-ray images using siamese convolutional net...Classification of pneumonia from X-ray images using siamese convolutional net...
Classification of pneumonia from X-ray images using siamese convolutional net...
TELKOMNIKA JOURNAL
 
Ec4030
Ec4030Ec4030
Ec4030
Ali Shahed
 
IRJET- A Survey on Medical Image Interpretation for Predicting Pneumonia
IRJET- A Survey on Medical Image Interpretation for Predicting PneumoniaIRJET- A Survey on Medical Image Interpretation for Predicting Pneumonia
IRJET- A Survey on Medical Image Interpretation for Predicting Pneumonia
IRJET Journal
 
Pneumonia Detection System using AI
Pneumonia Detection System using AIPneumonia Detection System using AI
Pneumonia Detection System using AI
IRJET Journal
 
Air Pollution Prediction using Machine Learning
Air Pollution Prediction using Machine LearningAir Pollution Prediction using Machine Learning
Air Pollution Prediction using Machine Learning
IRJET Journal
 
Sub1550
Sub1550Sub1550
Air_Quality_Index_Forecasting Prediction BP
Air_Quality_Index_Forecasting Prediction BPAir_Quality_Index_Forecasting Prediction BP
Air_Quality_Index_Forecasting Prediction BP
AnbuShare
 
Applications of Artificial Neural Networks in Cancer Prediction
Applications of Artificial Neural Networks in Cancer PredictionApplications of Artificial Neural Networks in Cancer Prediction
Applications of Artificial Neural Networks in Cancer Prediction
IRJET Journal
 
J04401066071
J04401066071J04401066071
J04401066071
ijceronline
 

Similar to Air quality forecasting using convolutional neural networks (20)

Ae4102224236
Ae4102224236Ae4102224236
Ae4102224236
 
Air Quality Visualization
Air Quality VisualizationAir Quality Visualization
Air Quality Visualization
 
A REVIEW PAPER ON PULMONARY NODULE DETECTION
A REVIEW PAPER ON PULMONARY NODULE DETECTIONA REVIEW PAPER ON PULMONARY NODULE DETECTION
A REVIEW PAPER ON PULMONARY NODULE DETECTION
 
A Review on Covid Detection using Cross Dataset Analysis
A Review on Covid Detection using Cross Dataset AnalysisA Review on Covid Detection using Cross Dataset Analysis
A Review on Covid Detection using Cross Dataset Analysis
 
Lung Cancer Detection Using Convolutional Neural Network
Lung Cancer Detection Using Convolutional Neural NetworkLung Cancer Detection Using Convolutional Neural Network
Lung Cancer Detection Using Convolutional Neural Network
 
Deep Learning-based Diagnosis of Pneumonia using X-Ray Scans
Deep Learning-based Diagnosis of Pneumonia using X-Ray ScansDeep Learning-based Diagnosis of Pneumonia using X-Ray Scans
Deep Learning-based Diagnosis of Pneumonia using X-Ray Scans
 
x-RAYS PROJECT
x-RAYS PROJECTx-RAYS PROJECT
x-RAYS PROJECT
 
IRJET- A Comprehensive Review on Air Pollution Detection using Data Mingi...
IRJET-  	  A Comprehensive Review on Air Pollution Detection using Data Mingi...IRJET-  	  A Comprehensive Review on Air Pollution Detection using Data Mingi...
IRJET- A Comprehensive Review on Air Pollution Detection using Data Mingi...
 
Pneumonia Detection Using Deep Learning and Transfer Learning
Pneumonia Detection Using Deep Learning and Transfer LearningPneumonia Detection Using Deep Learning and Transfer Learning
Pneumonia Detection Using Deep Learning and Transfer Learning
 
ENVIRONMENTAL QUALITY PREDICTION AND ITS DEPLOYMENT
ENVIRONMENTAL QUALITY PREDICTION AND ITS DEPLOYMENTENVIRONMENTAL QUALITY PREDICTION AND ITS DEPLOYMENT
ENVIRONMENTAL QUALITY PREDICTION AND ITS DEPLOYMENT
 
CLASSIFICATION OF CANCER BY GENE EXPRESSION USING NEURAL NETWORK
CLASSIFICATION OF CANCER BY GENE EXPRESSION USING NEURAL NETWORKCLASSIFICATION OF CANCER BY GENE EXPRESSION USING NEURAL NETWORK
CLASSIFICATION OF CANCER BY GENE EXPRESSION USING NEURAL NETWORK
 
Classification of pneumonia from X-ray images using siamese convolutional net...
Classification of pneumonia from X-ray images using siamese convolutional net...Classification of pneumonia from X-ray images using siamese convolutional net...
Classification of pneumonia from X-ray images using siamese convolutional net...
 
Ec4030
Ec4030Ec4030
Ec4030
 
IRJET- A Survey on Medical Image Interpretation for Predicting Pneumonia
IRJET- A Survey on Medical Image Interpretation for Predicting PneumoniaIRJET- A Survey on Medical Image Interpretation for Predicting Pneumonia
IRJET- A Survey on Medical Image Interpretation for Predicting Pneumonia
 
Pneumonia Detection System using AI
Pneumonia Detection System using AIPneumonia Detection System using AI
Pneumonia Detection System using AI
 
Air Pollution Prediction using Machine Learning
Air Pollution Prediction using Machine LearningAir Pollution Prediction using Machine Learning
Air Pollution Prediction using Machine Learning
 
Sub1550
Sub1550Sub1550
Sub1550
 
Air_Quality_Index_Forecasting Prediction BP
Air_Quality_Index_Forecasting Prediction BPAir_Quality_Index_Forecasting Prediction BP
Air_Quality_Index_Forecasting Prediction BP
 
Applications of Artificial Neural Networks in Cancer Prediction
Applications of Artificial Neural Networks in Cancer PredictionApplications of Artificial Neural Networks in Cancer Prediction
Applications of Artificial Neural Networks in Cancer Prediction
 
J04401066071
J04401066071J04401066071
J04401066071
 

More from BIJIAM Journal

Prevention of fire and hunting in forests using machine learning for sustaina...
Prevention of fire and hunting in forests using machine learning for sustaina...Prevention of fire and hunting in forests using machine learning for sustaina...
Prevention of fire and hunting in forests using machine learning for sustaina...
BIJIAM Journal
 
Object detection and ship classification using YOLO and Amazon Rekognition
Object detection and ship classification using YOLO and Amazon RekognitionObject detection and ship classification using YOLO and Amazon Rekognition
Object detection and ship classification using YOLO and Amazon Rekognition
BIJIAM Journal
 
Machine learning for autonomous online exam frauddetection: A concept design
Machine learning for autonomous online exam frauddetection: A concept designMachine learning for autonomous online exam frauddetection: A concept design
Machine learning for autonomous online exam frauddetection: A concept design
BIJIAM Journal
 
Prognostication of the placement of students applying machine learning algori...
Prognostication of the placement of students applying machine learning algori...Prognostication of the placement of students applying machine learning algori...
Prognostication of the placement of students applying machine learning algori...
BIJIAM Journal
 
Drug recommendation using recurrent neural networks augmented with cellular a...
Drug recommendation using recurrent neural networks augmented with cellular a...Drug recommendation using recurrent neural networks augmented with cellular a...
Drug recommendation using recurrent neural networks augmented with cellular a...
BIJIAM Journal
 
Discrete clusters formulation through the exploitation of optimized k-modes a...
Discrete clusters formulation through the exploitation of optimized k-modes a...Discrete clusters formulation through the exploitation of optimized k-modes a...
Discrete clusters formulation through the exploitation of optimized k-modes a...
BIJIAM Journal
 
Emotion Recognition Based on Speech Signals by Combining Empirical Mode Decom...
Emotion Recognition Based on Speech Signals by Combining Empirical Mode Decom...Emotion Recognition Based on Speech Signals by Combining Empirical Mode Decom...
Emotion Recognition Based on Speech Signals by Combining Empirical Mode Decom...
BIJIAM Journal
 
Enhanced 3D Brain Tumor Segmentation Using Assorted Precision Training
Enhanced 3D Brain Tumor Segmentation Using Assorted Precision TrainingEnhanced 3D Brain Tumor Segmentation Using Assorted Precision Training
Enhanced 3D Brain Tumor Segmentation Using Assorted Precision Training
BIJIAM Journal
 
Hybrid Facial Expression Recognition (FER2013) Model for Real-Time Emotion Cl...
Hybrid Facial Expression Recognition (FER2013) Model for Real-Time Emotion Cl...Hybrid Facial Expression Recognition (FER2013) Model for Real-Time Emotion Cl...
Hybrid Facial Expression Recognition (FER2013) Model for Real-Time Emotion Cl...
BIJIAM Journal
 
Role of Artificial Intelligence in Supply Chain Management
Role of Artificial Intelligence in Supply Chain ManagementRole of Artificial Intelligence in Supply Chain Management
Role of Artificial Intelligence in Supply Chain Management
BIJIAM Journal
 
An Internet – of – Things Enabled Smart Fire Fighting System
An Internet – of – Things Enabled Smart Fire Fighting SystemAn Internet – of – Things Enabled Smart Fire Fighting System
An Internet – of – Things Enabled Smart Fire Fighting System
BIJIAM Journal
 
Evaluate Sustainability of Using Autonomous Vehicles for the Last-mile Delive...
Evaluate Sustainability of Using Autonomous Vehicles for the Last-mile Delive...Evaluate Sustainability of Using Autonomous Vehicles for the Last-mile Delive...
Evaluate Sustainability of Using Autonomous Vehicles for the Last-mile Delive...
BIJIAM Journal
 
Automation Attendance Systems Approaches: A Practical Review
Automation Attendance Systems Approaches: A Practical ReviewAutomation Attendance Systems Approaches: A Practical Review
Automation Attendance Systems Approaches: A Practical Review
BIJIAM Journal
 
Transforming African Education Systems through the Application of IOT
Transforming African Education Systems through the Application of IOTTransforming African Education Systems through the Application of IOT
Transforming African Education Systems through the Application of IOT
BIJIAM Journal
 
Deep Learning Analysis for Estimating Sleep Syndrome Detection Utilizing the ...
Deep Learning Analysis for Estimating Sleep Syndrome Detection Utilizing the ...Deep Learning Analysis for Estimating Sleep Syndrome Detection Utilizing the ...
Deep Learning Analysis for Estimating Sleep Syndrome Detection Utilizing the ...
BIJIAM Journal
 
Robotic Mushroom Harvesting by Employing Probabilistic Road Map and Inverse K...
Robotic Mushroom Harvesting by Employing Probabilistic Road Map and Inverse K...Robotic Mushroom Harvesting by Employing Probabilistic Road Map and Inverse K...
Robotic Mushroom Harvesting by Employing Probabilistic Road Map and Inverse K...
BIJIAM Journal
 

More from BIJIAM Journal (16)

Prevention of fire and hunting in forests using machine learning for sustaina...
Prevention of fire and hunting in forests using machine learning for sustaina...Prevention of fire and hunting in forests using machine learning for sustaina...
Prevention of fire and hunting in forests using machine learning for sustaina...
 
Object detection and ship classification using YOLO and Amazon Rekognition
Object detection and ship classification using YOLO and Amazon RekognitionObject detection and ship classification using YOLO and Amazon Rekognition
Object detection and ship classification using YOLO and Amazon Rekognition
 
Machine learning for autonomous online exam frauddetection: A concept design
Machine learning for autonomous online exam frauddetection: A concept designMachine learning for autonomous online exam frauddetection: A concept design
Machine learning for autonomous online exam frauddetection: A concept design
 
Prognostication of the placement of students applying machine learning algori...
Prognostication of the placement of students applying machine learning algori...Prognostication of the placement of students applying machine learning algori...
Prognostication of the placement of students applying machine learning algori...
 
Drug recommendation using recurrent neural networks augmented with cellular a...
Drug recommendation using recurrent neural networks augmented with cellular a...Drug recommendation using recurrent neural networks augmented with cellular a...
Drug recommendation using recurrent neural networks augmented with cellular a...
 
Discrete clusters formulation through the exploitation of optimized k-modes a...
Discrete clusters formulation through the exploitation of optimized k-modes a...Discrete clusters formulation through the exploitation of optimized k-modes a...
Discrete clusters formulation through the exploitation of optimized k-modes a...
 
Emotion Recognition Based on Speech Signals by Combining Empirical Mode Decom...
Emotion Recognition Based on Speech Signals by Combining Empirical Mode Decom...Emotion Recognition Based on Speech Signals by Combining Empirical Mode Decom...
Emotion Recognition Based on Speech Signals by Combining Empirical Mode Decom...
 
Enhanced 3D Brain Tumor Segmentation Using Assorted Precision Training
Enhanced 3D Brain Tumor Segmentation Using Assorted Precision TrainingEnhanced 3D Brain Tumor Segmentation Using Assorted Precision Training
Enhanced 3D Brain Tumor Segmentation Using Assorted Precision Training
 
Hybrid Facial Expression Recognition (FER2013) Model for Real-Time Emotion Cl...
Hybrid Facial Expression Recognition (FER2013) Model for Real-Time Emotion Cl...Hybrid Facial Expression Recognition (FER2013) Model for Real-Time Emotion Cl...
Hybrid Facial Expression Recognition (FER2013) Model for Real-Time Emotion Cl...
 
Role of Artificial Intelligence in Supply Chain Management
Role of Artificial Intelligence in Supply Chain ManagementRole of Artificial Intelligence in Supply Chain Management
Role of Artificial Intelligence in Supply Chain Management
 
An Internet – of – Things Enabled Smart Fire Fighting System
An Internet – of – Things Enabled Smart Fire Fighting SystemAn Internet – of – Things Enabled Smart Fire Fighting System
An Internet – of – Things Enabled Smart Fire Fighting System
 
Evaluate Sustainability of Using Autonomous Vehicles for the Last-mile Delive...
Evaluate Sustainability of Using Autonomous Vehicles for the Last-mile Delive...Evaluate Sustainability of Using Autonomous Vehicles for the Last-mile Delive...
Evaluate Sustainability of Using Autonomous Vehicles for the Last-mile Delive...
 
Automation Attendance Systems Approaches: A Practical Review
Automation Attendance Systems Approaches: A Practical ReviewAutomation Attendance Systems Approaches: A Practical Review
Automation Attendance Systems Approaches: A Practical Review
 
Transforming African Education Systems through the Application of IOT
Transforming African Education Systems through the Application of IOTTransforming African Education Systems through the Application of IOT
Transforming African Education Systems through the Application of IOT
 
Deep Learning Analysis for Estimating Sleep Syndrome Detection Utilizing the ...
Deep Learning Analysis for Estimating Sleep Syndrome Detection Utilizing the ...Deep Learning Analysis for Estimating Sleep Syndrome Detection Utilizing the ...
Deep Learning Analysis for Estimating Sleep Syndrome Detection Utilizing the ...
 
Robotic Mushroom Harvesting by Employing Probabilistic Road Map and Inverse K...
Robotic Mushroom Harvesting by Employing Probabilistic Road Map and Inverse K...Robotic Mushroom Harvesting by Employing Probabilistic Road Map and Inverse K...
Robotic Mushroom Harvesting by Employing Probabilistic Road Map and Inverse K...
 

Recently uploaded

5214-1693458878915-Unit 6 2023 to 2024 academic year assignment (AutoRecovere...
5214-1693458878915-Unit 6 2023 to 2024 academic year assignment (AutoRecovere...5214-1693458878915-Unit 6 2023 to 2024 academic year assignment (AutoRecovere...
5214-1693458878915-Unit 6 2023 to 2024 academic year assignment (AutoRecovere...
ihlasbinance2003
 
Eric Nizeyimana's document 2006 from gicumbi to ttc nyamata handball play
Eric Nizeyimana's document 2006 from gicumbi to ttc nyamata handball playEric Nizeyimana's document 2006 from gicumbi to ttc nyamata handball play
Eric Nizeyimana's document 2006 from gicumbi to ttc nyamata handball play
enizeyimana36
 
Textile Chemical Processing and Dyeing.pdf
Textile Chemical Processing and Dyeing.pdfTextile Chemical Processing and Dyeing.pdf
Textile Chemical Processing and Dyeing.pdf
NazakatAliKhoso2
 
22CYT12-Unit-V-E Waste and its Management.ppt
22CYT12-Unit-V-E Waste and its Management.ppt22CYT12-Unit-V-E Waste and its Management.ppt
22CYT12-Unit-V-E Waste and its Management.ppt
KrishnaveniKrishnara1
 
Understanding Inductive Bias in Machine Learning
Understanding Inductive Bias in Machine LearningUnderstanding Inductive Bias in Machine Learning
Understanding Inductive Bias in Machine Learning
SUTEJAS
 
Redefining brain tumor segmentation: a cutting-edge convolutional neural netw...
Redefining brain tumor segmentation: a cutting-edge convolutional neural netw...Redefining brain tumor segmentation: a cutting-edge convolutional neural netw...
Redefining brain tumor segmentation: a cutting-edge convolutional neural netw...
IJECEIAES
 
A SYSTEMATIC RISK ASSESSMENT APPROACH FOR SECURING THE SMART IRRIGATION SYSTEMS
A SYSTEMATIC RISK ASSESSMENT APPROACH FOR SECURING THE SMART IRRIGATION SYSTEMSA SYSTEMATIC RISK ASSESSMENT APPROACH FOR SECURING THE SMART IRRIGATION SYSTEMS
A SYSTEMATIC RISK ASSESSMENT APPROACH FOR SECURING THE SMART IRRIGATION SYSTEMS
IJNSA Journal
 
Heat Resistant Concrete Presentation ppt
Heat Resistant Concrete Presentation pptHeat Resistant Concrete Presentation ppt
Heat Resistant Concrete Presentation ppt
mamunhossenbd75
 
Literature Review Basics and Understanding Reference Management.pptx
Literature Review Basics and Understanding Reference Management.pptxLiterature Review Basics and Understanding Reference Management.pptx
Literature Review Basics and Understanding Reference Management.pptx
Dr Ramhari Poudyal
 
Casting-Defect-inSlab continuous casting.pdf
Casting-Defect-inSlab continuous casting.pdfCasting-Defect-inSlab continuous casting.pdf
Casting-Defect-inSlab continuous casting.pdf
zubairahmad848137
 
Generative AI leverages algorithms to create various forms of content
Generative AI leverages algorithms to create various forms of contentGenerative AI leverages algorithms to create various forms of content
Generative AI leverages algorithms to create various forms of content
Hitesh Mohapatra
 
A review on techniques and modelling methodologies used for checking electrom...
A review on techniques and modelling methodologies used for checking electrom...A review on techniques and modelling methodologies used for checking electrom...
A review on techniques and modelling methodologies used for checking electrom...
nooriasukmaningtyas
 
TIME DIVISION MULTIPLEXING TECHNIQUE FOR COMMUNICATION SYSTEM
TIME DIVISION MULTIPLEXING TECHNIQUE FOR COMMUNICATION SYSTEMTIME DIVISION MULTIPLEXING TECHNIQUE FOR COMMUNICATION SYSTEM
TIME DIVISION MULTIPLEXING TECHNIQUE FOR COMMUNICATION SYSTEM
HODECEDSIET
 
Modelagem de um CSTR com reação endotermica.pdf
Modelagem de um CSTR com reação endotermica.pdfModelagem de um CSTR com reação endotermica.pdf
Modelagem de um CSTR com reação endotermica.pdf
camseq
 
Presentation of IEEE Slovenia CIS (Computational Intelligence Society) Chapte...
Presentation of IEEE Slovenia CIS (Computational Intelligence Society) Chapte...Presentation of IEEE Slovenia CIS (Computational Intelligence Society) Chapte...
Presentation of IEEE Slovenia CIS (Computational Intelligence Society) Chapte...
University of Maribor
 
官方认证美国密歇根州立大学毕业证学位证书原版一模一样
官方认证美国密歇根州立大学毕业证学位证书原版一模一样官方认证美国密歇根州立大学毕业证学位证书原版一模一样
官方认证美国密歇根州立大学毕业证学位证书原版一模一样
171ticu
 
Engineering Drawings Lecture Detail Drawings 2014.pdf
Engineering Drawings Lecture Detail Drawings 2014.pdfEngineering Drawings Lecture Detail Drawings 2014.pdf
Engineering Drawings Lecture Detail Drawings 2014.pdf
abbyasa1014
 
CHINA’S GEO-ECONOMIC OUTREACH IN CENTRAL ASIAN COUNTRIES AND FUTURE PROSPECT
CHINA’S GEO-ECONOMIC OUTREACH IN CENTRAL ASIAN COUNTRIES AND FUTURE PROSPECTCHINA’S GEO-ECONOMIC OUTREACH IN CENTRAL ASIAN COUNTRIES AND FUTURE PROSPECT
CHINA’S GEO-ECONOMIC OUTREACH IN CENTRAL ASIAN COUNTRIES AND FUTURE PROSPECT
jpsjournal1
 
The Python for beginners. This is an advance computer language.
The Python for beginners. This is an advance computer language.The Python for beginners. This is an advance computer language.
The Python for beginners. This is an advance computer language.
sachin chaurasia
 
Recycled Concrete Aggregate in Construction Part II
Recycled Concrete Aggregate in Construction Part IIRecycled Concrete Aggregate in Construction Part II
Recycled Concrete Aggregate in Construction Part II
Aditya Rajan Patra
 

Recently uploaded (20)

5214-1693458878915-Unit 6 2023 to 2024 academic year assignment (AutoRecovere...
5214-1693458878915-Unit 6 2023 to 2024 academic year assignment (AutoRecovere...5214-1693458878915-Unit 6 2023 to 2024 academic year assignment (AutoRecovere...
5214-1693458878915-Unit 6 2023 to 2024 academic year assignment (AutoRecovere...
 
Eric Nizeyimana's document 2006 from gicumbi to ttc nyamata handball play
Eric Nizeyimana's document 2006 from gicumbi to ttc nyamata handball playEric Nizeyimana's document 2006 from gicumbi to ttc nyamata handball play
Eric Nizeyimana's document 2006 from gicumbi to ttc nyamata handball play
 
Textile Chemical Processing and Dyeing.pdf
Textile Chemical Processing and Dyeing.pdfTextile Chemical Processing and Dyeing.pdf
Textile Chemical Processing and Dyeing.pdf
 
22CYT12-Unit-V-E Waste and its Management.ppt
22CYT12-Unit-V-E Waste and its Management.ppt22CYT12-Unit-V-E Waste and its Management.ppt
22CYT12-Unit-V-E Waste and its Management.ppt
 
Understanding Inductive Bias in Machine Learning
Understanding Inductive Bias in Machine LearningUnderstanding Inductive Bias in Machine Learning
Understanding Inductive Bias in Machine Learning
 
Redefining brain tumor segmentation: a cutting-edge convolutional neural netw...
Redefining brain tumor segmentation: a cutting-edge convolutional neural netw...Redefining brain tumor segmentation: a cutting-edge convolutional neural netw...
Redefining brain tumor segmentation: a cutting-edge convolutional neural netw...
 
A SYSTEMATIC RISK ASSESSMENT APPROACH FOR SECURING THE SMART IRRIGATION SYSTEMS
A SYSTEMATIC RISK ASSESSMENT APPROACH FOR SECURING THE SMART IRRIGATION SYSTEMSA SYSTEMATIC RISK ASSESSMENT APPROACH FOR SECURING THE SMART IRRIGATION SYSTEMS
A SYSTEMATIC RISK ASSESSMENT APPROACH FOR SECURING THE SMART IRRIGATION SYSTEMS
 
Heat Resistant Concrete Presentation ppt
Heat Resistant Concrete Presentation pptHeat Resistant Concrete Presentation ppt
Heat Resistant Concrete Presentation ppt
 
Literature Review Basics and Understanding Reference Management.pptx
Literature Review Basics and Understanding Reference Management.pptxLiterature Review Basics and Understanding Reference Management.pptx
Literature Review Basics and Understanding Reference Management.pptx
 
Casting-Defect-inSlab continuous casting.pdf
Casting-Defect-inSlab continuous casting.pdfCasting-Defect-inSlab continuous casting.pdf
Casting-Defect-inSlab continuous casting.pdf
 
Generative AI leverages algorithms to create various forms of content
Generative AI leverages algorithms to create various forms of contentGenerative AI leverages algorithms to create various forms of content
Generative AI leverages algorithms to create various forms of content
 
A review on techniques and modelling methodologies used for checking electrom...
A review on techniques and modelling methodologies used for checking electrom...A review on techniques and modelling methodologies used for checking electrom...
A review on techniques and modelling methodologies used for checking electrom...
 
TIME DIVISION MULTIPLEXING TECHNIQUE FOR COMMUNICATION SYSTEM
TIME DIVISION MULTIPLEXING TECHNIQUE FOR COMMUNICATION SYSTEMTIME DIVISION MULTIPLEXING TECHNIQUE FOR COMMUNICATION SYSTEM
TIME DIVISION MULTIPLEXING TECHNIQUE FOR COMMUNICATION SYSTEM
 
Modelagem de um CSTR com reação endotermica.pdf
Modelagem de um CSTR com reação endotermica.pdfModelagem de um CSTR com reação endotermica.pdf
Modelagem de um CSTR com reação endotermica.pdf
 
Presentation of IEEE Slovenia CIS (Computational Intelligence Society) Chapte...
Presentation of IEEE Slovenia CIS (Computational Intelligence Society) Chapte...Presentation of IEEE Slovenia CIS (Computational Intelligence Society) Chapte...
Presentation of IEEE Slovenia CIS (Computational Intelligence Society) Chapte...
 
官方认证美国密歇根州立大学毕业证学位证书原版一模一样
官方认证美国密歇根州立大学毕业证学位证书原版一模一样官方认证美国密歇根州立大学毕业证学位证书原版一模一样
官方认证美国密歇根州立大学毕业证学位证书原版一模一样
 
Engineering Drawings Lecture Detail Drawings 2014.pdf
Engineering Drawings Lecture Detail Drawings 2014.pdfEngineering Drawings Lecture Detail Drawings 2014.pdf
Engineering Drawings Lecture Detail Drawings 2014.pdf
 
CHINA’S GEO-ECONOMIC OUTREACH IN CENTRAL ASIAN COUNTRIES AND FUTURE PROSPECT
CHINA’S GEO-ECONOMIC OUTREACH IN CENTRAL ASIAN COUNTRIES AND FUTURE PROSPECTCHINA’S GEO-ECONOMIC OUTREACH IN CENTRAL ASIAN COUNTRIES AND FUTURE PROSPECT
CHINA’S GEO-ECONOMIC OUTREACH IN CENTRAL ASIAN COUNTRIES AND FUTURE PROSPECT
 
The Python for beginners. This is an advance computer language.
The Python for beginners. This is an advance computer language.The Python for beginners. This is an advance computer language.
The Python for beginners. This is an advance computer language.
 
Recycled Concrete Aggregate in Construction Part II
Recycled Concrete Aggregate in Construction Part IIRecycled Concrete Aggregate in Construction Part II
Recycled Concrete Aggregate in Construction Part II
 

Air quality forecasting using convolutional neural networks

  • 1. BOHR International Journal of Internet of things, Artificial Intelligence and Machine Learning 2023, Vol. 2, No. 1, pp. 65–69 DOI: 10.54646/bijiam.2023.18 www.bohrpub.com RESEARCH Air quality forecasting using convolutional neural networks G. R. Ashika* and M. Germin Nisha Department of Electrical and Electronics Engineering, St. Xavier’s Catholic College of Engineering, Chunkankadai, Nagercoil, India *Correspondence: G. R. Ashika, ashikagr1999@gmail.com Received: 22 June 2023; Accepted: 12 August 2023; Published: 26 September 2023 Air pollution is now one of the biggest environmental risks, which causes more than 6 million premature deaths each year from heart diseases, stroke, diabetes, respiratory disease, and so on. Protecting humans from the damage which is caused by air pollution is one of the major issues for the global community. The prediction of air pollution can be done by machine learning (ML) algorithms. ML combines statistics and computer science to maximize the prediction power. ML can be also used to predict the air quality index (AQI). The aim of this research is to develop a convolutional neural network (CNN) model to predict air quality from the unseen data set, which includes concentration of nitrogen dioxide (NO2), carbon monoxide (CO), and sulfur dioxide (SO2). The proposed system will be implemented in two steps; the first step will focus on data analysis and pre-processing, including filtering, feature extraction, constructing convolutional neural network layers, and optimizing the parameters of each layer, while the second step is used to evaluate its model accuracy. The output is predicted as AQI for the developed CNN model. The developed CNN model achieves a root-mean-square error of 13.4150 and a high accuracy of 86.585%. The overall model is implemented using MATLAB software. Keywords: air quality prediction, air pollution, deep learning algorithm, convolutional neural network, air quality index 1. Introduction Artificial intelligence (AI) is a powerful tool that is used for measuring and solving people’s problems. AI technology allows machines to mimic human behavior. The different neural network architectures like deep neural network (DNN), recurrent neural network (RNN), and convolutional neural network (CNN) and machine learning algorithms ensure that future air quality indexes (AQIs) can be predicted. Supervised learning, unsupervised learning, and reinforcement learning are the learning algorithms used in machine learning (ML) of AI (1). Air pollution refers to indoor or outdoor air pollution. When pollutants enter the environment, the air becomes polluted, making plants, animals, and humans unable to live. One of the leading causes of death is air pollution (2). Air pollution killed 6.6 million people in 2020. Therefore, we need a reliable forecasting system. Sulfur dioxide (SO2), carbon monoxide (CO), particulate matter (PM), nitrogen oxide (NO), and other pollutants are the most harmful air pollutants. AQI is a standard used to measure the air quality. This article focuses on an important aspect of deep learning such as CNN that is used to predict quality of air. The aim of this research is to develop a CNN model to predict air quality from invisible data, including the concentration of pollutants. 2. Air quality prediction model The proposed air quality prediction (AQP) model is mainly based on CNN. 2.1. Deep learning algorithm Deep learning uses ANNs to perform the complex calculations on large datasets. It is based on the structure 65
  • 2. 66 Ashika and Nisha FIGURE 1 | Architecture of convolutional neural network (CNN). FIGURE 2 | Proposed System Block Diagram. and function of the human brain. This algorithm trains the machines by learning it from the examples. Deep learning architectures are designed to solve the problem of climate change (3). Deep learning is performed by DNNs. There are many different DNN architectures such as CNNs. It is also classified according to whether it is learned with supervision or not. Unsupervised DNNs can use unlabeled data, while supervised DNNs must collect training data for the training. The CNN we use in this article is a supervised DNN. 2.2. Convolutional neural network Convolutional neural network (CNN) is a neural network architecture used for deep learning. The structure of CNN has a three-layer architecture shown in Figure 1, where the first layer is usually called a convolutional layer, the next layer is called a pooling layer, and the final layer is a fully connected layer. It is used in many applications like image classification (4), face recognition, object detection, and so on. They are also great for audio classification and distribution, time-series, and signal data. 2.2.1. Convolutional layer This layer is the main building block of CNNs. It has a set of filters whose parameters will be examined throughout the training process. The filter size is usually smaller than the actual image. Each filter intertwines with the image and creates an activation map. 2.2.2. Pooling layer The pooling layer is mainly responsible for reducing the spatial size of the convolved feature. Pooling layers down sample the feature maps by reducing their size. The two types of pooling (5) are: (i) Max pooling: the maximum pixel value of the selected batch. (ii) Average pooling: the average of all pixels in a group is selected. 2.2.3. Fully connected layer The FC layer is a neural network in which each neuron applies a linear transformation from a weight matrix to an input vector. The FC layer has weights, biases, and neurons. An FC layer takes and multiplies the input by the weight matrix and then it adds the bias vector. 3. Proposed CNN model The proposed model is based on CNN. The system uses CNN supervised deep learning algorithm to monitor the air quality. The deep learning architecture is designed to solve air pollution prediction problems, climate change problems, non-linear, seasonal, cyclical, and sequential dependency problems between the pollutant data. Figure 2 represents the block diagram for predicting the quality of air using a CNN. In Figure 2, data sets of sulfur dioxide (SO2), nitrogen dioxide (NO2), and carbon monoxide (CO) are given as input. A convolutional layer consists of a set of filters that will filter the input. In CNN, the convolutional layer extracts various features of the input. The output is termed as a feature map. Next, the pooling layer will reduce the size of the feature map. Therefore, the number of computations in the network is reduced and the computational costs are also reduced. An FC layer consists of weights, biases, and neurons and is used to connect neurons in two different layers. The AQI will be predicted for the developed CNN model. 4. Air quality index Air quality index (AQI) is used to indicate everyday air quality (6). The index’s daily values are used to communicate air pollution forecasts to the public. An increase in the AQI means an increase in air pollution that threatens human health. The AQI ranges from zero to five hundred (0-500) (7). The composition of each pollutant is different; that is why AQI values are categorized for public health warnings and color codes. 1. 0-50 indicates AQI is “Good” 2. 51-100 indicates AQI is “Moderate” 3. 101-150 indicates AQI is “Unhealthy for some Sensitive Groups” 4. 151-200 indicates AQI is “Unhealthy” 5. 201-300 indicates AQI is “Very Unhealthy”
  • 3. 10.54646/bijiam.2023.18 67 TABLE 1 | Breakpoints for air quality index (AQI). AQI categories (Index Values) CO (ppm) SO2 (ppb) NO2 (ppb) Good (0–50) 0–4.4 0–35 0–53 Moderate (51–100) 4.5–9.4 36–75 54–100 Unhealthy for some sensitive groups (101–150) 9.5–12.4 76–185 101–360 Unhealthy (151–200) 12.5–15.4 186–304 361–649 Very unhealthy (201–300) 15.5–30.4 305–604 650–1249 Hazardous (301–500) 30.5–50.4 605-1004 1250–2049 TABLE 2 | Data set samples. CO (ppm) SO2 (ppb) NO2 (ppb) AQI 0.2 6 0.8 1 0.8 10 3 5 15.9 320 691 205 22.8 528 1,134 287 10.2 91 201 112 11.5 136 307 134 46.2 936 1,987 447 40 834 1,780 415 13 200 418 159 13.6 234 444 167 FIGURE 3 | Concentration of CO samples. 6. Greater than 300 indicates AQI is “Hazardous” The AQI is calculated by determining the concentration of pollutants from a linear function. Table 1 shows the AQI breakpoints for three pollutants: sulfur dioxide (SO2), carbon monoxide (CO), and nitrogen dioxide (NO2). These breakpoints are used to identify health practices for each AQI group, so people can understand their health impacts and protect themselves from them. FIGURE 4 | Concentration of SO2 samples. FIGURE 5 | Concentration of NO2 samples. FIGURE 6 | Training input. 5. Results and discussion Here, some of the experimental results are presented to demonstrate the effectiveness of the proposed prediction model. The data set of the concentrations of pollutants CO, SO2, and NO2 are used in the experiments. 5.1. Datasets The sample data set for developing the CNN model is represented in Table 2. It shows the sample data sets of the pollutants nitrogen dioxide (NO2), sulfur dioxide (SO2), and carbon monoxide (CO) and their corresponding AQI values for developing the CNN model. These data sets are trained and tested for the development of the CNN model.
  • 4. 68 Ashika and Nisha FIGURE 7 | Training output. FIGURE 8 | Testing data. FIGURE 9 | Predicted output. 5.2. Concentration of pollutants The graphical representation of data sets for concentrations of pollutants nitrogen dioxide (NO2), sulfur dioxide (SO2), and carbon monoxide (CO) are represented. Figure 3 shows the graphical representation of concentration of CO samples in the data sets. The concentration of CO is trained and also tested for the development of the future CNN model. The range of concentrations of CO samples which are taken for the development of the CNN model is 0-50.4 (ppm). Figure 4 shows the graphical representation of concentration of SO2 samples in the data sets. The concentration of SO2 is trained and also tested for the development of the upcoming CNN model. The range of FIGURE 10 | Training progress. FIGURE 11 | Original and predicted output of convolutional neural network (CNN) model. concentrations of SO2 samples which are taken for the development of the CNN model is 0-1004 (ppb). Figure 5 shows the graphical representation of concentration of NO2 samples in the data sets. The concentration of NO2 is trained and also tested for the development of the future CNN model. The range of concentrations of NO2 samples which are taken for the development of the CNN model is 0-2049 (ppb). 5.3. Training and testing data Figure 6 shows the graphical representation of training input taken from the data sets. The concentrations of the pollutants CO, SO2, and NO2 are taken as training input for the development of the CNN model. Figure 7 shows the graphical representation of training output taken from the data sets. The AQI values are taken as training output for the development of the CNN model. Figure 8 shows the graphical representation of testing data taken from the data sets. The concentrations of the pollutants CO, SO2, and NO2 are taken as testing input for the development of the CNN model. 5.4 Predicted output Figure 9 shows the graphical representation of predicted output. The AQI values are obtained.
  • 5. 10.54646/bijiam.2023.18 69 Figure 10 shows the graphical representation of the training progress of the predicted output of the developed CNN model. Figure 11 represents the original and predicted output of the developed CNN model. AQI is obtained as the result. The root mean square error (RMSE) obtained for the developed CNN model is 13.4150. 6. Conclusion An effective air quality forecast model based on the CNN with supervised deep learning algorithm is proposed in this article. The overall system is implemented by the MATLAB software. The data set samples are collected. The collected sample data sets are trained and then tested for development of the CNN model. Then from the collected sample data set, the training inputs are converted into 4D arrays for training. The CNN is constructed with all layers. After that, the training process will be done for the CNN. Then the testing is done, and the testing data from the sample data set are converted into 4D arrays for the testing process. The testing process is done for the CNN model. The output is predicted for the developed CNN model as the AQI. The developed CNN model achieves RMSE of 13.4150 and 86.585% accuracy. In future, more efficient suitable deep learning models can be developed to predict air quality. Author contributions Both authors made important contributions to developing the CNN model, which has data analysis and pre-processing and also contributed in testing the accuracy of the developed model using unseen datasets. References 1. Aditya CR, Vidyavastu P, Nayana DK, et al. ML models for air pollution detection and prediction. Int J Eng Trends Technol. 59:204–7. 2. Maleki H, Goudarzi G, Rahmati M, Baboli Z, Sorooshian A, Birgani YT. Air pollution prediction using an artificial neural network model. Clean Technol Environ Policy. (2019) 21:1341–52. 3. Horng S, Li T, Yang Y, Du S. The use of a hybrid deep learning framework for deep air quality forecasting. IEEE Trans Knowl Data Eng. (2021) 33:2412–24. 4. Zhang J, Xie Y, Rijal N, Yang W, Bo Q. Utilising convolutional neural networks and weather features for particle pollution estimation from images. Proceedings of the 25th IEEE International Conference on the Image Processing, Athens, Greece. Athens: (2018). p. 3433–7. 5. Chauhan R, Kaur H, Alankar B. Convolutional neural networks are used for air quality forecasting in urban environments to promote sustainable development. Sustain Urban Commun Soc. (2021) 75:103239. 6. Bedekar M, Singh VM, Barve A, Shrirao S. LSTM cells and parallel dense neural networks for air quality index forecast. Proceedings of the 2020 International Conference for Emerging Technology (INCET), Belgaum, India. Belgaum: (2020). 7. Yu D, Gu Y, Liu H, Li Q. Using machine learning algorithms, the air quality index and air pollutant concentration may be predicted. Appl Sci. (2019) 9:4069.