Downloaded 393 times
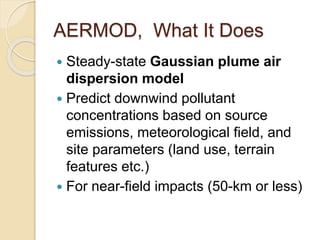
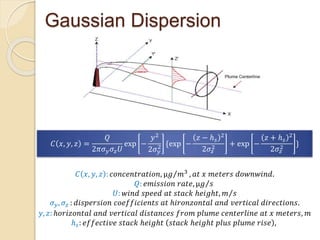

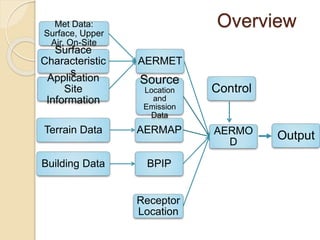

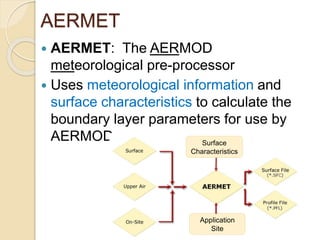

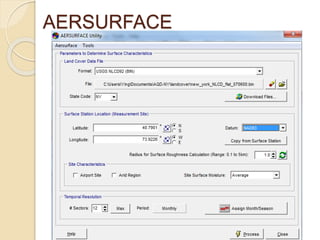
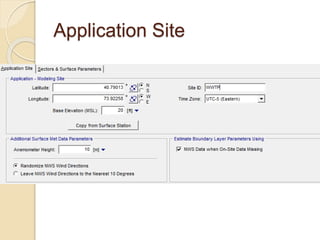
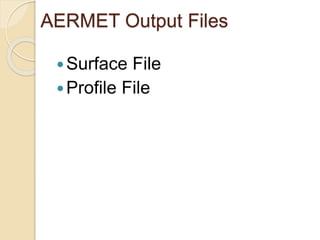
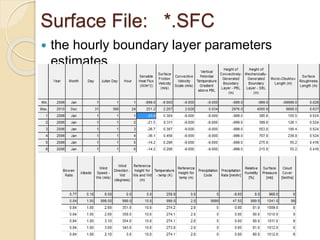

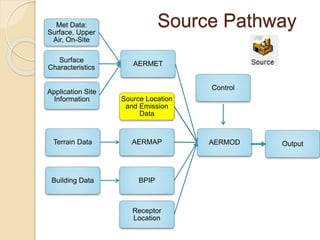
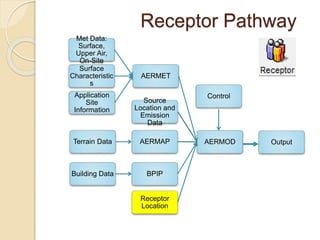
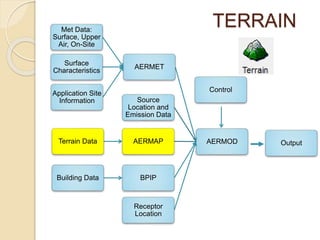

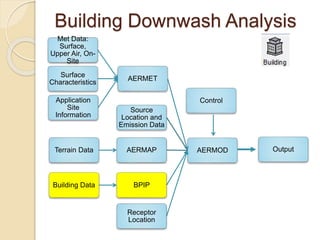
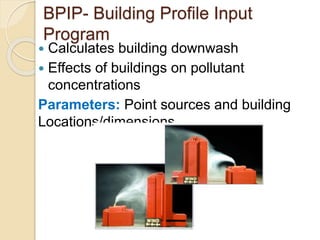
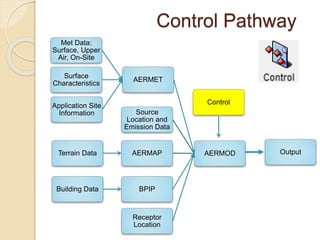


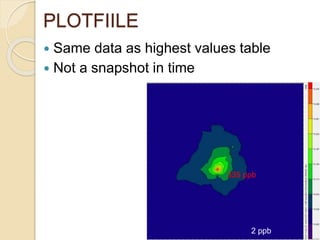
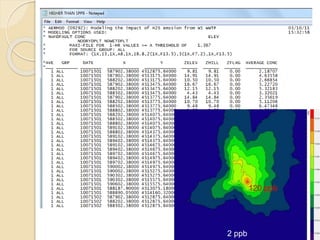

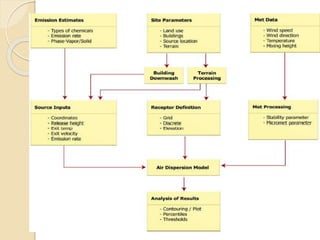

AERMOD is a steady-state Gaussian plume dispersion model used to predict pollutant concentrations from emissions sources. It uses meteorological and site data along with source specifications to calculate pollutant dispersion and concentrations at receptor locations. The model workflow involves using AERMET to process meteorological surface and upper air data along with surface characteristics. AERMAP processes terrain data. BPIP accounts for building downwash effects. The model then calculates concentrations at receptor locations specified by the user. Model output includes concentration and deposition values at receptors which can be used to assess impacts and compliance with air quality standards.


