1748 Mukund PratapSingh et al. / Procedia Computer Science 258 (2025) 1747–1756
2 Author name / Procedia Computer Science 00 (2025) 000–000
1. Introduction
The concern for Air pollution is a necessary issue in society and the need for awareness is increasing. Air
pollution can cause humans to develop several dangerous ailments, including lung cancer heart disease, bronchitis,
pneumonia, and heart disease. Over the past decades, researchers have been concerned regarding the increasing
number of deaths per year worldwide which is approximately 6 billion with two-thirds of deaths being due to
outdoor air pollution and the other one-third being due to air pollution from household activities [1]. The maturity of
metropolises is causing air pollution. Most metropolises are experiencing an increase in air pollution. Air adulterants
include O3, CO, SO2, particulate matter PM2.5, PM10, NO2, and NH3. These days, there is an increased focus on
air pollution monitoring because of its significant effects on both mortal health and the ecological balance. The air
adulterants' indicator measures the quantum of pollution that assiduity causes to the terrain (PM2.5, NO2, SOx, O3,
etc.). A high Air Quality Index (AQI) generally corresponds with advanced air pollution situations and health issues.
An air quality level of 50 or below is supposed to be good, and dangerous if it is 300 or higher. Six categories are
used by the AQI to classify health issues. Managing and resolving issues with air pollution takes effort and time. The
AQI category according to the Central Pollution Control Board is shown in Table 1.
Air pollution is intimately related to human problems such as asthma, emphysema, various respiratory conditions,
and chronic illnesses. Everyone needs access to clean air. Consequently, it is critical to appropriately monitor and
address the problem of air pollution. We can reduce the overall effects of air pollution on humans by adopting
necessary preventive actions and using accurate air quality forecasts. Empowering individuals to take proactive
measures to preserve their health is the major goal, as those who currently suffer from respiratory disorders are more
sensitive to the detrimental consequences of modest air quality. In India, barriers to economic growth and major
health concerns are the result of poor air quality. Power plants, open garbage burning, soil and road dust, vehicle
traffic on Indian roads, waste ignition, and the energy production segment, are the main sources of pollution
emissions in India. In this study, multiple machine learning models are employed to predict air quality indices,
necessitating a comprehensive examination of the merits and demerits of each model. These evaluations are critical
for understanding the operational feasibility of the models in real-time applications [19].
Table 1. Different categories of Air Quality Index (AQI)
Level PM2.5 (g/m3) AQI
Preferred_Good 0.0 – 12.0 0.0 – 50.0
Preferred_Moderate 12.1 – 35.4 51.0 – 100
Preferred_Unhealthy (sensitive group) 35.5 – 55.4 101 – 150
Preferred_Unhealthy 55.5 – 150.4 151 – 200
Preferred_Very Unhealthy 150.5 – 250.4 201 – 300
2. Related Work
The AQI scale has a range of 0 to 500. According to the National Ambient Air Quality Standards, there are six
different AQI orderings: in the range between 0.0 and 50.0 acceptable, 51.0-100.0 satisfactory, 101.0-200.0
moderate, 201.0-300.0 deprived, 301.0-400.0 tremendously wicked, and 401.0-500.0 severe. There are several
Machine Learning (ML) algorithms that can be used to identify AQI. This model is suitable for resolving
environmental liabilities [3]. According to several studies, microcontroller hardware solutions that use lightweight
machine learning can meet the need for AQI prediction at a reasonable cost. This entails combining methods for
analyzing data on air pollution with lightweight ML techniques. After evaluating algorithms based on MAE, RMSE,
and R2, XGBoost performed best for low-cost AQI predictions [4]. The three models, the M5P model tree, the
support vector machine (SVM), and the artificial neural network (ANN) are evaluated for pollution forecasting.
Following a comparison of two methods, support vector regression and random forest regression, for forecasting
Beijing's AQI data and nitrogen oxide (NOx) concentrations. The support vector regression worked well for AQI
prediction based on experimental findings the root-mean-square is 7.666 R2 square score is 0.9776 and r is 0.9887,
whereas the model that performed better is the RFR-based model for NOX concentration prediction where RMSE is
3.
Mukund Pratap Singhet al. / Procedia Computer Science 258 (2025) 1747–1756 1749
Author name / Procedia Computer Science 00 (2025) 000–000 3
83.6716, R2 is 0.8401, and r is 0.9180) [5]. To predict Ahmedabad city AQI level the dataset is provided by the
Central Pollution Control Board (CPCB) and various ML methods like SARIMA, support vector machine, and
LSTM are used. The algorithm that performed best in the comparison is SVM with the kernel as RBF [6]. There
exist ML algorithms that can be utilized to predict the AQI level such as ensemble boosted tree (EBOT), ensemble
bagged tree (EBAT), and fine decision tree (FDT). The model is trained on a dataset that involves AQI data from the
year 2016 to 2018. The accuracy score calculated for each model shows that the EBOT correctly predicted 75 out of
77 samples and the accuracy achieved is 97.4% which is best among the other two. The accuracy score of the other
two models, FDT and EBAT is 96.1% and 94.8% [7]. After evaluating various models, the Gaussian Naive Bayes
model achieved the highest accuracy, and the model that achieved the lowest accuracy was the Support Vector
Machine. There are predefined performance indicators to evaluate and compare the machine learning models. The
number of Indian cities in the dataset is 23 [8]. There are various regression metrics to evaluate the model’s
performance which are Mean Absolute Percentage Error (MAPE), Mean Absolute Error (MAE), and Root Mean
Square Error (RMSE) therefore they are used to evaluate the performance. After evaluating the model’s
performance using these regression metrics, it is found that the ensemble ML technique employed in the study can
accurately predict the AQI [9]. One of the ensemble machine learning algorithms used for AQI forecasting is Sparse
Spectrum GPR (SSGPR). The evaluation metrics show that ensemble machine learning works effectively in
forecasting the AQI [10].
The three different approaches used are CatBoost Regression, Support Vector Regression, and Random Forest for
the AQI prediction. The Random Forest method outperformed the others based on the RMSE value. The datasets
with the SMOTE algorithm applied produced better results [11]. The hyperparameter kernel as a radial basis in the
SVM model successfully predicted the hourly pollutant concentrations and the associated hourly AQI levels in
California [12]. To forecast the PM2.5 AQI for the following day, a trained XGBoost model has been used to create
an intuitive online application [13]. Various graphs visualize data on a weekly and monthly basis, that show
temperature, humidity, and AQI [14]. In Iran, after relevant research, it was found that the effect of the air quality
index on the well-being of people and being hospitalized was found to be higher in the warm season than in winter
[15, 16]. To determine the AQI levels in metropolitan cities, a blend of a support vector machine and a Long short-
term memory algorithm was used, and it predicted accurately [17, 18, 19].
3. Data Sets
Two datasets have been utilized: one for air quality prediction and the other for advising both healthy individuals
and those who are ill to take precautions. The dataset (DATA1) which predicts the AQI level is made available by
the web portal (https://waqi.info/), which has datasets for every city, data has been taken from four regions R.K.
Puram Delhi, Sanjay Nagar Ghaziabad, Talkatora Lucknow, and Knowledge Park - III Greater Noida. We have
made the second (DATA2) dataset by collecting information from various web portals, which contain information
about the precautions to be taken when air quality is high or low and how it affects human health. To predict the AQI
in real time, the data comes from the same website by calling its API. The dataset was gathered over years, from
January 2014 to April 2024, and is freely accessible. The dataset consists of 3717 daily observations of the estimated
AQI and additional pollutants from R.K. Puram, Delhi, 3535 from Sanjay Nagar, Ghaziabad, 3535 from Talkatora,
Lucknow, and 3535 from Knowledge Park - III, Greater Noida are included in the dataset. The dataset contains 7
environmental pollutants: CO, PM10, NO2, PM 2.5, SO2, NH3, and O3. The other dataset contains 199 rows and 4
columns, which include AQI, Health consequences, General population, and vulnerable population.
4. Methodology
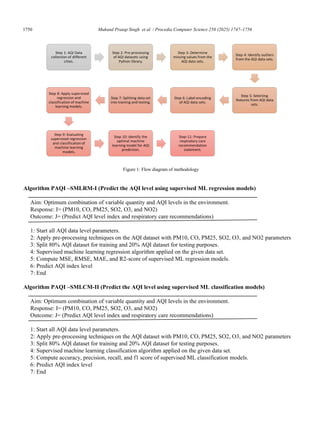
In this section, the flow diagram for AQI prediction is explained in detail. There are five major steps for
this research: input dataset, dataset pre-processing, feature selection, machine learning prediction, and performance
evaluation. The most effective model for AQI prediction has been proposed in this study using five different models,
each of which is briefly explained. The precautionary measures are identified by applying the decision tree
algorithm. Fig. 1 shows an outline of the methodology of this research. The following steps were followed for this
study:
4.
1750 Mukund PratapSingh et al. / Procedia Computer Science 258 (2025) 1747–1756
4 Author name / Procedia Computer Science 00 (2025) 000–000
Algorithm PAQI –SMLRM-I (Predict the AQI level using supervised ML regression models)
Aim: Optimum combination of variable quantity and AQI levels in the environment.
Response: I= (PM10, CO, PM25, SO2, O3, and NO2)
Outcome: J= (Predict AQI level index and respiratory care recommendations)
1: Start all AQI data level parameters.
2: Apply pre-processing techniques on the AQI dataset with PM10, CO, PM25, SO2, O3, and NO2 parameters
3: Split 80% AQI dataset for training and 20% AQI dataset for testing purposes.
4: Supervised machine learning regression algorithm applied on the given data set.
5: Compute MSE, RMSE, MAE, and R2-score of supervised ML regression models.
6: Predict AQI index level
7: End
Algorithm PAQI –SMLCM-II (Predict the AQI level using supervised ML classification models)
Aim: Optimum combination of variable quantity and AQI levels in the environment.
Response: I= (PM10, CO, PM25, SO2, O3, and NO2)
Outcome: J= (Predict AQI level index and respiratory care recommendations)
1: Start all AQI data level parameters.
2: Apply pre-processing techniques on the AQI dataset with PM10, CO, PM25, SO2, O3, and NO2 parameters
3: Split 80% AQI dataset for training and 20% AQI dataset for testing purposes.
4: Supervised machine learning classification algorithm applied on the given data set.
5: Compute accuracy, precision, recall, and f1 score of supervised ML classification models.
6: Predict AQI index level
7: End
Figure 1: Flow diagram of methodology
5.
Mukund Pratap Singhet al. / Procedia Computer Science 258 (2025) 1747–1756 1751
Author name / Procedia Computer Science 00 (2025) 000–000 5
4.1 Preprocessing of AQI data sets
The raw data was first cleaned by removing any unusual points that were very different from the rest or filling in
the missing values to train the model on the data accurately. It was then organized and prepared for making accurate
predictions using machine learning models. The basic steps followed during the data preprocessing are handling the
missing data or information in the dataset, detecting and dealing with the unusual data points, making sure that the
data fits in a common scale so that everything can be fairly compared through standardization, and choosing the best
features for making predictions, a process known as feature engineering. All the NaN values were removed,
ensuring that the model was properly trained and that there were no issues with AQI prediction. Complete case
analysis (CCA), which involves removing the rows completely that consist of null or missing values. Since the
number of missing values was minimal, opting for the removal of null values proved to be a superior approach,
enhancing the accuracy of predictions. The outliers or the unusual data points in the dataset might affect the
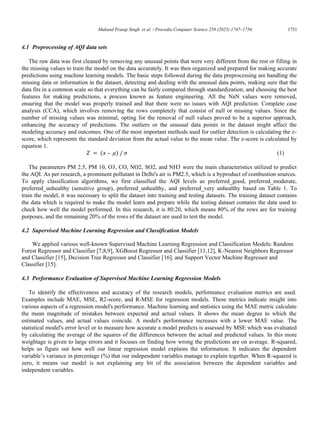
modeling accuracy and outcomes. One of the most important methods used for outlier detection is calculating the z-
score, which represents the standard deviation from the actual value to the mean value. The z-score is calculated by
equation 1.
𝑍𝑍 = (𝑥𝑥 – 𝜇𝜇) / 𝜎𝜎 (1)
The parameters PM 2.5, PM 10, O3, CO, NO2, SO2, and NH3 were the main characteristics utilized to predict
the AQI. As per research, a prominent pollutant in Delhi's air is PM2.5, which is a byproduct of combustion sources.
To apply classification algorithms, we first classified the AQI levels as preferred_good, preferred_moderate,
preferred_unhealthy (sensitive group), preferred_unhealthy, and preferred_very unhealthy based on Table 1. To
train the model, it was necessary to split the dataset into training and testing datasets. The training dataset contains
the data which is required to make the model learn and prepare while the testing dataset contains the data used to
check how well the model performed. In this research, it is 80:20, which means 80% of the rows are for training
purposes, and the remaining 20% of the rows of the dataset are used to test the model.
4.2 Supervised Machine Learning Regression and Classification Models
We applied various well-known Supervised Machine Learning Regression and Classification Models: Random
Forest Regressor and Classifier [7,8,9], XGBoost Regressor and Classifier [11,12], K-Nearest Neighbors Regressor
and Classifier [15], Decision Tree Regressor and Classifier [16], and Support Vector Machine Regressor and
Classifier [15].
4.3 Performance Evaluation of Supervised Machine Learning Regression Models
To identify the effectiveness and accuracy of the research models, performance evaluation metrics are used.
Examples include MAE, MSE, R2-score, and R-MSE for regression models. These metrics indicate insight into
various aspects of a regression model's performance. Machine learning and statistics using the MAE metric calculate
the mean magnitude of mistakes between expected and actual values. It shows the mean degree to which the
estimated values, and actual values coincide. A model's performance increases with a lower MAE value. The
statistical model's error level or to measure how accurate a model predicts is assessed by MSE which was evaluated
by calculating the average of the squares of the differences between the actual and predicted values. In this more
weightage is given to large errors and it focuses on finding how wrong the predictions are on average. R-squared,
helps us figure out how well our linear regression model explains the information. It indicates the dependent
variable’s variance in percentage (%) that our independent variables manage to explain together. When R-squared is
zero, it means our model is not explaining any bit of the association between the dependent variables and
independent variables.
6.
1752 Mukund PratapSingh et al. / Procedia Computer Science 258 (2025) 1747–1756
6 Author name / Procedia Computer Science 00 (2025) 000–000
4.4 Performance Evaluation of Supervised Machine Learning Classification Models
The model produces four instances produced by the test data which are: False Negative (FN) This happens when
the model indicates that something does not exist, but it exists. False Positive (FP): A situation in which the model
postulates or proposes that something is there when in fact it is not. True Positive (TP): When the model predicts
that something exists, and it exists. True Negative (TN): That means when the model correctly predicts that what it
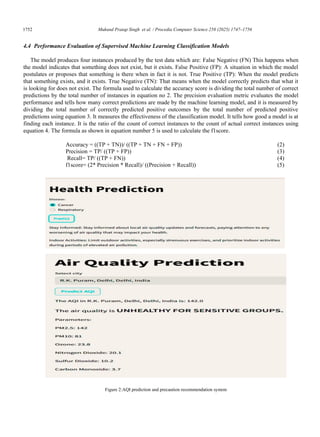
is looking for does not exist. The formula used to calculate the accuracy score is dividing the total number of correct
predictions by the total number of instances in equation no 2. The precision evaluation metric evaluates the model
performance and tells how many correct predictions are made by the machine learning model, and it is measured by
dividing the total number of correctly predicted positive outcomes by the total number of predicted positive
predictions using equation 3. It measures the effectiveness of the classification model. It tells how good a model is at
finding each instance. It is the ratio of the count of correct instances to the count of actual correct instances using
equation 4. The formula as shown in equation number 5 is used to calculate the f1score.
Accuracy = ((TP + TN))/ ((TP + TN + FN + FP)) (2)
Precision = TP/ ((TP + FP)) (3)
Recall= TP/ ((TP + FN)) (4)
f1score= (2* Precision * Recall)/ ((Precision + Recall)) (5)
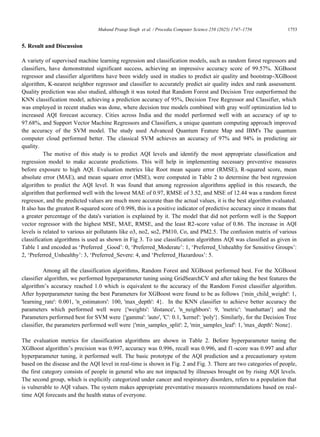
Figure 2:AQI prediction and precaution recommendation system
7.
Mukund Pratap Singhet al. / Procedia Computer Science 258 (2025) 1747–1756 1753
Author name / Procedia Computer Science 00 (2025) 000–000 7
5. Result and Discussion
A variety of supervised machine learning regression and classification models, such as random forest regressors and
classifiers, have demonstrated significant success, achieving an impressive accuracy score of 99.57%. XGBoost
regressor and classifier algorithms have been widely used in studies to predict air quality and bootstrap-XGBoost
algorithm, K-nearest neighbor regressor and classifier to accurately predict air quality index and rank assessment.
Quality prediction was also studied, although it was noted that Random Forest and Decision Tree outperformed the
KNN classification model, achieving a prediction accuracy of 95%, Decision Tree Regressor and Classifier, which
was employed in recent studies was done, where decision tree models combined with gray wolf optimization led to
increased AQI forecast accuracy. Cities across India and the model performed well with an accuracy of up to
97.68%, and Support Vector Machine Regressors and Classifiers, a unique quantum computing approach improved
the accuracy of the SVM model. The study used Advanced Quantum Feature Map and IBM's The quantum
computer cloud performed better. The classical SVM achieves an accuracy of 97% and 94% in predicting air
quality.
The motive of this study is to predict AQI levels and identify the most appropriate classification and
regression model to make accurate predictions. This will help in implementing necessary preventive measures
before exposure to high AQI. Evaluation metrics like Root mean square error (RMSE), R-squared score, mean
absolute error (MAE), and mean square error (MSE), were computed in Table 2 to determine the best regression
algorithm to predict the AQI level. It was found that among regression algorithms applied in this research, the
algorithm that performed well with the lowest MAE of 0.97, RMSE of 3.52, and MSE of 12.44 was a random forest
regressor, and the predicted values are much more accurate than the actual values, it is the best algorithm evaluated.
It also has the greatest R-squared score of 0.998, this is a positive indicator of predictive accuracy since it means that
a greater percentage of the data's variation is explained by it. The model that did not perform well is the Support
vector regressor with the highest MSE, MAE, RMSE, and the least R2-score value of 0.86. The increase in AQI
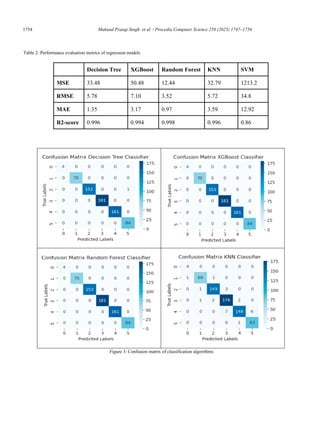
levels is related to various air pollutants like o3, no2, so2, PM10, Co, and PM2.5. The confusion matrix of various
classification algorithms is used as shown in Fig 3. To use classification algorithms AQI was classified as given in
Table 1 and encoded as ‘Preferred _Good’: 0, ‘Preferred_Moderate’: 1, ‘Preferred_Unhealthy for Sensitive Groups’:
2, ‘Preferred_Unhealthy’: 3, ‘Preferred_Severe: 4, and ‘Preferred_Hazardous’: 5.
Among all the classification algorithms, Random Forest and XGBoost performed best. For the XGBoost
classifier algorithm, we performed hyperparameter tuning using GridSearchCV and after taking the best features the
algorithm’s accuracy reached 1.0 which is equivalent to the accuracy of the Random Forest classifier algorithm.
After hyperparameter tuning the best Parameters for XGBoost were found to be as follows {'min_child_weight': 1,
'learning_rate': 0.001, 'n_estimators': 100, 'max_depth': 4}. In the KNN classifier to achieve better accuracy the
parameters which performed well were {'weights': 'distance', 'n_neighbors': 9, 'metric': 'manhattan'} and the
Parameters performed best for SVM were {'gamma': 'auto', 'C': 0.1, 'kernel': 'poly'}. Similarly, for the Decision Tree
classifier, the parameters performed well were {'min_samples_split': 2, 'min_samples_leaf': 1, 'max_depth': None}.
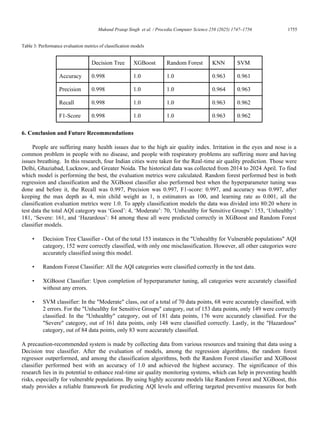
The evaluation metrics for classification algorithms are shown in Table 2. Before hyperparameter tuning the
XGBoost algorithm’s precision was 0.997, accuracy was 0.996, recall was 0.996, and f1-score was 0.997 and after
hyperparameter tuning, it performed well. The basic prototype of the AQI prediction and a precautionary system
based on the disease and the AQI level in real-time is shown in Fig. 2 and Fig. 3. There are two categories of people,
the first category consists of people in general who are not impacted by illnesses brought on by rising AQI levels.
The second group, which is explicitly categorized under cancer and respiratory disorders, refers to a population that
is vulnerable to AQI values. The system makes appropriate preventative measures recommendations based on real-
time AQI forecasts and the health status of everyone.
8.
1754 Mukund PratapSingh et al. / Procedia Computer Science 258 (2025) 1747–1756
8 Author name / Procedia Computer Science 00 (2025) 000–000
Table 2: Performance evaluation metrics of regression models
Decision Tree XGBoost Random Forest KNN SVM
MSE 33.48 50.48 12.44 32.79 1213.2
RMSE 5.78 7.10 3.52 5.72 34.8
MAE 1.35 3.17 0.97 3.59 12.92
R2-score 0.996 0.994 0.998 0.996 0.86
Figure 3: Confusion matrix of classification algorithms
9.
Mukund Pratap Singhet al. / Procedia Computer Science 258 (2025) 1747–1756 1755
Author name / Procedia Computer Science 00 (2025) 000–000 9
Table 3: Performance evaluation metrics of classification models
Decision Tree XGBoost Random Forest KNN SVM
Accuracy 0.998 1.0 1.0 0.963 0.961
Precision 0.998 1.0 1.0 0.964 0.963
Recall 0.998 1.0 1.0 0.963 0.962
F1-Score 0.998 1.0 1.0 0.963 0.962
6. Conclusion and Future Recommendations
People are suffering many health issues due to the high air quality index. Irritation in the eyes and nose is a
common problem in people with no disease, and people with respiratory problems are suffering more and having
issues breathing. In this research, four Indian cities were taken for the Real-time air quality prediction. Those were
Delhi, Ghaziabad, Lucknow, and Greater Noida. The historical data was collected from 2014 to 2024 April. To find
which model is performing the best, the evaluation metrics were calculated. Random forest performed best in both
regression and classification and the XGBoost classifier also performed best when the hyperparameter tuning was
done and before it, the Recall was 0.997, Precision was 0.997, F1-score: 0.997, and accuracy was 0.997, after
keeping the max depth as 4, min child weight as 1, n estimators as 100, and learning rate as 0.001, all the
classification evaluation metrics were 1.0. To apply classification models the data was divided into 80:20 where in
test data the total AQI category was ‘Good’: 4, ‘Moderate’: 70, ‘Unhealthy for Sensitive Groups’: 153, ‘Unhealthy’:
181, ‘Severe: 161, and ‘Hazardous’: 84 among these all were predicted correctly in XGBoost and Random Forest
classifier models.
• Decision Tree Classifier - Out of the total 153 instances in the Unhealthy for Vulnerable populations AQI
category, 152 were correctly classified, with only one misclassification. However, all other categories were
accurately classified using this model.
• Random Forest Classifier: All the AQI categories were classified correctly in the test data.
• XGBoost Classifier: Upon completion of hyperparameter tuning, all categories were accurately classified
without any errors.
• SVM classifier: In the Moderate class, out of a total of 70 data points, 68 were accurately classified, with
2 errors. For the Unhealthy for Sensitive Groups category, out of 153 data points, only 149 were correctly
classified. In the Unhealthy category, out of 181 data points, 176 were accurately classified. For the
Severe category, out of 161 data points, only 148 were classified correctly. Lastly, in the Hazardous
category, out of 84 data points, only 83 were accurately classified.
A precaution-recommended system is made by collecting data from various resources and training that data using a
Decision tree classifier. After the evaluation of models, among the regression algorithms, the random forest
regressor outperformed, and among the classification algorithms, both the Random Forest classifier and XGBoost
classifier performed best with an accuracy of 1.0 and achieved the highest accuracy. The significance of this
research lies in its potential to enhance real-time air quality monitoring systems, which can help in preventing health
risks, especially for vulnerable populations. By using highly accurate models like Random Forest and XGBoost, this
study provides a reliable framework for predicting AQI levels and offering targeted preventive measures for both
10.
1756 Mukund PratapSingh et al. / Procedia Computer Science 258 (2025) 1747–1756
10 Author name / Procedia Computer Science 00 (2025) 000–000
healthy individuals and those with pre-existing respiratory conditions. These findings contribute to improving public
health responses to deteriorating air quality, enabling timely interventions to reduce exposure to harmful pollutants.
References
[1] Almaliki, A.H., Derdour, A. and Ali, E., 2023. Air Quality Index (AQI) Prediction in Holy Makkah Based on Machine Learning
Methods. Sustainability, 15(17), p.13168.
[2] Castelli, M., Clemente, F.M., Popovič, A., Silva, S. and Vanneschi, L., 2020. A machine learning approach to predict air quality in
California. Complexity, 2020.
[3] Chaturvedi, P., 2024. Air Quality Prediction System Using Machine Learning Models. Water, Air, Soil Pollution, 235(9), p.578.
[4] Farooq, O., Shahid, M., Arshad, S., Altaf, A., Iqbal, F., Vera, Y.A.M., Flores, M.A.L. and Ashraf, I., 2024. An enhanced approach for
predicting air pollution using quantum support vector machine. Scientific Reports, 14(1), p.19521.
[5] George, P.E., Thakkar, N., Yasobant, S., Saxena, D. and Shah, J., 2024. Impact of ambient air pollution and socio-environmental
factors on the health of children younger than 5 years in India: a population-based analysis. The Lancet Regional Health-Southeast
Asia, 20.
[6] Gupta, N.S., Mohta, Y., Heda, K., Armaan, R., Valarmathi, B. and Arulkumaran, G., 2023. Prediction of Air Quality Index Using
Machine Learning Techniques: A Comparative Analysis. Journal of Environmental and Public Health, 2023.
[7] Hardini, M., Sunarjo, R.A., Asfi, M., Chakim, M.H.R. and Sanjaya, Y.P.A., 2023. Predicting Air Quality Index using Ensemble
Machine Learning. ADI Journal on Recent Innovation, 5(1Sp), pp.78-86.
[8] Hardini, M., Sunarjo, R.A., Asfi, M., Chakim, M.H.R. and Sanjaya, Y.P.A., 2023. Predicting air quality index using ensemble
machine learning. ADI Journal on Recent Innovation, 5(1Sp), pp.78-86.
[9] Ketu, S., 2022. Spatial Air Quality Index and Air Pollutant Concentration prediction using Linear Regression based Recursive Feature
Elimination with Random Forest Regression (RFERF): a case study in India. Natural Hazards, 114(2), pp.2109-2138.
[10] Kumar, K. and Pande, B.P., 2023. Air pollution prediction with machine learning: a case study of Indian cities. International Journal
of Environmental Science and Technology, 20(5), pp.5333-5348.
[11] Leili, M., Nadali, A., Karami, M., Bahrami, A. and Afkhami, A., 2021. Short-term effect of multi-pollutant air quality indexes and
PM2. 5 on cardiovascular hospitalization in Hamadan, Iran: a time-series analysis. Environmental Science and Pollution Research,
28(38), pp.53653-53667.
[12] Liu, H., Li, Q., Yu, D. and Gu, Y., 2019. Air quality index and air pollutant concentration prediction based on machine learning
algorithms. Applied Sciences, 9(19), p.4069.
[13] Liu, H., Li, Q., Yu, D. and Gu, Y., 2019. Air quality index and air pollutant concentration prediction based on machine learning
algorithms. Applied sciences, 9(19), p.4069.
[14] Mallegowda, M., Kanavalli, A., Verma, Y., Vamsi, S.J.K., Mukesh, T. and Saxena, V., 2021. Prediction of air quality index using
machine data learning on atmospheric. NVEO-NATURAL VOLATILES ESSENTIAL OILS Journal| NVEO, pp.7544-7552.
[15] Maltare, N.N. and Vahora, S., 2023. Air Quality Index prediction using machine learning for Ahmedabad city. Digital Chemical
Engineering, 7, p.100093.
[16] Natarajan, S.K., Shanmurthy, P., Arockiam, D., Balusamy, B. and Selvarajan, S., 2024. Optimized machine learning model for air
quality index prediction in major cities in India. Scientific Reports, 14(1), p.6795.
[17] Van, N.H., Van Thanh, P., Tran, D.N. and Tran, D.T., 2023. A new model of air quality prediction using lightweight machine learning.
International Journal of Environmental Science and Technology, 20(3), pp.2983-2994.
[18] Walia, A., Paliwal, A., Patidar, S. and Mahto, R., 2024, June. Prediction of Air Quality Index Using Random Forest and Prophet Tool.
In 2024 19th Annual System of Systems Engineering Conference (SoSE) (pp. 275-280). IEEE.
[19] Yang, J., Tian, Y. and Wu, C.H., 2024. Air Quality Prediction and Ranking Assessment Based on Bootstrap-XGBoost Algorithm and
Ordinal Classification Models. Atmosphere, 15(8), p.925.