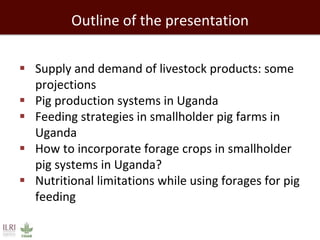
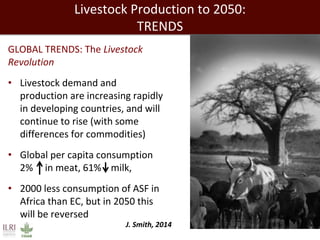
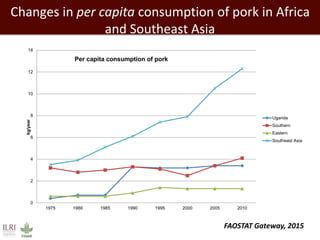
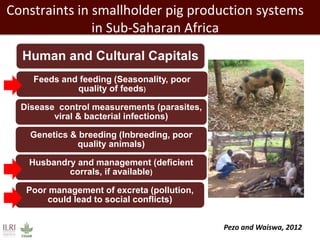
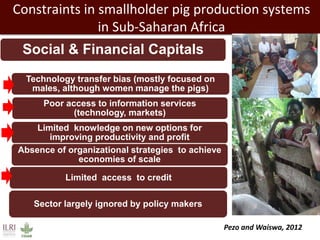
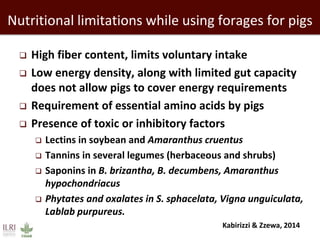
Forage needs in pig value chains: The Ugandan case
Danilo Pezo
Workshop on forage and fodder tree selection for future challenges —
Linking genebanks to forage use, Addis Ababa, 16-20 March 2015
Outline of the presentation
 Supply and demand of livestock products: some
projections
 Pig production systems in Uganda
 Feeding strategies in smallholder pig farms in
Uganda
 How to incorporate forage crops in smallholder
pig systems in Uganda?
 Nutritional limitations while using forages for pig
feeding
Livestock Production to 2050:
TRENDS
GLOBAL TRENDS: The Livestock
Revolution
• Livestock demand and
production are increasing rapidly
in developing countries, and will
continue to rise (with some
differences for commodities)
• Global per capita consumption
2% in meat, 61% milk,
• 2000 less consumption of ASF in
Africa than EC, but in 2050 this
will be reversed
J. Smith, 2014
Changes in per capita consumption of pork in Africa
and Southeast Asia
FAOSTAT Gateway, 2015
0
2
4
6
8
10
12
14
1975 1980 1985 1990 1995 2000 2005 2010
kg/year
Per capita consumption of pork
Uganda
Southern
Eastern
Southeast Asia
% change in consumption of animal products:
2000–2030
0
50
100
150
200
250
300
Milk Beef Mutton Pork Poultry
meat
Eggs
China
Russia
Brazil
India
SSA
High income
843%
%
J. Smith, 2014
Projections of livestock production increases at global
level: 2000–2050
 In half a century, total livestock
commodity production is
projected to increase by 92%:
 + 106% for monogastric meat
(pig and poultry) and poultry
eggs
 + 88% for ruminant meat (cow,
sheep, goat, camel, water
buffalo)
 + 85% for milk
 With large regional differences
Herrero et al. 2014
Changes in cattle and pig population in Africa
0
50
100
150
200
250
300
350
1980 1985 1990 1995 2000 2005 2010
Milions
Cattle population
Eastern Africa Africa
0
5
10
15
20
25
30
35
1980 1985 1990 1995 2000 2005 2010
Millions
Pig population
Eastern Africa Africa
FAOSTAT Gateway, 2015
% change in production of animal products:
2000–2030
0
50
100
150
200
250
300
Milk Beef Mutton Pork Poultry
meat
Eggs
China
Russia
Brazil
India
SSA
High income
%
J. Smith, 2014
Monogastric production systems in Africa
are in rapid transition to industrial
0%
10%
20%
30%
40%
50%
60%
70%
80%
90%
100%
2000 2050 2000 2050 2000 2050
smallholder
industrial
Europe Latin America Africa/Middle East
Herrero et al. 2014
Over 30% of African
monogastric
production will still be
smallholder in 2050
Trajectories of growth for the livestock sector
Strong growth
Intensifying and making
increasingly market
oriented, often
transforming smallholder
systems
Fragile growth
Where remoteness,
marginal land resources or
agro climatic vulnerability
restricts intensification
High growth
with externalities
Intensified livestock
systems with diverse
challenges, including
the environment and
human health
J. Smith, 2014
Farm
Systems:
Breeding
Growing/Fattening
Inputs and
Services
Pig breeder
Vet / Animal Prod
extension services
Agrovet / feed shop
owners
Feed manufacturers
and suppliers
Transporters of inputs
Post-farm
Live-pig traders
Transporters
Slaughterers
Pork Butchers
Pork processors-
large and medium
Supermarkets/
restaurants
Consumers
Actors in a typical pork value chain
Constraints in smallholder pig production systems
in Sub-Saharan Africa
Feeds and feeding (Seasonality, poor
quality of feeds)
Disease control measurements (parasites,
viral & bacterial infections)
Genetics & breeding (Inbreeding, poor
quality animals)
Husbandry and management (deficient
corrals, if available)
Poor management of excreta (pollution,
could lead to social conflicts)
Human and Cultural Capitals
Pezo and Waiswa, 2012
Constraints in smallholder pig production systems
in Sub-Saharan Africa
Technology transfer bias (mostly focused on
males, although women manage the pigs)
Limited knowledge on new options for
improving productivity and profit
Poor access to information services
(technology, markets)
Absence of organizational strategies to achieve
economies of scale
Sector largely ignored by policy makers
Limited access to credit
Social & Financial Capitals
Pezo and Waiswa, 2012
Management Systems
Semi-intensive/Intensive**
Tethered
Scavenging
Opportunitiesforplanted
forages
**In large scale intensive (industrial) systems MAY BE NOT
Type of management, as a function of value chain
domain in three districts of Uganda
Pig management
Rural – rural
(n = 170)
Rural-
urban
(n = 90)
Urban-
urban
(n = 80)
Tethering 66 40 13
Housed
Housed raised
floor 5 6 25
Housed not
raised floor 16 37 61
Free-range/Scavenging 17 18 1
Ouma et al, 2014
Feeding Strategies - Seasonality
Relative availability of feeds along the year in smallholder
pig farms in Mukono
Ouma et al, 2014
Feeding Strategies - Diversity
Types of feeds used in different periods of the year in Kamuli
Ouma et al, 2014
Use of fodder sources in smallholder pig systems in
Uganda, as a function of VC domain
0
10
20
30
40
50
60
Amaranthus Banana peels Cassava leaves Elephant grass Fruit peels Other grasses Sweet potato
vines
Yam leaves
RR
RU
UU
and weeds
ILRI/SPVCD, unpublished data
Use of fodder sources in smallholder pig systems in
Uganda, as a function of animal category
ILRI/SPVCD, unpublished data
Labor distribution for feed collection
Pezo et al, 2014
How to incorporate forage crops in smallholder
pig systems in Uganda?
 Planting forages – Limited land
(Rural: 1.4 – 3.3 acres; Urban: 1.4 – 1.8 acres;
most don’t have area dedicated to forages)
Forages have to be inter-cropped or
as hedgerows
 For what group of animals?
• Breeding stock, less for growers, &
fatteners
• NOT for piglets and weaners (limited
intake and fiber digestion capacity)
 Which forages should we focus?
Those with at least similar quality than the
crop residues commonly used. Those able to
produce when crop residues are not available.
Nutritive value of crop residues used for feeding pigs
Fraction/
Nutrient
Sweet potato
vines*
Cassava
leaves*
Cocoyam
leaves*
Amaranthus
spp.**
CP, % 16.5 24.9 24.4 19.9
DE, MJ kg-1
DM
12.7 12.4 10.4 11.3
Ca, g/kg-1 9.5 11.9 3.3 3.2
P, g/kg-1 2.9 3.7 5.6 2.5
Methionine,
% CP
1.1 1.0 ? ?
Lysine, % CP 3.6 ? ? ?
Anti-quality
factor
Tannins, anti-
trypsin factor
Hydrocyanic
glucoside
Oxalate saponins
*Feedipedia, 2015; **ILRI/SPVCD unpublished data
Nutritive value of some legumes for feeding pigs
Species
CP
%
Tannins
g kg-1 DM
Lysine
g kg-1 DM
Methionine
g kg-1 DM
Degradability
%
Cratylia
argentea
25.7 7.6 14.3 4.2 38.6
Leucaena
diversifolia
23.6 49.4 13.2 3.7 41.9
Clitoria
ternatea
19.0 5.0 8.4 2.9 --**
Lablab
purpureus
20.3 7.8 8.5 2.6 --**
Vigna
unguiculata
24.3 1.8 8.5 2.5 52.1
Heinritz et al., 2012
** Not available, but could be around 50%
Other tropical forages evaluated for pig feeding
 Trichantera gigantea (Ly et al., 2001; Leterme et al., 2005)
 Morus alba (Leterme et al., 2005; Chiv Phiny et al., 2003; Chiv
Phiny et al., 2010; Ty Chhay et al., 2010; Ly & Pok Samkol,
2014
 Desmanthus virgatus (Ly & Pok Samkol, 2001)
 D. velutinum, F. macrophylla, Cannavalia brasiliensis,
Centrosema brasilianum, S. guyanensis (Heinritz et al., 2012)
Nutritional limitations while using forages for pigs
 High fiber content, limits voluntary intake
 Low energy density, along with limited gut capacity
does not allow pigs to cover energy requirements
 Requirement of essential amino acids by pigs
 Presence of toxic or inhibitory factors
 Lectins in soybean and Amaranthus cruentus
 Tannins in several legumes (herbaceous and shrubs)
 Saponins in B. brizantha, B. decumbens, Amaranthus
hypochondriacus
 Phytates and oxalates in S. sphacelata, Vigna unguiculata,
Lablab purpureus.
Kabirizzi & Zzewa, 2014
The presentation has a Creative Commons licence. You are free to re-use or distribute this work, provided credit is
given to ILRI.
better lives through livestock
ilri.org
Thank you!

Forage needs in pig value chains: The Ugandan case

  • 1.
    Forage needs inpig value chains: The Ugandan case Danilo Pezo Workshop on forage and fodder tree selection for future challenges — Linking genebanks to forage use, Addis Ababa, 16-20 March 2015
  • 2.
    Outline of thepresentation  Supply and demand of livestock products: some projections  Pig production systems in Uganda  Feeding strategies in smallholder pig farms in Uganda  How to incorporate forage crops in smallholder pig systems in Uganda?  Nutritional limitations while using forages for pig feeding
  • 3.
    Livestock Production to2050: TRENDS GLOBAL TRENDS: The Livestock Revolution • Livestock demand and production are increasing rapidly in developing countries, and will continue to rise (with some differences for commodities) • Global per capita consumption 2% in meat, 61% milk, • 2000 less consumption of ASF in Africa than EC, but in 2050 this will be reversed J. Smith, 2014
  • 4.
    Changes in percapita consumption of pork in Africa and Southeast Asia FAOSTAT Gateway, 2015 0 2 4 6 8 10 12 14 1975 1980 1985 1990 1995 2000 2005 2010 kg/year Per capita consumption of pork Uganda Southern Eastern Southeast Asia
  • 5.
    % change inconsumption of animal products: 2000–2030 0 50 100 150 200 250 300 Milk Beef Mutton Pork Poultry meat Eggs China Russia Brazil India SSA High income 843% % J. Smith, 2014
  • 6.
    Projections of livestockproduction increases at global level: 2000–2050  In half a century, total livestock commodity production is projected to increase by 92%:  + 106% for monogastric meat (pig and poultry) and poultry eggs  + 88% for ruminant meat (cow, sheep, goat, camel, water buffalo)  + 85% for milk  With large regional differences Herrero et al. 2014
  • 7.
    Changes in cattleand pig population in Africa 0 50 100 150 200 250 300 350 1980 1985 1990 1995 2000 2005 2010 Milions Cattle population Eastern Africa Africa 0 5 10 15 20 25 30 35 1980 1985 1990 1995 2000 2005 2010 Millions Pig population Eastern Africa Africa FAOSTAT Gateway, 2015
  • 8.
    % change inproduction of animal products: 2000–2030 0 50 100 150 200 250 300 Milk Beef Mutton Pork Poultry meat Eggs China Russia Brazil India SSA High income % J. Smith, 2014
  • 9.
    Monogastric production systemsin Africa are in rapid transition to industrial 0% 10% 20% 30% 40% 50% 60% 70% 80% 90% 100% 2000 2050 2000 2050 2000 2050 smallholder industrial Europe Latin America Africa/Middle East Herrero et al. 2014 Over 30% of African monogastric production will still be smallholder in 2050
  • 10.
    Trajectories of growthfor the livestock sector Strong growth Intensifying and making increasingly market oriented, often transforming smallholder systems Fragile growth Where remoteness, marginal land resources or agro climatic vulnerability restricts intensification High growth with externalities Intensified livestock systems with diverse challenges, including the environment and human health J. Smith, 2014
  • 11.
    Farm Systems: Breeding Growing/Fattening Inputs and Services Pig breeder Vet/ Animal Prod extension services Agrovet / feed shop owners Feed manufacturers and suppliers Transporters of inputs Post-farm Live-pig traders Transporters Slaughterers Pork Butchers Pork processors- large and medium Supermarkets/ restaurants Consumers Actors in a typical pork value chain
  • 12.
    Constraints in smallholderpig production systems in Sub-Saharan Africa Feeds and feeding (Seasonality, poor quality of feeds) Disease control measurements (parasites, viral & bacterial infections) Genetics & breeding (Inbreeding, poor quality animals) Husbandry and management (deficient corrals, if available) Poor management of excreta (pollution, could lead to social conflicts) Human and Cultural Capitals Pezo and Waiswa, 2012
  • 13.
    Constraints in smallholderpig production systems in Sub-Saharan Africa Technology transfer bias (mostly focused on males, although women manage the pigs) Limited knowledge on new options for improving productivity and profit Poor access to information services (technology, markets) Absence of organizational strategies to achieve economies of scale Sector largely ignored by policy makers Limited access to credit Social & Financial Capitals Pezo and Waiswa, 2012
  • 14.
  • 15.
    Type of management,as a function of value chain domain in three districts of Uganda Pig management Rural – rural (n = 170) Rural- urban (n = 90) Urban- urban (n = 80) Tethering 66 40 13 Housed Housed raised floor 5 6 25 Housed not raised floor 16 37 61 Free-range/Scavenging 17 18 1 Ouma et al, 2014
  • 16.
    Feeding Strategies -Seasonality Relative availability of feeds along the year in smallholder pig farms in Mukono Ouma et al, 2014
  • 17.
    Feeding Strategies -Diversity Types of feeds used in different periods of the year in Kamuli Ouma et al, 2014
  • 18.
    Use of foddersources in smallholder pig systems in Uganda, as a function of VC domain 0 10 20 30 40 50 60 Amaranthus Banana peels Cassava leaves Elephant grass Fruit peels Other grasses Sweet potato vines Yam leaves RR RU UU and weeds ILRI/SPVCD, unpublished data
  • 19.
    Use of foddersources in smallholder pig systems in Uganda, as a function of animal category ILRI/SPVCD, unpublished data
  • 20.
    Labor distribution forfeed collection Pezo et al, 2014
  • 21.
    How to incorporateforage crops in smallholder pig systems in Uganda?  Planting forages – Limited land (Rural: 1.4 – 3.3 acres; Urban: 1.4 – 1.8 acres; most don’t have area dedicated to forages) Forages have to be inter-cropped or as hedgerows  For what group of animals? • Breeding stock, less for growers, & fatteners • NOT for piglets and weaners (limited intake and fiber digestion capacity)  Which forages should we focus? Those with at least similar quality than the crop residues commonly used. Those able to produce when crop residues are not available.
  • 22.
    Nutritive value ofcrop residues used for feeding pigs Fraction/ Nutrient Sweet potato vines* Cassava leaves* Cocoyam leaves* Amaranthus spp.** CP, % 16.5 24.9 24.4 19.9 DE, MJ kg-1 DM 12.7 12.4 10.4 11.3 Ca, g/kg-1 9.5 11.9 3.3 3.2 P, g/kg-1 2.9 3.7 5.6 2.5 Methionine, % CP 1.1 1.0 ? ? Lysine, % CP 3.6 ? ? ? Anti-quality factor Tannins, anti- trypsin factor Hydrocyanic glucoside Oxalate saponins *Feedipedia, 2015; **ILRI/SPVCD unpublished data
  • 23.
    Nutritive value ofsome legumes for feeding pigs Species CP % Tannins g kg-1 DM Lysine g kg-1 DM Methionine g kg-1 DM Degradability % Cratylia argentea 25.7 7.6 14.3 4.2 38.6 Leucaena diversifolia 23.6 49.4 13.2 3.7 41.9 Clitoria ternatea 19.0 5.0 8.4 2.9 --** Lablab purpureus 20.3 7.8 8.5 2.6 --** Vigna unguiculata 24.3 1.8 8.5 2.5 52.1 Heinritz et al., 2012 ** Not available, but could be around 50%
  • 24.
    Other tropical foragesevaluated for pig feeding  Trichantera gigantea (Ly et al., 2001; Leterme et al., 2005)  Morus alba (Leterme et al., 2005; Chiv Phiny et al., 2003; Chiv Phiny et al., 2010; Ty Chhay et al., 2010; Ly & Pok Samkol, 2014  Desmanthus virgatus (Ly & Pok Samkol, 2001)  D. velutinum, F. macrophylla, Cannavalia brasiliensis, Centrosema brasilianum, S. guyanensis (Heinritz et al., 2012)
  • 25.
    Nutritional limitations whileusing forages for pigs  High fiber content, limits voluntary intake  Low energy density, along with limited gut capacity does not allow pigs to cover energy requirements  Requirement of essential amino acids by pigs  Presence of toxic or inhibitory factors  Lectins in soybean and Amaranthus cruentus  Tannins in several legumes (herbaceous and shrubs)  Saponins in B. brizantha, B. decumbens, Amaranthus hypochondriacus  Phytates and oxalates in S. sphacelata, Vigna unguiculata, Lablab purpureus. Kabirizzi & Zzewa, 2014
  • 26.
    The presentation hasa Creative Commons licence. You are free to re-use or distribute this work, provided credit is given to ILRI. better lives through livestock ilri.org Thank you!