Downloaded 115 times

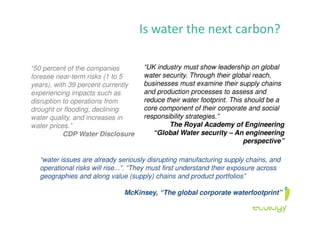

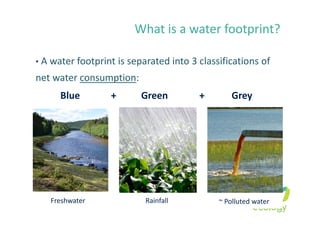
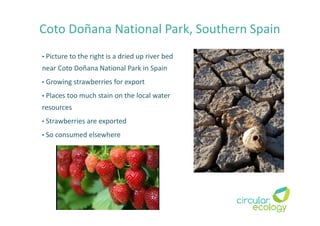
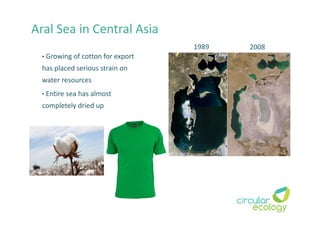
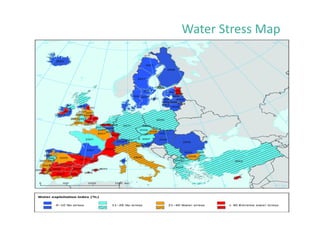
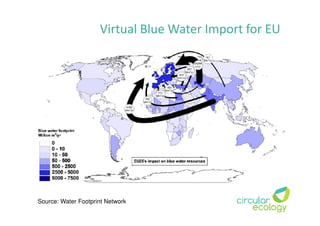
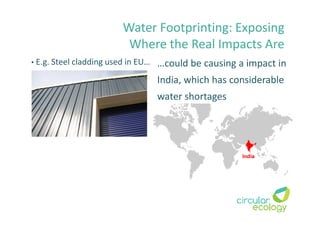
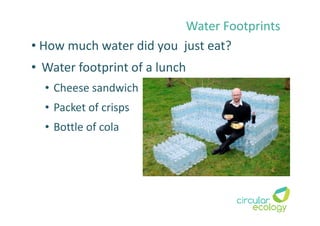
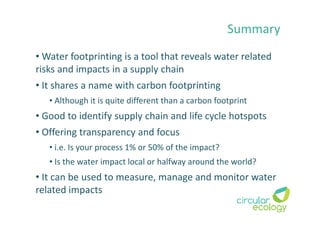

Water footprinting is a tool for assessing water usage and impacts throughout supply chains. It measures direct and indirect water usage in three categories: blue, green, and grey water. Hotspot mapping can identify locations where supply chain activities place unsustainable strain on local water resources, such as growing crops for export in water stressed regions. Water footprinting aims to increase transparency around water usage and impacts across global supply chains to help companies manage risks and reduce their water footprint.


![World Engineers Summit Conf, Singapore July 2015 [Compatibility Mode]](https://cdn.slidesharecdn.com/ss_thumbnails/835472e3-5c33-47b8-a6fc-8a83d67e9eae-151015093255-lva1-app6892-thumbnail.jpg?width=640&height=640&fit=bounds)


