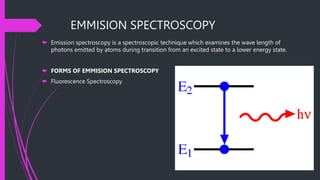
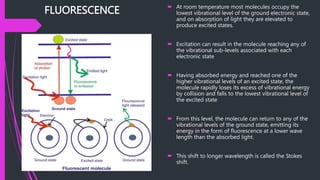
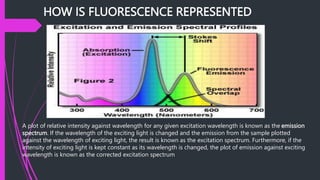
AGENDA
Luminescence
Fluorescence
Principles of Fluorescence Spectroscopy
Instrument for measurement
Application
Case study
Conclusion
EMMISION SPECTROSCOPY
 Emission spectroscopy is a spectroscopic technique which examines the wave length of
photons emitted by atoms during transition from an excited state to a lower energy state.
 FORMS OF EMMISION SPECTROSCOPY
 Fluorescence Spectroscopy
LUMINESENCE / INCANDESCENCE
 A hot body that emits radiation solely because of its high temperature is said to exhibit
incandescence. All other forms of light emission are called luminescence.
 When luminescence occurs, the system loses energy and if the emission is to be continuous, some
form of energy must be supplied from elsewhere
TYPES OF LUMINESCENCE
 1. Radioluminescence emitted from a luminous clock face is supplied by high energy particles from
the radioactive material in the phosphor
 2. Electroluminescence of a gas discharge lamp is derived from the passage of an electric current
through an ionised gas
 3. Chemiluminescence, derived from the energy of a chemical reaction
 4. Bioluminescence when the reactions take place within living organisms, for example, glow-
worms and fireflies
 When the external energy supply is by means of the absorption of infrared, visible or ultraviolet light,
the emitted light is called photoluminescence
PHOTOLUMINESCENCE
 The absorption of light results in the formation of excited molecules which can in turn
dissipate their energy by decomposition, reaction, or re-emission.
 The efficiency with which these processes take place is called the quantum efficiency and
in the case of photoluminescence can be defined as:
 TYPES OF PHOTOLUMINESCENCE
 Fluorescence
 Phosphorescence
 Fluorescence is much more widely used for chemical analysis than phosphorescence
FLUORESCENCE  At room temperature most molecules occupy the
lowest vibrational level of the ground electronic state,
and on absorption of light they are elevated to
produce excited states.
 Excitation can result in the molecule reaching any of
the vibrational sub-levels associated with each
electronic state
 Having absorbed energy and reached one of the
higher vibrational levels of an excited state, the
molecule rapidly loses its excess of vibrational energy
by collision and falls to the lowest vibrational level of
the excited state
 From this level, the molecule can return to any of the
vibrational levels of the ground state, emitting its
energy in the form of fluorescence at a lower wave
length than the absorbed light.
 This shift to longer wavelength is called the Stokes
shift.
DISCOVERY
The first observation of fluorescence from a quinine
solution in sunlight was reported by Sir John
Frederick William Herschel in 1845.
The quinine in tonic water is excited by the
ultraviolet light from the sun. Upon return to the
ground state the quinine emits blue light with a
wavelength near 450 nm.
FLUORESCENCE SPECTROSCOPY
 In fluorescence spectroscopy, the signal being measured is the electromagnetic radiation
that is emitted from sample as it relaxes from an excited electronic energy level to its
corresponding ground state.
 The analyte is originally activated to the higher energy level by the absorption of
radiation in the UV or Vis range. The processes of activation and deactivation occur
simultaneously during a fluorescence measurement.
 For unique molecular systems, there is an optimum radiation wavelength for sample
excitation and another, of longer wavelength, for monitoring fluorescence emission. The
respective wavelengths for excitation and emission will depend on the chemistry of the
system under study.
 The instrumentation used are the fluorometers and spectrofluorometers, there is a need
for two wavelength selectors, one for the excitation beam and one for the emission
beam. In some simple fluorometers, both wavelength selectors are filters such that the
excitation and emission wavelengths are fixed
HOW IS FLUORESCENCE REPRESENTED
A plot of relative intensity against wavelength for any given excitation wavelength is known as the emission
spectrum. If the wavelength of the exciting light is changed and the emission from the sample plotted
against the wavelength of exciting light, the result is known as the excitation spectrum. Furthermore, if the
intensity of exciting light is kept constant as its wavelength is changed, the plot of emission against exciting
wavelength is known as the corrected excitation spectrum
INSTRUMENT FOR DECTECTING FLUORESENCE
 All fluorescence instruments contain three basic items:
 a source of light,
 a sample holder
 detector.
 To be of analytical use, the wavelength of incident radiation needs to be selectable and the
detector signal capable of precise manipulation and presentation. In simple filter fluorimeters, the
wavelengths of excited and emitted light are selected by filters which allow measurements to be
made at any pair of fixed wavelengths.
SCHEMATIC OF A FLUORIMETER
LIGHT SOURCE  Light Source: The lamp or light source
provides the energy that excites the
compound of interest by emitting light. Light
sources include xenon lamps, high pressure
mercury vapor lamps, xenon-mercury arc
lamps, lasers, and LED’s.
 Lamps emit a broad range of light; more
wavelengths than those required to excite the
compound. Lasers and LED’s emit more
specific wavelengths.
Xenon Arc Lamp
LED Bulbs
WAVELENGHT
FILTERS  Wavelength selection The simplest filter
fluorimeters use fixed filters to isolate both the
excited and emitted wavelengths. To isolate one
particular wavelength from a source emitting a
line spectrum, a pair of cut-off filters are all that
is required. These may be either glass filters or
solutions in cuvettes. The emission filter must be
chosen so that the Rayleigh-Tyndall scattered
light is obscured and the light emitted by the
sample transmitted. To avoid high blanks it may
also be necessary to filter out any Raman scatter
 A further refinement would be to use
monochromators to select both the excitation
and emission wavelengths. Most modern
instruments of this type employ diffraction
grating monochromators for this purpose. Such
a fluorescence spectrometer is capable of
recording both excitation and emission spectra
and therefore makes full use of the analytical
potential of the technique.
Wavelength filters (Band pass Filters)
DETECTORS
 All commercial fluorescence instruments use
photomultiplier tubes as detectors and a wide
variety of types are available.
 The material from which the photocathode is
made determines the spectral range of the
photomultiplier and generally two tubes are
required to cover the complete UV-visible
range.
 The S5 type can be used to detect
fluorescence out to approximately 650 nm,
but if it is necessary to measure emission at
longer wavelengths, a special red sensitive,
S20, photomultiplier should be employed.
Photomultiplier tubes
READ OUT
DISPLAY
 The output from the detector is amplified and
displayed on a readout device which may be a
meter or digital display. It should be possible
to change the sensitivity of the amplifier in a
series of discrete steps so that samples of
widely differing concentration can be
compared. A continuous sensitivity
adjustment is also useful so that the display
can be made to read directly in concentration
unit.
SAMPLE HOLDER
 The majority of fluorescence assays are carried out in
solution, the final measurement being made upon the
sample contained in a cuvette or in a flowcell.
 Cuvettes may be circular, square or rectangular (the latter
being uncommon), and must be constructed of a
material that will transmit both the incident and emitted
light.
 Square cuvettes, or cells will be found to be most precise
since the parameters of path length and parallelism are
easier to maintain during manufacture. However, round
cuvettes are suitable for many more routine applications
and have the advantage of being less expensive.
APPLICATION OF FLOURESENCE
SPECTROSCOPY
APPLICATION OF FLOURESENCE
SPECTROSCOPY
 The objective of quantitative absorption spectroscopy is to determine the concentration of analyte in a
given sample solution. The determination is based on the measurement of the amount of light absorbed
from a reference beam as it passes through the sample solution.
 Spectroscopy in the ultraviolet–visible (UV–Vis) range is one of the most commonly encountered laboratory
techniques in food analysis. Diverse examples, functional, nutritional quantification of microcomponents,
(thiamin by the thiochrome fluorometric procedure), investigating different qualities of food such as
tenderness of meats and authenticity of the food product, as well as looking for microbial contamination of
the food.
 In actual practice, the solution to be analyzed is contained in an absorption cell and placed in the path of
radiation of a selected wavelength(s). The amount of radiation passing through the sample is then
measured relative to a reference sample. The relative amount of light passing through the sample is then
used to estimate the analyte concentration.
FACTORS INFLUENCEING INTENSITY OF
FLUORESENCE
The absorbance of the sample measured plays an important role in fluorescence measurements, however
factors such as:
 Quenching: Fluorescence quenching represents any process leading to a decrease in fluorescence
intensity of the sample i.e. Static or Dynamic
 Temperature: Increased temperature leads to increased movement of the molecules, and thereby more
collisions, thus inducing a reduced fluorescence signal. It is therefore important that all samples in an
experiment present the same temperature.
 Ph : The pH value affects the fluorescence, and most hydroxyl aromatic compounds fluoresce better at
high pH (Guilbaut 1989)
 Colour: Colour strongly affect the fluorescence signal. The color of the sample can affect both the shape
and the intensity of the spectra. Dark samples will reabsorb more of the fluorescence than bright
samples.
 Scattering of Light: This phenomenon occurs in turbid solution or solid opaque samples
CASE STUDY: DAIRY NUTRITIONAL ANALYSIS
 Dairy products contain several intrinsic fluorophores, which represent the most important area of
fluorescence spectroscopy. They include the aromatic amino acids and nucleic acids (AAA+NA)
tryptophan, tyrosine, and phenylalanine in proteins; vitamins A and B2; nicotinamide adenine
dinucleotide (NADH) and chlorophyll; and numerous other compounds that can be found at a low or
very low concentration in food products
 Dufour and Riaublanc (1997) investigated the potential of FFFS to discriminate between raw, heated (70
°C for 20 min), homogenized, and homogenized and heated milks.
 The authors applied PCA (Principle Composite Analysis) to the tryptophan and vitamin A fluorescence
spectra. They concluded that the treatments applied to milk induced specific modifications in the shape
of the fluorescence spectra.
CASE STUDY: DAIRY NUTRITIONAL ANALYSIS
 Kulmyrzaev et al. (2005) confirmed these earlier findings. In their research, the emission and excitation
spectra of different intrinsic probes (i.e., AAA+NA, NADH, and FADH) were used to evaluate changes
in milk following thermal treatments in the range of 57–72 °C for 0.5–30 min. The PCA applied to the
normalized spectra allowed good discrimination of milk samples subjected to different temperatures
and times
ADVANTAGES/DISADVANTAGES OF FS
APPLICATION
Advantages of fluorescence spectroscopy:
 Very sensitive
 Can be used for quantitation of fluorescent species
 Easy and quick to perform analysis
Disadvantages:
 Not all compounds fluorescence
 Contamination can quench the fluorescence and hence give false/no results
CONCLUSION
 The environment of intrinsic fluorophores recorded on intact food systems contains valuable
information regarding the composition and nutritional values of food products. The huge potential
for the application of fluorescence spectroscopy combined with multivariate statistical analyses for
the evaluation of food quality has also been demonstrated through literature.
 The great difference between food systems has been related to the differences in the molecular
structure of the samples resulting in a variation of the optical pathway of excitation light and
fluorescence inside the optically complex natural food systems.
 The method is suitable as an effective research tool and can be a part of evaluation procedure for
food quality.

principlesandapplicationoffluoresencespectroscopy-210429182652.pptx

  • 1.
    AGENDA Luminescence Fluorescence Principles of FluorescenceSpectroscopy Instrument for measurement Application Case study Conclusion
  • 2.
    EMMISION SPECTROSCOPY  Emissionspectroscopy is a spectroscopic technique which examines the wave length of photons emitted by atoms during transition from an excited state to a lower energy state.  FORMS OF EMMISION SPECTROSCOPY  Fluorescence Spectroscopy
  • 3.
    LUMINESENCE / INCANDESCENCE A hot body that emits radiation solely because of its high temperature is said to exhibit incandescence. All other forms of light emission are called luminescence.  When luminescence occurs, the system loses energy and if the emission is to be continuous, some form of energy must be supplied from elsewhere
  • 4.
    TYPES OF LUMINESCENCE 1. Radioluminescence emitted from a luminous clock face is supplied by high energy particles from the radioactive material in the phosphor  2. Electroluminescence of a gas discharge lamp is derived from the passage of an electric current through an ionised gas  3. Chemiluminescence, derived from the energy of a chemical reaction  4. Bioluminescence when the reactions take place within living organisms, for example, glow- worms and fireflies  When the external energy supply is by means of the absorption of infrared, visible or ultraviolet light, the emitted light is called photoluminescence
  • 5.
    PHOTOLUMINESCENCE  The absorptionof light results in the formation of excited molecules which can in turn dissipate their energy by decomposition, reaction, or re-emission.  The efficiency with which these processes take place is called the quantum efficiency and in the case of photoluminescence can be defined as:  TYPES OF PHOTOLUMINESCENCE  Fluorescence  Phosphorescence  Fluorescence is much more widely used for chemical analysis than phosphorescence
  • 6.
    FLUORESCENCE  Atroom temperature most molecules occupy the lowest vibrational level of the ground electronic state, and on absorption of light they are elevated to produce excited states.  Excitation can result in the molecule reaching any of the vibrational sub-levels associated with each electronic state  Having absorbed energy and reached one of the higher vibrational levels of an excited state, the molecule rapidly loses its excess of vibrational energy by collision and falls to the lowest vibrational level of the excited state  From this level, the molecule can return to any of the vibrational levels of the ground state, emitting its energy in the form of fluorescence at a lower wave length than the absorbed light.  This shift to longer wavelength is called the Stokes shift.
  • 7.
    DISCOVERY The first observationof fluorescence from a quinine solution in sunlight was reported by Sir John Frederick William Herschel in 1845. The quinine in tonic water is excited by the ultraviolet light from the sun. Upon return to the ground state the quinine emits blue light with a wavelength near 450 nm.
  • 8.
    FLUORESCENCE SPECTROSCOPY  Influorescence spectroscopy, the signal being measured is the electromagnetic radiation that is emitted from sample as it relaxes from an excited electronic energy level to its corresponding ground state.  The analyte is originally activated to the higher energy level by the absorption of radiation in the UV or Vis range. The processes of activation and deactivation occur simultaneously during a fluorescence measurement.  For unique molecular systems, there is an optimum radiation wavelength for sample excitation and another, of longer wavelength, for monitoring fluorescence emission. The respective wavelengths for excitation and emission will depend on the chemistry of the system under study.  The instrumentation used are the fluorometers and spectrofluorometers, there is a need for two wavelength selectors, one for the excitation beam and one for the emission beam. In some simple fluorometers, both wavelength selectors are filters such that the excitation and emission wavelengths are fixed
  • 9.
    HOW IS FLUORESCENCEREPRESENTED A plot of relative intensity against wavelength for any given excitation wavelength is known as the emission spectrum. If the wavelength of the exciting light is changed and the emission from the sample plotted against the wavelength of exciting light, the result is known as the excitation spectrum. Furthermore, if the intensity of exciting light is kept constant as its wavelength is changed, the plot of emission against exciting wavelength is known as the corrected excitation spectrum
  • 10.
    INSTRUMENT FOR DECTECTINGFLUORESENCE  All fluorescence instruments contain three basic items:  a source of light,  a sample holder  detector.  To be of analytical use, the wavelength of incident radiation needs to be selectable and the detector signal capable of precise manipulation and presentation. In simple filter fluorimeters, the wavelengths of excited and emitted light are selected by filters which allow measurements to be made at any pair of fixed wavelengths.
  • 11.
    SCHEMATIC OF AFLUORIMETER
  • 12.
    LIGHT SOURCE Light Source: The lamp or light source provides the energy that excites the compound of interest by emitting light. Light sources include xenon lamps, high pressure mercury vapor lamps, xenon-mercury arc lamps, lasers, and LED’s.  Lamps emit a broad range of light; more wavelengths than those required to excite the compound. Lasers and LED’s emit more specific wavelengths. Xenon Arc Lamp LED Bulbs
  • 13.
    WAVELENGHT FILTERS  Wavelengthselection The simplest filter fluorimeters use fixed filters to isolate both the excited and emitted wavelengths. To isolate one particular wavelength from a source emitting a line spectrum, a pair of cut-off filters are all that is required. These may be either glass filters or solutions in cuvettes. The emission filter must be chosen so that the Rayleigh-Tyndall scattered light is obscured and the light emitted by the sample transmitted. To avoid high blanks it may also be necessary to filter out any Raman scatter  A further refinement would be to use monochromators to select both the excitation and emission wavelengths. Most modern instruments of this type employ diffraction grating monochromators for this purpose. Such a fluorescence spectrometer is capable of recording both excitation and emission spectra and therefore makes full use of the analytical potential of the technique. Wavelength filters (Band pass Filters)
  • 14.
    DETECTORS  All commercialfluorescence instruments use photomultiplier tubes as detectors and a wide variety of types are available.  The material from which the photocathode is made determines the spectral range of the photomultiplier and generally two tubes are required to cover the complete UV-visible range.  The S5 type can be used to detect fluorescence out to approximately 650 nm, but if it is necessary to measure emission at longer wavelengths, a special red sensitive, S20, photomultiplier should be employed. Photomultiplier tubes
  • 15.
    READ OUT DISPLAY  Theoutput from the detector is amplified and displayed on a readout device which may be a meter or digital display. It should be possible to change the sensitivity of the amplifier in a series of discrete steps so that samples of widely differing concentration can be compared. A continuous sensitivity adjustment is also useful so that the display can be made to read directly in concentration unit.
  • 16.
    SAMPLE HOLDER  Themajority of fluorescence assays are carried out in solution, the final measurement being made upon the sample contained in a cuvette or in a flowcell.  Cuvettes may be circular, square or rectangular (the latter being uncommon), and must be constructed of a material that will transmit both the incident and emitted light.  Square cuvettes, or cells will be found to be most precise since the parameters of path length and parallelism are easier to maintain during manufacture. However, round cuvettes are suitable for many more routine applications and have the advantage of being less expensive.
  • 17.
  • 18.
    APPLICATION OF FLOURESENCE SPECTROSCOPY The objective of quantitative absorption spectroscopy is to determine the concentration of analyte in a given sample solution. The determination is based on the measurement of the amount of light absorbed from a reference beam as it passes through the sample solution.  Spectroscopy in the ultraviolet–visible (UV–Vis) range is one of the most commonly encountered laboratory techniques in food analysis. Diverse examples, functional, nutritional quantification of microcomponents, (thiamin by the thiochrome fluorometric procedure), investigating different qualities of food such as tenderness of meats and authenticity of the food product, as well as looking for microbial contamination of the food.  In actual practice, the solution to be analyzed is contained in an absorption cell and placed in the path of radiation of a selected wavelength(s). The amount of radiation passing through the sample is then measured relative to a reference sample. The relative amount of light passing through the sample is then used to estimate the analyte concentration.
  • 19.
    FACTORS INFLUENCEING INTENSITYOF FLUORESENCE The absorbance of the sample measured plays an important role in fluorescence measurements, however factors such as:  Quenching: Fluorescence quenching represents any process leading to a decrease in fluorescence intensity of the sample i.e. Static or Dynamic  Temperature: Increased temperature leads to increased movement of the molecules, and thereby more collisions, thus inducing a reduced fluorescence signal. It is therefore important that all samples in an experiment present the same temperature.  Ph : The pH value affects the fluorescence, and most hydroxyl aromatic compounds fluoresce better at high pH (Guilbaut 1989)  Colour: Colour strongly affect the fluorescence signal. The color of the sample can affect both the shape and the intensity of the spectra. Dark samples will reabsorb more of the fluorescence than bright samples.  Scattering of Light: This phenomenon occurs in turbid solution or solid opaque samples
  • 20.
    CASE STUDY: DAIRYNUTRITIONAL ANALYSIS  Dairy products contain several intrinsic fluorophores, which represent the most important area of fluorescence spectroscopy. They include the aromatic amino acids and nucleic acids (AAA+NA) tryptophan, tyrosine, and phenylalanine in proteins; vitamins A and B2; nicotinamide adenine dinucleotide (NADH) and chlorophyll; and numerous other compounds that can be found at a low or very low concentration in food products  Dufour and Riaublanc (1997) investigated the potential of FFFS to discriminate between raw, heated (70 °C for 20 min), homogenized, and homogenized and heated milks.  The authors applied PCA (Principle Composite Analysis) to the tryptophan and vitamin A fluorescence spectra. They concluded that the treatments applied to milk induced specific modifications in the shape of the fluorescence spectra.
  • 21.
    CASE STUDY: DAIRYNUTRITIONAL ANALYSIS  Kulmyrzaev et al. (2005) confirmed these earlier findings. In their research, the emission and excitation spectra of different intrinsic probes (i.e., AAA+NA, NADH, and FADH) were used to evaluate changes in milk following thermal treatments in the range of 57–72 °C for 0.5–30 min. The PCA applied to the normalized spectra allowed good discrimination of milk samples subjected to different temperatures and times
  • 22.
    ADVANTAGES/DISADVANTAGES OF FS APPLICATION Advantagesof fluorescence spectroscopy:  Very sensitive  Can be used for quantitation of fluorescent species  Easy and quick to perform analysis Disadvantages:  Not all compounds fluorescence  Contamination can quench the fluorescence and hence give false/no results
  • 23.
    CONCLUSION  The environmentof intrinsic fluorophores recorded on intact food systems contains valuable information regarding the composition and nutritional values of food products. The huge potential for the application of fluorescence spectroscopy combined with multivariate statistical analyses for the evaluation of food quality has also been demonstrated through literature.  The great difference between food systems has been related to the differences in the molecular structure of the samples resulting in a variation of the optical pathway of excitation light and fluorescence inside the optically complex natural food systems.  The method is suitable as an effective research tool and can be a part of evaluation procedure for food quality.