Download to read offline
![Introduction
Generation of luminescence through excitation of
a molecule by ultraviolet or visible light photons is
a phenomenon termed photoluminescence,
which is formally divided into two categories,
fluorescence and phosphorescence
Fluorescence is the property of atoms and
molecules, so called fluorophores, to absorb light
at a particular wavelength and to subsequently
emit light of longer wavelength.
However, Phosphorescence occurs in a manner
similar to fluorescence, but with a much longer
excited state lifetime Figure 1: Aequorea Victoria aka Crystal Jelly [1]
10-02-23 3](https://image.slidesharecdn.com/fluorescencemicroscopy-230413094150-54822403/85/Fluorescence-Microscopy-3-320.jpg)
![Stokes Shift
British Scientist Sir George G. Stokes who
first described fluorescence in 1852 and
was responsible for coining the term in
honour of the blue-white fluorescent
mineral fluorite (fluorspar)
He discovered the wavelength shift to
longer values in emission spectra that is
known as the Stokes Shift.
However, Plank’s Equation was derived in
1990.
10-02-23 4
Figure 2: Fluorophore Absorption and Emission Profiles [2]](https://image.slidesharecdn.com/fluorescencemicroscopy-230413094150-54822403/85/Fluorescence-Microscopy-4-320.jpg)
![Jablonski Energy Diagram
10-02-23 5
Figure 3: Jablonski Energy Diagram [2]](https://image.slidesharecdn.com/fluorescencemicroscopy-230413094150-54822403/85/Fluorescence-Microscopy-5-320.jpg)

![Glimpse of Fluorescence Microscope
10-02-23 7
Figure 4: Epi-Fluorescent Microscope and some output images [3]](https://image.slidesharecdn.com/fluorescencemicroscopy-230413094150-54822403/85/Fluorescence-Microscopy-7-320.jpg)
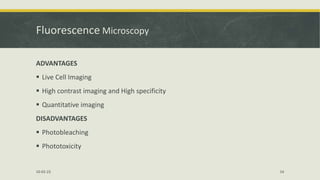
![Filters
Fluorophores that can absorb a quantity of illumination,
the percentage that will emit secondary fluorescence is
even lower.
The fundamental problem in fluorescence microscopy is
to produce high-efficiency illumination of the specimen,
while simultaneously capturing weak fluorescence
emission that is effectively separated from the much
more intense illumination band.
These conditions are satisfied in modern fluorescence
instruments by a combination of filters that coordinate
excitation and emission requirements.
10-02-23 8
Figure 5: Filters characteristics [2]](https://image.slidesharecdn.com/fluorescencemicroscopy-230413094150-54822403/85/Fluorescence-Microscopy-8-320.jpg)
![Dichromatic Mirror
It is positioned at 450
angle to both the incident illumination
arriving from the light source, as well as the optical axis of the
microscope
Light from the source passes through the defined bandpass
excitation filter, and is then reflected down into the objective
by the DM to be focused at the specimen plane
Fluorescence emission is captured by the objective and
directed back through the DM, which in turn reflects most of
the contaminating excitation light back toward the light source
Emission wavelengths passing through the DM are further
purified by the emission filter, before traveling to the eyepieces
or the camera image plane
10-02-23 9
Figure 6: Dichromatic Mirror[2]](https://image.slidesharecdn.com/fluorescencemicroscopy-230413094150-54822403/85/Fluorescence-Microscopy-9-320.jpg)
![Filter and Dichromatic Mirror Characteristics
10-02-23 10
Figure 7: Filter and Dichromatic Mirror Characteristics [2]](https://image.slidesharecdn.com/fluorescencemicroscopy-230413094150-54822403/85/Fluorescence-Microscopy-10-320.jpg)
![Epi-Fluorescent Microscope
10-02-23 11
Figure 8: Epi-Fluorescent Microscope [3]
• Most fluorescence microscopes in
use are Epi-Fluorescence
microscopes, where excitation of
the fluorophore and detection of
the fluorescence are done
through the same light path (i.e.
through the objective).
• These microscopes are widely
used in biology and are the basis
for more advanced microscope
designs](https://image.slidesharecdn.com/fluorescencemicroscopy-230413094150-54822403/85/Fluorescence-Microscopy-11-320.jpg)
![Applications of Fluorescence Microscopy
10-02-23 12
Figure 9: Application of Fluorescence Microscopy in 1985 [4]](https://image.slidesharecdn.com/fluorescencemicroscopy-230413094150-54822403/85/Fluorescence-Microscopy-12-320.jpg)
![Applications of Fluorescence Microscopy
10-02-23 13
Figure 10: Application of Fluorescence Microscopy in 2023 [5]](https://image.slidesharecdn.com/fluorescencemicroscopy-230413094150-54822403/85/Fluorescence-Microscopy-13-320.jpg)


Fluorescence microscopy uses fluorescence to visualize and study samples. It works by exciting fluorophores in the sample with light, causing them to emit light of a longer wavelength. Filters and dichroic mirrors are used to separate the excitation and emission wavelengths. The epi-fluorescence microscope configuration excites and detects fluorescence through the same light path using the objective lens. Applications in biology have expanded from imaging organelles in 1985 to live cell imaging and quantitative analysis today. Advantages include live cell imaging and high specificity, while disadvantages are photobleaching and phototoxicity.