SlideShare a Scribd company logo
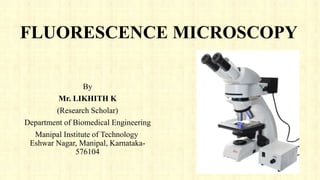
FLUORESCENCE MICROSCOPY
By
Mr. LIKHITH K
(Research Scholar)
Department of Biomedical Engineering
Manipal Institute of Technology
Eshwar Nagar, Manipal, Karnataka-
576104
CONTENTS
Introduction
Fluorescence characterization
Brief history
Green fluorescent protein (GFP)
Resolution of fluoresce microscope
Sample preparation
Application
Conclusion
Reference
INTRODUCTION
Fluorescence microscopy provides an efficient and unique approach to study fixed and living cells because of its
versatility, specificity, and high sensitivity.
Fluorescence microscopes can both detect the fluorescence emitted from labeled molecules in biological samples
as images or photometric data from which intensities and emission spectra can be deduced.
By exploiting the characteristics of fluorescence, various techniques have been developed that enable the
visualization and analysis of complex dynamic events in cells, organelles, and sub-organelle components within
the biological specimen.
The most common techniques are
1) Fluorescence recovery after photo bleaching (FRAP)
2) Fluorescence loss in photo bleaching (FLIP)
3) Fluorescence localization after photo bleaching (FLAP)
4) Fluorescence resonance energy transfer (FRET)
And the different ways to measure FRET are such as
1) Acceptor bleaching
2) Sensitized emission
3) Polarization anisotropy
4) Fluorescence lifetime imaging microscopy (FLIM)
The Physical Phenomenon of Fluorescence
Fluorescence as a phenomenon is part of a larger family of related luminescent processes in which a susceptible
substance absorbs light, only to reemit light (photons) from electronically excited states after a given time (Figure
1).
 Photo luminescent processes that are generated through excitation, whether this is via physical, mechanical, or
chemical mechanisms, can generally be subdivided into fluorescence and phosphorescence.
Absorption of a light quantum (blue) causes an electron to move to a higher energy orbit. After residing in this
“excited state” for a particular time, the fluorescence lifetime, the electron falls back to its original orbit and the
fluorochrome dissipates the excess energy by emitting a photon (green).
Figure1 Schematic representation of the fluorescence phenomenon in the classical Bohr model.
Compounds that display fluorescent properties are generally termed fluorescent probes or dyes.
Often ‘fluorochrome’ and ‘fluorophore’ are used interchangeably.
The term ‘fluorophore’ refers to fluorochromes that are conjugated covalently or through adsorption to biological
macromolecules, such as nucleic acids, lipids, or proteins.
Fluorochromes come in different flavors and include
1) organic molecules (dyes)
2) inorganic ions (e.g., lanthanide ions such as Eu, Tb, Yb, etc.)
3) fluorescent proteins (e.g., green fluorescent protein)
4) atoms (such as gaseous mercury in glass light tubes)
Some commonly used fluorochromes are listed in Table 1 and 2.
Recently, inorganic luminescent semiconducting nanoparticles, quantum dots, have been introduced as labels for
biological assays, bio-imaging applications, and theragnostic purposes (the combination of diagnostic and
therapeutic modalities in one and the same particle).
Table 1 Some fluorochromes used to label proteins
Table 2 Some fluorochromes used to stain nucleic acids fluorochrome abbreviation absorption emission
Fluorescence follows a series of discrete steps of which the outcome is the emittance of a photon with a longer
wavelength
Figure 2 Process which can be visualized in more detail via the Jabłoński diagram
When light of a particular wavelength hits a fluorescent sample, the atoms, ions or molecules therein absorb a
specific quantum of light, which pushes a valence electron (outer most shell electrons) from the ground
state (GS0).
This initial state is an electronic singlet in which all electrons have opposite spin and the net spin is 0
Jumping into a higher energy level , creating an excited state (Esn).
This process is fast and in the femtosecond range and requires at least the energy to bridge the gap between
excited and ground states in order for excitation to occur.
ΔE = EESn − EGS0
The energy of photons involved in fluorescence and generally a quantum of light can be expressed via Planck’s
law :
E =hv = h (c/λ)
where E is the quantum’s energy (J)
h is Planck's constant (J.s)
ν the frequency (s−1)
λ is the wavelength of the photon (m)
c is the speed of light (m.s−1)
However, there are several excited state sublevels (vibrational levels) and which level is reached primarily
depends on the fluorescent species’ properties.
After excitation to the higher energy level ESn, the electron quickly relaxes to the lowest possible excited
sublevel, which is in the picosecond range.
The energy decay from dropping to a lower vibrational sublevel occurs through intramolecular non-radiative
conversions and the converted heat is absorbed via collision of the excited state fluorescent molecule with the
solvent molecules.
Emission spectra are usually independent of the excitation wavelength because of this rapid relaxation to the
lowest vibrational level of the excited state, which is known, as Kasha’s rule. In most cases, absorption and
emission transitions involve the same energetic levels as schematically shown in Figure 3.
For this reason and the fact that excitation is instantaneous, involving electrons only and leaving the heavier
nuclei in place, many fluorochromes display near mirror image absorption and emission spectra (mirror image
rule), although many exceptions exist.
Intersystem crossing is the slowest energy dissipation pathway, because the electron has to change spin
multiplicity from an excited singlet state to an excited triplet state (Figure 2 B).
Intersystem crossing is mostly observed in molecules containing heavy atoms such as iodine or bromine or in
paramagnetic species.
Figure 3 Absorption and emission transitions involve the same energetic levels as schematically shown below.
The difference between the excitation and emission maxima is called “Stokes shift”.
It is caused by a quick electron relaxation and intramolecular vibrational energy loss taking place between the
different excited state sublevels.
That is the reason why the excitation light normally has a shorter wavelength (i.e., higher energy) than the
emission light (i.e., lower energy).
In many fluorochromes, the same electronic transitions are involved in both excitation and emission, which leads
to near-mirror image spectra.
Lanthanide ions are good examples of luminescent probes that show delayed fluorescence.
The term “luminescence” is normally used when discussing lanthanide-based emission, because “fluorescence”
refers to spin allowed singlet-to-singlet emission, whereas in lanthanide ions, emission is due to intra-
configurational f-f transitions (transitions inside the 4f shell).
As a result they have fluorescence lifetimes in the (sub)microsecond range for Yb(III) and Nd(III), whereas
Eu(III), Tb(III) and Sm(III) have even longer lifetimes in the (sub)millisecond range.
This is significantly longer than the lifetimes of organic fluorochromes and fluorescent proteins which are
generally in the nanosecond range.
Because of the large lifetime difference to fluorescence, lanthanide emission should easily be distinguishable
from fluorescence emission by time-gating techniques.
When the electron finally returns to the lower energy level it originated from, the ground state GS0, a quantum
of light (photon) is emitted with a longer wavelength, which is an allowed transition since the spin is retained.
In most fluorochromes, photon emission is produced by a π*→π or π*→n transition, depending on which
requires the least energy for the transition to occur.
In contrast, σ*→ σ transitions are rare since the required UV light (below 250 nm) is energetic enough to
deactivate the excited state electron by pre dissociation (internal conversion to a GS0 that is at such a high
vibrational level that the bond breaks) or dissociation (the bond breaks at a vibrational excited state).
Photon emittance from singlet states with an average time-scale between 10−9 and 10−6 seconds is slow
compared with the absorption of photons.
This resulting emitted radiation is called fluorescence and in the simplest form of fluorescence microscopy, this
emitted light is collected and transported to the detector through the same objective lens used to focus the
excitation light onto the sample.(Figure 4).
Fluorochromes can enter repetitive cycles of excitation and emission as long as no destruction or covalent
modification occurs that irreversibly interrupts this process.
The transition from the meta-stable triplet state ET1 to the ground state GS0 is, because of the necessary spin
reversal, forbidden and therefore several orders of magnitude slower than fluorescence, i.e., thus called
phosphorescence.
Consequently, the emission takes place over long periods of time in some materials it takes several seconds to
even minutes.
Figure 4 In fluorescence microscopy the sample is illuminated with excitation light and the emitted light (the
fluorescence) is detected through the same objective (epi-fluorescence microscopy).
Fluorescence emission generally occurs at longer wavelengths and concomitant lower energy than the
light used to excite the fluorochrome, provided that a single photon is involved during excitation.
It was the British scientist Sir George Stokes who first observed fluorescence when irradiating
fluorspar (fluorite) with UV radiation and a red-shift in the resulting emitted light, which he reported
in his 1852 publication “on the change of refrangibility of light”.
The difference between the emission and excitation maxima is called “Stokes shift” (Figure 3).
The Stokes shift varies markedly among different fluorochromes.
Note anti-Stokes shifts in which the emission wavelength is smaller than the excitation wavelength are
also possible, for instance during photon up conversion or two-photon excitation.
Anti-Stokes fluorescence also occurs commonly in fluorochromes in which absorption and emission
spectra overlap substantially.
Therefore fluorochromes not only have characteristic excitation spectra, but also characteristic
emission spectra that are dependent on their specific vibronic configuration and properties.
FLUORESCENCE CHARACTERISTICS
Some of the essential characteristics and parameters of fluorescence that are utilized in fluorescence microscopy,
such as
1) The fluorescence life time
2) Quantum yield
3) Anisotropy
4) Quenching
5) Photobleaching
6) Fluorescence intermittency / blinking
7) Autoflurosence
8) Resonance energy transfer
9) Energy transfer
1. Quantum yield:
The quantum yield (Ф) basically determines how bright a fluorochrome’s emission is.
It is given by the ratio of the number of emitted to absorbed photons, which is determined by the rate constants
of emission (Γ) and the sum of all non-radiative decay processes (knr) that depopulate the excited state.
The quantum yield, as many intrinsic fluorescence parameters, is sensitive to environmental influences, such a
solvent polarization, pH, fluorochrome concentration, and the presence of molecules affecting the excited state,
such as molecular oxygen.
2. Fluorescence lifetime:
The fluorochrome’s fluorescence lifetime (τ) is the average time the electron spends in the excited state before
returning to the ground state.
In other words, the depopulation of excited state molecules through radiative (Γ) and non-radiative processes (knr)
follows an exponential decay and the time of this process is basically the fluorescence lifetime
3. Anisotropy:
This refers to the quality of having different properties along different axes: in a pool of randomly oriented
fluorochromes, only those fluorochromes with transition dipole moments that are aligned (near) parallel to the
polarization direction of the excitation beam (linearly polarized) will be excited (photo selection).
Fluorescence polarization is determined by the orientation of the fluorochromes’ transition moment at the instant
of emission, which allows the determination of the fluorochromes’ rotation by measuring their anisotropy.
Theoretically, the maximal anisotropy is achieved when the emission transition dipole moment is exactly
parallel to the absorption transition dipole moment.
4. Fluorescence quenching:
Quenching is a phenomenon by which interaction of a molecule, the quencher, with the fluorochrome reduces
the quantum yield or the lifetime.
Quenching phenomena can be subdivided into:
1) Dynamic quenching occurs through collision of the quencher and the excited state fluorochrome, which leads
to a decrease in the lifetime and emission intensity.
2) Static quenching arises from direct interaction of the fluorochrome and quenching molecules, for instance by
forming a non-fluorescent ground state complex. This form of quenching does not necessarily decrease the
measured emission lifetime and often occurs simultaneous with dynamic quenching.
3) Self-quenching or concentration quenching, the fluorochrome quenches its own fluorescence because of close
proximity of identical molecules at high concentration. Self-quenching occurs in particular in biomembranes,
where the lipid bilayer behaves as a 2D fluid with different domains of fluidity where fluorochromes can be
concentrated or when labeling proteins with multiple labels.
4) Color-quenching is a process in which emitted photons are absorbed by a strongly colored component such as
β-carotene. This leads to a decrease in intensity, but not the fluorescence lifetime.
5. Fluorescence intermittency or “blinking”:
This phenomenon occurs when the fluorochrome randomly alternates between a fluorescent (“on”) and dark
state (“off”) despite continuous excitation illumination.
As a result, when tracking single fluorochromes, a stroboscopic effect may interfere with the tracking procedure.
Blinking generally follows power law statistics and occurs commonly in luminescent nanoparticles, but also in
some organic dyes, and fluorescent proteins.
The random nature and power law dynamics generally frustrates and precludes comparison of results between
independent experiments, because the “on” and “off” time distributions can significantly differ.
6. Autofluorescence:
Fluorescence that does not originate from the fluorochrome of interest (FOI), but rather from cellular
components that have fluorescent properties, most notably flavins, e.g., FAD+ and riboflavin, NAD(P)H, and
extracellular matrix components, e.g., elastin and collagen, but also retinol, folic acid, lipofuscin, and
chlorophyll.
The autofluorescence window approximately encompasses the range from 350 nm to 600 nm and can effectively
be avoided by a number of strategies:
1) Precise filtering of the FOI signal with narrow band pass optical filters,
2) The use of probes that fluoresce outside the autofluorescence window, commonly in the (near) infrared (NIR)
region,
3) The use of time-resolved techniques (autofluorescent bio fluorochromes have distinctly different lifetimes),
4) The use of up converting fluorochromes that allow excitation in the IR; (v) multispectral imaging (recording
spectra in every pixel), and (vi) spectral un mixing (mathematical disentangling of mixed emission signals).
7. Photobleaching:
Photobleaching or “fading” is a photochemical process in which the fluorochrome’s ability to enter repetitive
excitation is permanently interrupted by destruction or irreversible covalent modification of the fluorochrome by
reaction with surrounding biomolecules.
Photodestructive and photochemical processes occur predominantly when the fluorochrome is in the dark triplet
excited state, which is longer lived than singlet states and exhibits a high degree of chemical reactivity.
8. Resonance energy transfer:
This is a photophysical process in which the excited state energy from a donor fluorochrome is transferred via a
non-radiative mechanism to a ground state acceptor chromophore via weak long-range dipole–dipole coupling.
The theoretical basis for the molecular interactions involved in resonance energy transfer was first described by
Theodor Förster in the 1940s.
9. Charge-transfer complexes:
These are nanosecond short-lived homodimers (excimer) or heterodimers (exciplex) of two molecules of which
at least one is in the excited state that show red-shifted emission compared with the monomer’s emission.
Such complexes occur via electrostatic attraction because of partial electronic charge transfer between the
individual entities.
The individual ground state monomers would normally not associate and the monomers in the complex
dissociate and repel each other once relaxation to the ground state occurs.
Since these complexes require close proximity, excimer and exciplex formation require high concentrations of
the monomers.
BRIEF HISTORY
The first fluorescence microscopes were developed at the beginning of the 20th century.
In 1904, August Köhler constructed an ultraviolet (UV) illumination microscope at Zeiss Optical Works in Jena,
Germany, in which he used a cadmium arc lamp as a light source.
However, it was Oskar Heimstädt who developed the first working fluorescence microscope in 1911, with which
he studied autofluorescence in organic and inorganic compounds .
Still, these early fluorescence microscopes suffered from several drawbacks, including the fact that the light
sources at that time did not have enough power to excite fluorochromes at high enough rates and that effective
separation of the fluorescence signal from the excitation light was difficult to achieve.
In order to obtain sufficient signal, Heimstädt had to rely on darkfield illumination, which ensured that only a
limited amount of excitation light would enter the objective lens, but this was a technically challenging method
and certainly not suited for developing fluorescence microscopy as a mainstream tool.
The invention of the epi-fluorescence microscope in 1929 by Philipp Ellinger and August Hirt was a major step
forward to achieving this goal.
Figure 5 Anatomy of an epi-illumination fluorescence microscope.
In the 1930s the Austrian Max Haitingen and others developed the technique of ‘secondary fluorescence’ in
which samples were systematically stained with fluorescent dyes, initially simply to make the weak
autofluorescent biological samples better visible.
Haitingen also was the first to introduce the word ‘fluorochrome’ for these fluorescent stains.
In the early 1940s, Albert Coons developed the technique of labeling antibodies with fluorescent dyes . This was
a breakthrough, as it allowed to specifically label proteins and subcellular structures and as a result made these
molecular structures visible in a contrast and resolution never seen before.
Since these first experiments, antibody staining with fluorescent secondary markers has become a standard
method in biological and biomedical research, and clinical diagnostics for fixed samples, including tissues and
single cells.
Furthermore, a significant increase in fluorescence signal can be achieved with these fluorochromes over the
weak autofluorescent endogenous biological species.
The lack of excitation power was resolved with the development of lasers in the 1960s based on Einstein’s
theoretical foundations regarding stimulated emission by Gould, Townes, Schawlow, and Maiman.
Lasers offered what other light sources could not: a high degree of spatial and temporal coherence, which means
that the diffraction limited monochromatic and coherent beam can be focused in a tiny spot, achieving a very high
local irradiance.
Furthermore, it now became possible to effectively separate signals by using suitable filters and dichroic mirrors
(also called dichromatic beam splitters). (figure 5)
The latter are specialized interference filters that selectively allow passage of light in a particular wavelength
range, while reflecting other wavelengths when placed into the light path at a 45° angle (Figure 5).
GREEN FLUORESCENT PROTEIN (GFP)
The next foremost breakthrough that resulted in an explosion in both instrument and technique development and
concurrently biological research was the discovery in the 1960s, sequencing and subsequent development of
green fluorescent protein (GFP) as a fluorescent label in the 1990s by Tsien, Chalfie, and Shimomura.
GFP is a 238 amino acid protein that shows bright green fluorescence and was first isolated from the
jellyfish Aequorea victoria.
The 26.9 kDa wild-type GFP consists of a β-barrel structure (Figure 6) in which the essential chromophoric
moiety, an amino acid triplet of Ser65, Tyr66, and Gly67, lies at the centre.
The entire poly-peptide structure is necessary for GFP fluorescence, the chromophore forms autocatalytically and
that the molecular structure surrounding the tripeptide influences its fluorescent properties.
Furthermore, the protective β-barrel surrounding the tripeptide ensures stability, makes GFP relatively insensitive
to environmental influences, and causes physical separation from species such as molecular oxygen.
As a result, GFP’s photobleaching rate is lower than those of conventional fluorochromes.
Wild-type GFP (from A. victoria) fluorescence is characterized by a major excitation peak at 395 nm and a minor
one at 475 nm (Figure 6), which results in bright green emission at 509 nm and a quantum yield of 0.77.
Figure 6 Molecular structure and localization of the chromophoric
tripeptide in A. victoria wild-type GFP.
Many fluorescent proteins (FPs) from other species, such as the Anthozoan button polyp Zoanthus (ZsYellow),
sea anemone Discosoma (DsRed), or Anemonia majano (AmCyan1), have been identified and isolated, which
now results in a wide color palette, with various photostabilities, sensing properties, photo-switchability, and
useful FRET pairs.
The development of FP technology was so significant that it opened the doors to completely new ways of
performing fluorescence live cell imaging, particularly since it was now possible to tailor the fluorescent label’s
properties through genetic engineering and to label proteins by expressing fluorescent fusion constructs directly
in living cells.
Bio nanotechnology over the past decades resulted in the development of luminescent nanoparticles with
exceptional physical and chemical properties, not seen in other fluorochromes.
Quantum dots (QDs), for instance, are inorganic semiconducting nanoparticles consisting of a core-shell
configuration creating a spectral bandgap, e.g., CdSe/ZnS QDs.
QDs have a relatively long lifetime, which provides the possibility to correct for background signals from short
lived fluorescent species by time-gating techniques.
QDs have broad absorption spectra, a single light source can be used to excite multiple QDs with different
emission wavelengths simultaneously.
Quantum dots are characterized by a number of additional unique properties
1) QDs are about 10–100 times brighter than organic fluorogenic dyes
2) They are 100–1,000 times more resistant to photobleaching, because the shell and various coatings form
physical barriers that separate the excited state from surrounding biomolecules and molecular oxygen
3) They show narrower and more symmetric emission spectra compared with other fluorochromes.
Fluorescence microscopy is the method of choice for live cell imaging and it is a standard procedure to study
normal and pathological cell biological processes in single cells, subcellular compartments or across a population
of cells by introducing fluorochromes specifically targeted to the (bio)molecules of interest.
Major advantages are that fluorescence microscopy techniques provide information with spatio-temporal
resolution and are generally less destructive compared with other imaging techniques, e.g., Electron Microscopy
(EM).
What makes fluorescence microscopy such a great and specific tool for cellular and molecular imaging and analysis?
 Essentially it is its selectivity and contrast enhancement.
 While the selectivity is achieved predominantly through the labeling methods
 The contrast increase is realized in the microscope itself.
 Modern fluorescence microscopes can maximize the collection of emitted fluorescent light, while minimizing the collection
of the incident excitation light.
 The main advantages of fluorescence microscopy is the dramatic increase in signal from the labeled structures and molecules
against a dark background
 Image contrast critically dependents on the ability of the microscope to pass fluorescent light to the detector while blocking
the excitation light.
 Due to its selectivity and contrast, not only fine cellular and subcellular structures, but even single molecules can be made
visible in the fluorescence microscope.
 If they are spatially well separated and thus not too close to each other or do not light up at the same time, localization of
individual molecules is feasible, but is diffraction limited.
 Three basic components are present in every light microscope, irrespective of the type:
1) An illumination source
2) A magnifying lens
3) An image acquisition device.
In a wide field fluorescence microscope, the white light source is replaced by a high power lamp (a mercury or
xenon source), which excites the fluorochromes in the fluorescently labeled sample and induces fluorescence
emittance(Figure 5).
Images are typically acquired visually by eye or electronically with a CCD camera.
Fluorochromes have characteristic excitation spectra.
Thus, an appropriate excitation filter, usually a band-pass filter (BP), is placed between the lamp and the sample
to narrow the wavelength range of light reaching the sample to such an extent that the fluorochromes used are
excited efficiently, whereas unwanted excitation is minimized. (Figure 7)
Since the emitted light has a longer wavelength than the excitation light, an emission filter (either a long pass
[LP] or BP filter) placed between the sample and the detector effectively blocks the excitation light and prevents
perturbation of the final image.
Intense light is required for successful fluorescence excitation.
Lasers generally produce high intensity light and have proven to be an excellent alternative excitation source to
mercury and xenon lamps.
Since lasers are a source of monochromatic light, generally no excitation filter is required.
However an emission filter or an alternative spectral selection device is still needed to stop the excitatory laser
light from reaching the detector and to tune in on the fluorochrome’s emission signal, especially in multiple
labeling experiments.
Figure 7 Optical settings for a fluorescence microscope
RESOLUTION IN FLUORESCENCE MICROSCOPY
In fluorescence microscopy, the optical resolving power determines the amount of detail observed in a specimen,
which in turn is determined by a number of physical factors and instrument limitations.
In order to obtain sharp images, the objective must capture as much of the deflected light as possible, which is
achieved with wide angular openings (aperture).
Ernst Abbe first defined the numerical aperture (N.A.), which determines the objective’s light capturing capacity
and can mathematically be written as
Where, n is the refraction index of the medium between the object and the objective (n = 1 for air and for
immersion oil n = 1.51)
α is half the objective opening angle.
To maximize capturing the deflected light and to increase the resolution, several strategies can be employed,
including the use of a condenser lens for illumination to widen the angle of the ray cone on the illumination side
and or to use an immersion liquid between objective lens and the cover slip, which abrogates reflections that
normally diminish the resolving power.
In fluorescence microscopy the resolution is not directly governed by the magnification. Resolution and contrast
are two reciprocally interrelated parameters that are important in fluorescence microscopy and should not be
considered as separate entities.
Individual objects in a specimen cause diffraction of light and as a result, an illuminated point source within the
specimen is observed as a bright central spot (Airy disc) with surrounding diffraction rings (Airy pattern) as
shown in Figure 7.
Figure 7 Airy disc diffraction pattern
Essentially, resolution may be defined as the smallest distance between two points in the specimen that can still
be discriminated as separate points at a particular contrast, which with Equation 5 can be written as:
Contrast is defined as the difference between the maximum intensity and minimum intensity occurring
in the space between two objects of equal intensity.
When the two point objects are well separated, the contrast minimum between them is near zero and
the objects can be discriminated .
However, as the point objects approach and their PSFs start to overlap, the intensity minimum between
the two object maxima is reduced until the objects are no longer resolved.
Rayleigh criterion for resolution
Which states that two points are resolved when the first minimum of one Airy disc is aligned with the
central maximum of the second Airy disc.
From the above mentioned statement , it becomes obvious that the smaller the Airy pattern, the higher
the resolution.
SAMPLE PREPARATION
Fluorescence from a fluorophore tagged to a molecule of interest is often used to measure the quantity of the
tagged molecule.
Fluorescent proteins expressed in live cells are excellent for quantitation; because there is a constant number of
fluorophores per labeled protein.
The number of photons emitted can be an accurate measure of the quantity of fluorescently labeled protein.
Quantitation of live versus fixed cells is generally preferable because the fixation and extraction process can
remove tagged proteins, quench the fluorescence of fluorescent proteins, and change the size and shape of cells.
The fixation and extraction necessary to get antibodies into cells can change the quantity and localization of
detectable epitopes.
Measuring fluorescence deep into specimens can also be problematic for measurements of signal intensities.
In biological specimens, light scattering and optical aberrations increase with distance from the coverslip and
decrease signal intensity.
These effects are difficult to characterize and correct for in inhomogeneous biological samples.
Although the effects of light scattering are minimized when using multi-photon illumination.
APPLICATION
CONCLUSION
The significance of imaging-based methodologies is underscored by the fact that the major part of
discoveries in life sciences over at least the past 50 years were based on imaging biological and
pathological processes.
The advanced fluorescence microscopic techniques has a major impact on cell biological research and
(bio)medicine.
Nowadays functional insight in cellular processes that was previously the mainstay of analytical
biochemistry and could only be observed on gels and blots can now directly be visualized and also be
analyzed in the living cell.
Fluorescence microscopy is a valuable toolbox to study cellular structures and dynamics spanning
scales from the single molecule to the live animal.
The spatial resolution that can be achieved with any light-based microscopy is however limited to
about 200 nm in the imaging plane and >500 nm along the optical axis.
It has been a motivation and a challenge to bypass this limit in spatial resolution, and to extend the
range of fluorescence microscopy reaching a near-molecular resolution.
It’s a selection of techniques that successfully demonstrated sub-diffraction resolution fluorescence
imaging and which today are used for imaging of small cellular structures.
However, even though techniques such as FRAP, FLIP, and FRET have become more common place
in life science research, they are certainly not trivial methodologies with many possible pitfalls, some
of which are obvious, whilst others are more obscure.
REFERENCE
Hellen C. Ishikawa-Ankerhold etal. 2012,Advanced Fluorescence Microscopy Techniques-FRAP, FLIP, FLAP,
FRET and FLIM. 17(4): 4047–4132.
Berezin M.Y., Achilefu S. Fluorescence lifetime measurements and biological imaging. Chem.
Rev. 2010;110:2641–2684
Lakowicz J.R. Principles of Fluorescence Spectroscopy. 3rd. Springer Science; New York, NY, USA: 2006
Wang Y.L. Fluorescence Microscopy of Living Cells in Culture. Part A. Fluorescent Analogs, Labelling Cells,
and Basic Microscopy. Methods in Cell Biology. Vol. 29 Academic Press; San Diego, State abbr., USA: 1989
Swift S.R., Trinkle-Mulcahy L. Basic principles of FRAP, FLIM and FRET. Proc. Royal Mic. Soc. 2004;39:3–
10.
THANK YOU

More Related Content

What's hot

Chromatography and its types
Chromatography and its typesChromatography and its types
Chromatography and its typesnadeem akhter
 
Spectrophotometry
SpectrophotometrySpectrophotometry
Spectrophotometry
sushma93
 
Raman spectroscopy
Raman spectroscopyRaman spectroscopy
Raman spectroscopy
Bhaumik Bavishi
 
GC - MS
GC - MSGC - MS
(Gel Filtration Chromatography)GFC
(Gel Filtration Chromatography)GFC(Gel Filtration Chromatography)GFC
(Gel Filtration Chromatography)GFC
Athira athira
 
Spectrophotometer
SpectrophotometerSpectrophotometer
Spectrophotometer
AMASM
 
Fluorescence spectrometry
Fluorescence spectrometryFluorescence spectrometry
Fluorescence spectrometry
Hari Sharan Makaju
 
Infrared spectroscopy
Infrared spectroscopyInfrared spectroscopy
Infrared spectroscopy
Shabnamkhan113
 
Electrophoresis & its types
Electrophoresis & its typesElectrophoresis & its types
Electrophoresis & its types
Sabahat Ali
 
Ultra performance liquid chromatography
Ultra performance liquid chromatographyUltra performance liquid chromatography
Ultra performance liquid chromatography
biniyapatel
 
Fluorescence recovery after photo bleaching
Fluorescence recovery after photo bleachingFluorescence recovery after photo bleaching
Fluorescence recovery after photo bleachinganasshokor
 
Ultra violet (UV) spectroscopy, introduction,principle instrumentation,differ...
Ultra violet (UV) spectroscopy, introduction,principle instrumentation,differ...Ultra violet (UV) spectroscopy, introduction,principle instrumentation,differ...
Ultra violet (UV) spectroscopy, introduction,principle instrumentation,differ...
mariomS7
 
Ph meter
Ph meterPh meter
Ph meter
Rachana Tiwari
 
Spectroscopy techniques, it's principle, types and applications
Spectroscopy techniques, it's principle, types and applications Spectroscopy techniques, it's principle, types and applications
Spectroscopy techniques, it's principle, types and applications
NizadSultana
 
Principles and application of fluorescence spectroscopy
Principles and application of fluorescence spectroscopyPrinciples and application of fluorescence spectroscopy
Principles and application of fluorescence spectroscopy
ruthannfrimpong1
 
Flame photometry
 Flame photometry Flame photometry
Flame photometry
Sabahat Ali
 
Theory and application of Isotachophoresis and Isoelectric focussing
Theory and application of Isotachophoresis and Isoelectric focussingTheory and application of Isotachophoresis and Isoelectric focussing
Theory and application of Isotachophoresis and Isoelectric focussing
kvineetha8
 
Transmission Electron microscopy
Transmission Electron microscopyTransmission Electron microscopy
Transmission Electron microscopy
Aditya Singh
 
Gas chromatography
Gas chromatographyGas chromatography
Gas chromatography
Priyanka Jaiswal
 

What's hot (20)

Chromatography and its types
Chromatography and its typesChromatography and its types
Chromatography and its types
 
Spectrophotometry
SpectrophotometrySpectrophotometry
Spectrophotometry
 
Laser spectroscopy
Laser spectroscopyLaser spectroscopy
Laser spectroscopy
 
Raman spectroscopy
Raman spectroscopyRaman spectroscopy
Raman spectroscopy
 
GC - MS
GC - MSGC - MS
GC - MS
 
(Gel Filtration Chromatography)GFC
(Gel Filtration Chromatography)GFC(Gel Filtration Chromatography)GFC
(Gel Filtration Chromatography)GFC
 
Spectrophotometer
SpectrophotometerSpectrophotometer
Spectrophotometer
 
Fluorescence spectrometry
Fluorescence spectrometryFluorescence spectrometry
Fluorescence spectrometry
 
Infrared spectroscopy
Infrared spectroscopyInfrared spectroscopy
Infrared spectroscopy
 
Electrophoresis & its types
Electrophoresis & its typesElectrophoresis & its types
Electrophoresis & its types
 
Ultra performance liquid chromatography
Ultra performance liquid chromatographyUltra performance liquid chromatography
Ultra performance liquid chromatography
 
Fluorescence recovery after photo bleaching
Fluorescence recovery after photo bleachingFluorescence recovery after photo bleaching
Fluorescence recovery after photo bleaching
 
Ultra violet (UV) spectroscopy, introduction,principle instrumentation,differ...
Ultra violet (UV) spectroscopy, introduction,principle instrumentation,differ...Ultra violet (UV) spectroscopy, introduction,principle instrumentation,differ...
Ultra violet (UV) spectroscopy, introduction,principle instrumentation,differ...
 
Ph meter
Ph meterPh meter
Ph meter
 
Spectroscopy techniques, it's principle, types and applications
Spectroscopy techniques, it's principle, types and applications Spectroscopy techniques, it's principle, types and applications
Spectroscopy techniques, it's principle, types and applications
 
Principles and application of fluorescence spectroscopy
Principles and application of fluorescence spectroscopyPrinciples and application of fluorescence spectroscopy
Principles and application of fluorescence spectroscopy
 
Flame photometry
 Flame photometry Flame photometry
Flame photometry
 
Theory and application of Isotachophoresis and Isoelectric focussing
Theory and application of Isotachophoresis and Isoelectric focussingTheory and application of Isotachophoresis and Isoelectric focussing
Theory and application of Isotachophoresis and Isoelectric focussing
 
Transmission Electron microscopy
Transmission Electron microscopyTransmission Electron microscopy
Transmission Electron microscopy
 
Gas chromatography
Gas chromatographyGas chromatography
Gas chromatography
 

Similar to Fluorescence microscopy Likhith K

Fluoroscence 1.pptx
Fluoroscence 1.pptxFluoroscence 1.pptx
Fluoroscence 1.pptx
MuhammadJavedIqbal40
 
Fluorescence spectroscopy
Fluorescence spectroscopyFluorescence spectroscopy
Fluorescence spectroscopy
Halavath Ramesh
 
Fluorimetry, principle, Concept of singlet,doublet,and triplet electronic sta...
Fluorimetry, principle, Concept of singlet,doublet,and triplet electronic sta...Fluorimetry, principle, Concept of singlet,doublet,and triplet electronic sta...
Fluorimetry, principle, Concept of singlet,doublet,and triplet electronic sta...
Vandana Devesh Sharma
 
rana.pptx
rana.pptxrana.pptx
Luminiscence spectroscopy assignment 1624
Luminiscence spectroscopy assignment 1624Luminiscence spectroscopy assignment 1624
Luminiscence spectroscopy assignment 1624
irfankashif1
 
Photoluminescence
PhotoluminescencePhotoluminescence
Photoluminescence
Tayaser
 
Fluorescence , Phosphorescence and photoluminescence
Fluorescence , Phosphorescence and photoluminescenceFluorescence , Phosphorescence and photoluminescence
Fluorescence , Phosphorescence and photoluminescence
Preeti Choudhary
 
Fluorescence and phosphorescence
Fluorescence and phosphorescenceFluorescence and phosphorescence
Fluorescence and phosphorescence
SamawiaIqbal
 
Fluorometry Manik
Fluorometry Manik Fluorometry Manik
Fluorometry Manik
Imran Nur Manik
 
Spectrofluorimetry (www.redicals.com)
Spectrofluorimetry (www.redicals.com)Spectrofluorimetry (www.redicals.com)
Spectrofluorimetry (www.redicals.com)
Goa App
 
Spectrofluorimetry or fluorimetry (www.Redicals.com)
Spectrofluorimetry or fluorimetry (www.Redicals.com)Spectrofluorimetry or fluorimetry (www.Redicals.com)
Spectrofluorimetry or fluorimetry (www.Redicals.com)
Goa App
 
Fluorometry LG Chatten MANIK
Fluorometry LG Chatten MANIKFluorometry LG Chatten MANIK
Fluorometry LG Chatten MANIK
Imran Nur Manik
 
photophysical process
photophysical processphotophysical process
photophysical process
Ishfaq Ahmad
 
3.2 molecular fluorescence and phosphorescence spectroscopy
3.2 molecular fluorescence and phosphorescence spectroscopy3.2 molecular fluorescence and phosphorescence spectroscopy
3.2 molecular fluorescence and phosphorescence spectroscopy
GaneshBhagure2
 
Basic photochemistry
Basic photochemistryBasic photochemistry
Basic photochemistry
Harish Chopra
 
Basic photochemistry
Basic photochemistryBasic photochemistry
Basic photochemistry
Harish Chopra
 
Phosphorimetry
PhosphorimetryPhosphorimetry
Phosphorimetry
Ayesha Ghafoor
 
Fluorescence
FluorescenceFluorescence
Fluorescence
movvaharshavardhan
 
basic principles of fluorescence
basic principles of fluorescencebasic principles of fluorescence
basic principles of fluorescence
junior research fellow
 
Spectrofluorimetry
SpectrofluorimetrySpectrofluorimetry
Spectrofluorimetry
Mineeta Mahra
 

Similar to Fluorescence microscopy Likhith K (20)

Fluoroscence 1.pptx
Fluoroscence 1.pptxFluoroscence 1.pptx
Fluoroscence 1.pptx
 
Fluorescence spectroscopy
Fluorescence spectroscopyFluorescence spectroscopy
Fluorescence spectroscopy
 
Fluorimetry, principle, Concept of singlet,doublet,and triplet electronic sta...
Fluorimetry, principle, Concept of singlet,doublet,and triplet electronic sta...Fluorimetry, principle, Concept of singlet,doublet,and triplet electronic sta...
Fluorimetry, principle, Concept of singlet,doublet,and triplet electronic sta...
 
rana.pptx
rana.pptxrana.pptx
rana.pptx
 
Luminiscence spectroscopy assignment 1624
Luminiscence spectroscopy assignment 1624Luminiscence spectroscopy assignment 1624
Luminiscence spectroscopy assignment 1624
 
Photoluminescence
PhotoluminescencePhotoluminescence
Photoluminescence
 
Fluorescence , Phosphorescence and photoluminescence
Fluorescence , Phosphorescence and photoluminescenceFluorescence , Phosphorescence and photoluminescence
Fluorescence , Phosphorescence and photoluminescence
 
Fluorescence and phosphorescence
Fluorescence and phosphorescenceFluorescence and phosphorescence
Fluorescence and phosphorescence
 
Fluorometry Manik
Fluorometry Manik Fluorometry Manik
Fluorometry Manik
 
Spectrofluorimetry (www.redicals.com)
Spectrofluorimetry (www.redicals.com)Spectrofluorimetry (www.redicals.com)
Spectrofluorimetry (www.redicals.com)
 
Spectrofluorimetry or fluorimetry (www.Redicals.com)
Spectrofluorimetry or fluorimetry (www.Redicals.com)Spectrofluorimetry or fluorimetry (www.Redicals.com)
Spectrofluorimetry or fluorimetry (www.Redicals.com)
 
Fluorometry LG Chatten MANIK
Fluorometry LG Chatten MANIKFluorometry LG Chatten MANIK
Fluorometry LG Chatten MANIK
 
photophysical process
photophysical processphotophysical process
photophysical process
 
3.2 molecular fluorescence and phosphorescence spectroscopy
3.2 molecular fluorescence and phosphorescence spectroscopy3.2 molecular fluorescence and phosphorescence spectroscopy
3.2 molecular fluorescence and phosphorescence spectroscopy
 
Basic photochemistry
Basic photochemistryBasic photochemistry
Basic photochemistry
 
Basic photochemistry
Basic photochemistryBasic photochemistry
Basic photochemistry
 
Phosphorimetry
PhosphorimetryPhosphorimetry
Phosphorimetry
 
Fluorescence
FluorescenceFluorescence
Fluorescence
 
basic principles of fluorescence
basic principles of fluorescencebasic principles of fluorescence
basic principles of fluorescence
 
Spectrofluorimetry
SpectrofluorimetrySpectrofluorimetry
Spectrofluorimetry
 

More from LIKHITHK1

Structure and function of immunoglobulins(antibodies) Likhith K
Structure and function of immunoglobulins(antibodies) Likhith KStructure and function of immunoglobulins(antibodies) Likhith K
Structure and function of immunoglobulins(antibodies) Likhith K
LIKHITHK1
 
Quantitative estimation of carbohydrates Likhith K
Quantitative estimation of carbohydrates Likhith KQuantitative estimation of carbohydrates Likhith K
Quantitative estimation of carbohydrates Likhith K
LIKHITHK1
 
Polymerase Chain Reaction(PCR) Likhith K
Polymerase Chain Reaction(PCR) Likhith KPolymerase Chain Reaction(PCR) Likhith K
Polymerase Chain Reaction(PCR) Likhith K
LIKHITHK1
 
Biopolymers Likhith K
Biopolymers Likhith KBiopolymers Likhith K
Biopolymers Likhith K
LIKHITHK1
 
Quantitative estimation of protein Likhith K
Quantitative estimation of protein Likhith KQuantitative estimation of protein Likhith K
Quantitative estimation of protein Likhith K
LIKHITHK1
 
Phase contrast microscopy Likhith K
Phase contrast microscopy Likhith KPhase contrast microscopy Likhith K
Phase contrast microscopy Likhith K
LIKHITHK1
 
Confocal microscopy Likhith K
Confocal microscopy Likhith KConfocal microscopy Likhith K
Confocal microscopy Likhith K
LIKHITHK1
 
Atomic force microscopy (AFM) Likhith K
Atomic force microscopy (AFM) Likhith KAtomic force microscopy (AFM) Likhith K
Atomic force microscopy (AFM) Likhith K
LIKHITHK1
 
Transmission electron microscope (TEM) Likhith K
Transmission electron microscope  (TEM) Likhith KTransmission electron microscope  (TEM) Likhith K
Transmission electron microscope (TEM) Likhith K
LIKHITHK1
 
Scanning electron microscopy (SEM) Likhith K
Scanning electron microscopy (SEM) Likhith KScanning electron microscopy (SEM) Likhith K
Scanning electron microscopy (SEM) Likhith K
LIKHITHK1
 
Crystallography and X-ray diffraction (XRD) Likhith K
Crystallography and X-ray diffraction (XRD) Likhith KCrystallography and X-ray diffraction (XRD) Likhith K
Crystallography and X-ray diffraction (XRD) Likhith K
LIKHITHK1
 
Fourier transform infrared spectroscopy (FTIR) Likhith K
Fourier transform infrared spectroscopy (FTIR) Likhith KFourier transform infrared spectroscopy (FTIR) Likhith K
Fourier transform infrared spectroscopy (FTIR) Likhith K
LIKHITHK1
 
Ultraviolet visible (uv vis) spectroscopy Likhith K
Ultraviolet visible (uv vis) spectroscopy Likhith KUltraviolet visible (uv vis) spectroscopy Likhith K
Ultraviolet visible (uv vis) spectroscopy Likhith K
LIKHITHK1
 
Enzymes principles and applications Likhith K
Enzymes principles and applications  Likhith KEnzymes principles and applications  Likhith K
Enzymes principles and applications Likhith K
LIKHITHK1
 
Cheese production by Likhith K
Cheese production by Likhith KCheese production by Likhith K
Cheese production by Likhith K
LIKHITHK1
 
Design of fermentor Likhith K
Design of fermentor Likhith KDesign of fermentor Likhith K
Design of fermentor Likhith K
LIKHITHK1
 
Penicillin production by Likhith K
Penicillin production by Likhith KPenicillin production by Likhith K
Penicillin production by Likhith K
LIKHITHK1
 
Beer production by Likhith K
Beer production by Likhith KBeer production by Likhith K
Beer production by Likhith K
LIKHITHK1
 
Chromatography and types Likhith K
Chromatography and types Likhith KChromatography and types Likhith K
Chromatography and types Likhith K
LIKHITHK1
 
Vitamins Likhith K
Vitamins Likhith KVitamins Likhith K
Vitamins Likhith K
LIKHITHK1
 

More from LIKHITHK1 (20)

Structure and function of immunoglobulins(antibodies) Likhith K
Structure and function of immunoglobulins(antibodies) Likhith KStructure and function of immunoglobulins(antibodies) Likhith K
Structure and function of immunoglobulins(antibodies) Likhith K
 
Quantitative estimation of carbohydrates Likhith K
Quantitative estimation of carbohydrates Likhith KQuantitative estimation of carbohydrates Likhith K
Quantitative estimation of carbohydrates Likhith K
 
Polymerase Chain Reaction(PCR) Likhith K
Polymerase Chain Reaction(PCR) Likhith KPolymerase Chain Reaction(PCR) Likhith K
Polymerase Chain Reaction(PCR) Likhith K
 
Biopolymers Likhith K
Biopolymers Likhith KBiopolymers Likhith K
Biopolymers Likhith K
 
Quantitative estimation of protein Likhith K
Quantitative estimation of protein Likhith KQuantitative estimation of protein Likhith K
Quantitative estimation of protein Likhith K
 
Phase contrast microscopy Likhith K
Phase contrast microscopy Likhith KPhase contrast microscopy Likhith K
Phase contrast microscopy Likhith K
 
Confocal microscopy Likhith K
Confocal microscopy Likhith KConfocal microscopy Likhith K
Confocal microscopy Likhith K
 
Atomic force microscopy (AFM) Likhith K
Atomic force microscopy (AFM) Likhith KAtomic force microscopy (AFM) Likhith K
Atomic force microscopy (AFM) Likhith K
 
Transmission electron microscope (TEM) Likhith K
Transmission electron microscope  (TEM) Likhith KTransmission electron microscope  (TEM) Likhith K
Transmission electron microscope (TEM) Likhith K
 
Scanning electron microscopy (SEM) Likhith K
Scanning electron microscopy (SEM) Likhith KScanning electron microscopy (SEM) Likhith K
Scanning electron microscopy (SEM) Likhith K
 
Crystallography and X-ray diffraction (XRD) Likhith K
Crystallography and X-ray diffraction (XRD) Likhith KCrystallography and X-ray diffraction (XRD) Likhith K
Crystallography and X-ray diffraction (XRD) Likhith K
 
Fourier transform infrared spectroscopy (FTIR) Likhith K
Fourier transform infrared spectroscopy (FTIR) Likhith KFourier transform infrared spectroscopy (FTIR) Likhith K
Fourier transform infrared spectroscopy (FTIR) Likhith K
 
Ultraviolet visible (uv vis) spectroscopy Likhith K
Ultraviolet visible (uv vis) spectroscopy Likhith KUltraviolet visible (uv vis) spectroscopy Likhith K
Ultraviolet visible (uv vis) spectroscopy Likhith K
 
Enzymes principles and applications Likhith K
Enzymes principles and applications  Likhith KEnzymes principles and applications  Likhith K
Enzymes principles and applications Likhith K
 
Cheese production by Likhith K
Cheese production by Likhith KCheese production by Likhith K
Cheese production by Likhith K
 
Design of fermentor Likhith K
Design of fermentor Likhith KDesign of fermentor Likhith K
Design of fermentor Likhith K
 
Penicillin production by Likhith K
Penicillin production by Likhith KPenicillin production by Likhith K
Penicillin production by Likhith K
 
Beer production by Likhith K
Beer production by Likhith KBeer production by Likhith K
Beer production by Likhith K
 
Chromatography and types Likhith K
Chromatography and types Likhith KChromatography and types Likhith K
Chromatography and types Likhith K
 
Vitamins Likhith K
Vitamins Likhith KVitamins Likhith K
Vitamins Likhith K
 

Recently uploaded

insect morphology and physiology of insect
insect morphology and physiology of insectinsect morphology and physiology of insect
insect morphology and physiology of insect
anitaento25
 
EY - Supply Chain Services 2018_template.pptx
EY - Supply Chain Services 2018_template.pptxEY - Supply Chain Services 2018_template.pptx
EY - Supply Chain Services 2018_template.pptx
AlguinaldoKong
 
PRESENTATION ABOUT PRINCIPLE OF COSMATIC EVALUATION
PRESENTATION ABOUT PRINCIPLE OF COSMATIC EVALUATIONPRESENTATION ABOUT PRINCIPLE OF COSMATIC EVALUATION
PRESENTATION ABOUT PRINCIPLE OF COSMATIC EVALUATION
ChetanK57
 
(May 29th, 2024) Advancements in Intravital Microscopy- Insights for Preclini...
(May 29th, 2024) Advancements in Intravital Microscopy- Insights for Preclini...(May 29th, 2024) Advancements in Intravital Microscopy- Insights for Preclini...
(May 29th, 2024) Advancements in Intravital Microscopy- Insights for Preclini...
Scintica Instrumentation
 
Citrus Greening Disease and its Management
Citrus Greening Disease and its ManagementCitrus Greening Disease and its Management
Citrus Greening Disease and its Management
subedisuryaofficial
 
Viksit bharat till 2047 India@2047.pptx
Viksit bharat till 2047  India@2047.pptxViksit bharat till 2047  India@2047.pptx
Viksit bharat till 2047 India@2047.pptx
rakeshsharma20142015
 
filosofia boliviana introducción jsjdjd.pptx
filosofia boliviana introducción jsjdjd.pptxfilosofia boliviana introducción jsjdjd.pptx
filosofia boliviana introducción jsjdjd.pptx
IvanMallco1
 
Cancer cell metabolism: special Reference to Lactate Pathway
Cancer cell metabolism: special Reference to Lactate PathwayCancer cell metabolism: special Reference to Lactate Pathway
Cancer cell metabolism: special Reference to Lactate Pathway
AADYARAJPANDEY1
 
Astronomy Update- Curiosity’s exploration of Mars _ Local Briefs _ leadertele...
Astronomy Update- Curiosity’s exploration of Mars _ Local Briefs _ leadertele...Astronomy Update- Curiosity’s exploration of Mars _ Local Briefs _ leadertele...
Astronomy Update- Curiosity’s exploration of Mars _ Local Briefs _ leadertele...
NathanBaughman3
 
SCHIZOPHRENIA Disorder/ Brain Disorder.pdf
SCHIZOPHRENIA Disorder/ Brain Disorder.pdfSCHIZOPHRENIA Disorder/ Brain Disorder.pdf
SCHIZOPHRENIA Disorder/ Brain Disorder.pdf
SELF-EXPLANATORY
 
Unveiling the Energy Potential of Marshmallow Deposits.pdf
Unveiling the Energy Potential of Marshmallow Deposits.pdfUnveiling the Energy Potential of Marshmallow Deposits.pdf
Unveiling the Energy Potential of Marshmallow Deposits.pdf
Erdal Coalmaker
 
Multi-source connectivity as the driver of solar wind variability in the heli...
Multi-source connectivity as the driver of solar wind variability in the heli...Multi-source connectivity as the driver of solar wind variability in the heli...
Multi-source connectivity as the driver of solar wind variability in the heli...
Sérgio Sacani
 
Mammalian Pineal Body Structure and Also Functions
Mammalian Pineal Body Structure and Also FunctionsMammalian Pineal Body Structure and Also Functions
Mammalian Pineal Body Structure and Also Functions
YOGESH DOGRA
 
Predicting property prices with machine learning algorithms.pdf
Predicting property prices with machine learning algorithms.pdfPredicting property prices with machine learning algorithms.pdf
Predicting property prices with machine learning algorithms.pdf
binhminhvu04
 
Observation of Io’s Resurfacing via Plume Deposition Using Ground-based Adapt...
Observation of Io’s Resurfacing via Plume Deposition Using Ground-based Adapt...Observation of Io’s Resurfacing via Plume Deposition Using Ground-based Adapt...
Observation of Io’s Resurfacing via Plume Deposition Using Ground-based Adapt...
Sérgio Sacani
 
RNA INTERFERENCE: UNRAVELING GENETIC SILENCING
RNA INTERFERENCE: UNRAVELING GENETIC SILENCINGRNA INTERFERENCE: UNRAVELING GENETIC SILENCING
RNA INTERFERENCE: UNRAVELING GENETIC SILENCING
AADYARAJPANDEY1
 
Nutraceutical market, scope and growth: Herbal drug technology
Nutraceutical market, scope and growth: Herbal drug technologyNutraceutical market, scope and growth: Herbal drug technology
Nutraceutical market, scope and growth: Herbal drug technology
Lokesh Patil
 
platelets_clotting_biogenesis.clot retractionpptx
platelets_clotting_biogenesis.clot retractionpptxplatelets_clotting_biogenesis.clot retractionpptx
platelets_clotting_biogenesis.clot retractionpptx
muralinath2
 
GBSN- Microbiology (Lab 3) Gram Staining
GBSN- Microbiology (Lab 3) Gram StainingGBSN- Microbiology (Lab 3) Gram Staining
GBSN- Microbiology (Lab 3) Gram Staining
Areesha Ahmad
 
Body fluids_tonicity_dehydration_hypovolemia_hypervolemia.pptx
Body fluids_tonicity_dehydration_hypovolemia_hypervolemia.pptxBody fluids_tonicity_dehydration_hypovolemia_hypervolemia.pptx
Body fluids_tonicity_dehydration_hypovolemia_hypervolemia.pptx
muralinath2
 

Recently uploaded (20)

insect morphology and physiology of insect
insect morphology and physiology of insectinsect morphology and physiology of insect
insect morphology and physiology of insect
 
EY - Supply Chain Services 2018_template.pptx
EY - Supply Chain Services 2018_template.pptxEY - Supply Chain Services 2018_template.pptx
EY - Supply Chain Services 2018_template.pptx
 
PRESENTATION ABOUT PRINCIPLE OF COSMATIC EVALUATION
PRESENTATION ABOUT PRINCIPLE OF COSMATIC EVALUATIONPRESENTATION ABOUT PRINCIPLE OF COSMATIC EVALUATION
PRESENTATION ABOUT PRINCIPLE OF COSMATIC EVALUATION
 
(May 29th, 2024) Advancements in Intravital Microscopy- Insights for Preclini...
(May 29th, 2024) Advancements in Intravital Microscopy- Insights for Preclini...(May 29th, 2024) Advancements in Intravital Microscopy- Insights for Preclini...
(May 29th, 2024) Advancements in Intravital Microscopy- Insights for Preclini...
 
Citrus Greening Disease and its Management
Citrus Greening Disease and its ManagementCitrus Greening Disease and its Management
Citrus Greening Disease and its Management
 
Viksit bharat till 2047 India@2047.pptx
Viksit bharat till 2047  India@2047.pptxViksit bharat till 2047  India@2047.pptx
Viksit bharat till 2047 India@2047.pptx
 
filosofia boliviana introducción jsjdjd.pptx
filosofia boliviana introducción jsjdjd.pptxfilosofia boliviana introducción jsjdjd.pptx
filosofia boliviana introducción jsjdjd.pptx
 
Cancer cell metabolism: special Reference to Lactate Pathway
Cancer cell metabolism: special Reference to Lactate PathwayCancer cell metabolism: special Reference to Lactate Pathway
Cancer cell metabolism: special Reference to Lactate Pathway
 
Astronomy Update- Curiosity’s exploration of Mars _ Local Briefs _ leadertele...
Astronomy Update- Curiosity’s exploration of Mars _ Local Briefs _ leadertele...Astronomy Update- Curiosity’s exploration of Mars _ Local Briefs _ leadertele...
Astronomy Update- Curiosity’s exploration of Mars _ Local Briefs _ leadertele...
 
SCHIZOPHRENIA Disorder/ Brain Disorder.pdf
SCHIZOPHRENIA Disorder/ Brain Disorder.pdfSCHIZOPHRENIA Disorder/ Brain Disorder.pdf
SCHIZOPHRENIA Disorder/ Brain Disorder.pdf
 
Unveiling the Energy Potential of Marshmallow Deposits.pdf
Unveiling the Energy Potential of Marshmallow Deposits.pdfUnveiling the Energy Potential of Marshmallow Deposits.pdf
Unveiling the Energy Potential of Marshmallow Deposits.pdf
 
Multi-source connectivity as the driver of solar wind variability in the heli...
Multi-source connectivity as the driver of solar wind variability in the heli...Multi-source connectivity as the driver of solar wind variability in the heli...
Multi-source connectivity as the driver of solar wind variability in the heli...
 
Mammalian Pineal Body Structure and Also Functions
Mammalian Pineal Body Structure and Also FunctionsMammalian Pineal Body Structure and Also Functions
Mammalian Pineal Body Structure and Also Functions
 
Predicting property prices with machine learning algorithms.pdf
Predicting property prices with machine learning algorithms.pdfPredicting property prices with machine learning algorithms.pdf
Predicting property prices with machine learning algorithms.pdf
 
Observation of Io’s Resurfacing via Plume Deposition Using Ground-based Adapt...
Observation of Io’s Resurfacing via Plume Deposition Using Ground-based Adapt...Observation of Io’s Resurfacing via Plume Deposition Using Ground-based Adapt...
Observation of Io’s Resurfacing via Plume Deposition Using Ground-based Adapt...
 
RNA INTERFERENCE: UNRAVELING GENETIC SILENCING
RNA INTERFERENCE: UNRAVELING GENETIC SILENCINGRNA INTERFERENCE: UNRAVELING GENETIC SILENCING
RNA INTERFERENCE: UNRAVELING GENETIC SILENCING
 
Nutraceutical market, scope and growth: Herbal drug technology
Nutraceutical market, scope and growth: Herbal drug technologyNutraceutical market, scope and growth: Herbal drug technology
Nutraceutical market, scope and growth: Herbal drug technology
 
platelets_clotting_biogenesis.clot retractionpptx
platelets_clotting_biogenesis.clot retractionpptxplatelets_clotting_biogenesis.clot retractionpptx
platelets_clotting_biogenesis.clot retractionpptx
 
GBSN- Microbiology (Lab 3) Gram Staining
GBSN- Microbiology (Lab 3) Gram StainingGBSN- Microbiology (Lab 3) Gram Staining
GBSN- Microbiology (Lab 3) Gram Staining
 
Body fluids_tonicity_dehydration_hypovolemia_hypervolemia.pptx
Body fluids_tonicity_dehydration_hypovolemia_hypervolemia.pptxBody fluids_tonicity_dehydration_hypovolemia_hypervolemia.pptx
Body fluids_tonicity_dehydration_hypovolemia_hypervolemia.pptx
 

Fluorescence microscopy Likhith K

  • 1. FLUORESCENCE MICROSCOPY By Mr. LIKHITH K (Research Scholar) Department of Biomedical Engineering Manipal Institute of Technology Eshwar Nagar, Manipal, Karnataka- 576104
  • 2. CONTENTS Introduction Fluorescence characterization Brief history Green fluorescent protein (GFP) Resolution of fluoresce microscope Sample preparation Application Conclusion Reference
  • 3. INTRODUCTION Fluorescence microscopy provides an efficient and unique approach to study fixed and living cells because of its versatility, specificity, and high sensitivity. Fluorescence microscopes can both detect the fluorescence emitted from labeled molecules in biological samples as images or photometric data from which intensities and emission spectra can be deduced. By exploiting the characteristics of fluorescence, various techniques have been developed that enable the visualization and analysis of complex dynamic events in cells, organelles, and sub-organelle components within the biological specimen. The most common techniques are 1) Fluorescence recovery after photo bleaching (FRAP) 2) Fluorescence loss in photo bleaching (FLIP) 3) Fluorescence localization after photo bleaching (FLAP) 4) Fluorescence resonance energy transfer (FRET) And the different ways to measure FRET are such as 1) Acceptor bleaching 2) Sensitized emission 3) Polarization anisotropy 4) Fluorescence lifetime imaging microscopy (FLIM)
  • 4. The Physical Phenomenon of Fluorescence Fluorescence as a phenomenon is part of a larger family of related luminescent processes in which a susceptible substance absorbs light, only to reemit light (photons) from electronically excited states after a given time (Figure 1).  Photo luminescent processes that are generated through excitation, whether this is via physical, mechanical, or chemical mechanisms, can generally be subdivided into fluorescence and phosphorescence. Absorption of a light quantum (blue) causes an electron to move to a higher energy orbit. After residing in this “excited state” for a particular time, the fluorescence lifetime, the electron falls back to its original orbit and the fluorochrome dissipates the excess energy by emitting a photon (green). Figure1 Schematic representation of the fluorescence phenomenon in the classical Bohr model.
  • 5. Compounds that display fluorescent properties are generally termed fluorescent probes or dyes. Often ‘fluorochrome’ and ‘fluorophore’ are used interchangeably. The term ‘fluorophore’ refers to fluorochromes that are conjugated covalently or through adsorption to biological macromolecules, such as nucleic acids, lipids, or proteins. Fluorochromes come in different flavors and include 1) organic molecules (dyes) 2) inorganic ions (e.g., lanthanide ions such as Eu, Tb, Yb, etc.) 3) fluorescent proteins (e.g., green fluorescent protein) 4) atoms (such as gaseous mercury in glass light tubes) Some commonly used fluorochromes are listed in Table 1 and 2. Recently, inorganic luminescent semiconducting nanoparticles, quantum dots, have been introduced as labels for biological assays, bio-imaging applications, and theragnostic purposes (the combination of diagnostic and therapeutic modalities in one and the same particle).
  • 6. Table 1 Some fluorochromes used to label proteins
  • 7. Table 2 Some fluorochromes used to stain nucleic acids fluorochrome abbreviation absorption emission
  • 8. Fluorescence follows a series of discrete steps of which the outcome is the emittance of a photon with a longer wavelength Figure 2 Process which can be visualized in more detail via the Jabłoński diagram
  • 9. When light of a particular wavelength hits a fluorescent sample, the atoms, ions or molecules therein absorb a specific quantum of light, which pushes a valence electron (outer most shell electrons) from the ground state (GS0). This initial state is an electronic singlet in which all electrons have opposite spin and the net spin is 0 Jumping into a higher energy level , creating an excited state (Esn). This process is fast and in the femtosecond range and requires at least the energy to bridge the gap between excited and ground states in order for excitation to occur. ΔE = EESn − EGS0 The energy of photons involved in fluorescence and generally a quantum of light can be expressed via Planck’s law : E =hv = h (c/λ) where E is the quantum’s energy (J) h is Planck's constant (J.s) ν the frequency (s−1) λ is the wavelength of the photon (m) c is the speed of light (m.s−1) However, there are several excited state sublevels (vibrational levels) and which level is reached primarily depends on the fluorescent species’ properties.
  • 10. After excitation to the higher energy level ESn, the electron quickly relaxes to the lowest possible excited sublevel, which is in the picosecond range. The energy decay from dropping to a lower vibrational sublevel occurs through intramolecular non-radiative conversions and the converted heat is absorbed via collision of the excited state fluorescent molecule with the solvent molecules. Emission spectra are usually independent of the excitation wavelength because of this rapid relaxation to the lowest vibrational level of the excited state, which is known, as Kasha’s rule. In most cases, absorption and emission transitions involve the same energetic levels as schematically shown in Figure 3. For this reason and the fact that excitation is instantaneous, involving electrons only and leaving the heavier nuclei in place, many fluorochromes display near mirror image absorption and emission spectra (mirror image rule), although many exceptions exist. Intersystem crossing is the slowest energy dissipation pathway, because the electron has to change spin multiplicity from an excited singlet state to an excited triplet state (Figure 2 B). Intersystem crossing is mostly observed in molecules containing heavy atoms such as iodine or bromine or in paramagnetic species.
  • 11. Figure 3 Absorption and emission transitions involve the same energetic levels as schematically shown below.
  • 12. The difference between the excitation and emission maxima is called “Stokes shift”. It is caused by a quick electron relaxation and intramolecular vibrational energy loss taking place between the different excited state sublevels. That is the reason why the excitation light normally has a shorter wavelength (i.e., higher energy) than the emission light (i.e., lower energy). In many fluorochromes, the same electronic transitions are involved in both excitation and emission, which leads to near-mirror image spectra. Lanthanide ions are good examples of luminescent probes that show delayed fluorescence. The term “luminescence” is normally used when discussing lanthanide-based emission, because “fluorescence” refers to spin allowed singlet-to-singlet emission, whereas in lanthanide ions, emission is due to intra- configurational f-f transitions (transitions inside the 4f shell). As a result they have fluorescence lifetimes in the (sub)microsecond range for Yb(III) and Nd(III), whereas Eu(III), Tb(III) and Sm(III) have even longer lifetimes in the (sub)millisecond range. This is significantly longer than the lifetimes of organic fluorochromes and fluorescent proteins which are generally in the nanosecond range. Because of the large lifetime difference to fluorescence, lanthanide emission should easily be distinguishable from fluorescence emission by time-gating techniques.
  • 13. When the electron finally returns to the lower energy level it originated from, the ground state GS0, a quantum of light (photon) is emitted with a longer wavelength, which is an allowed transition since the spin is retained. In most fluorochromes, photon emission is produced by a π*→π or π*→n transition, depending on which requires the least energy for the transition to occur. In contrast, σ*→ σ transitions are rare since the required UV light (below 250 nm) is energetic enough to deactivate the excited state electron by pre dissociation (internal conversion to a GS0 that is at such a high vibrational level that the bond breaks) or dissociation (the bond breaks at a vibrational excited state). Photon emittance from singlet states with an average time-scale between 10−9 and 10−6 seconds is slow compared with the absorption of photons. This resulting emitted radiation is called fluorescence and in the simplest form of fluorescence microscopy, this emitted light is collected and transported to the detector through the same objective lens used to focus the excitation light onto the sample.(Figure 4). Fluorochromes can enter repetitive cycles of excitation and emission as long as no destruction or covalent modification occurs that irreversibly interrupts this process. The transition from the meta-stable triplet state ET1 to the ground state GS0 is, because of the necessary spin reversal, forbidden and therefore several orders of magnitude slower than fluorescence, i.e., thus called phosphorescence. Consequently, the emission takes place over long periods of time in some materials it takes several seconds to even minutes.
  • 14. Figure 4 In fluorescence microscopy the sample is illuminated with excitation light and the emitted light (the fluorescence) is detected through the same objective (epi-fluorescence microscopy).
  • 15. Fluorescence emission generally occurs at longer wavelengths and concomitant lower energy than the light used to excite the fluorochrome, provided that a single photon is involved during excitation. It was the British scientist Sir George Stokes who first observed fluorescence when irradiating fluorspar (fluorite) with UV radiation and a red-shift in the resulting emitted light, which he reported in his 1852 publication “on the change of refrangibility of light”. The difference between the emission and excitation maxima is called “Stokes shift” (Figure 3). The Stokes shift varies markedly among different fluorochromes. Note anti-Stokes shifts in which the emission wavelength is smaller than the excitation wavelength are also possible, for instance during photon up conversion or two-photon excitation. Anti-Stokes fluorescence also occurs commonly in fluorochromes in which absorption and emission spectra overlap substantially. Therefore fluorochromes not only have characteristic excitation spectra, but also characteristic emission spectra that are dependent on their specific vibronic configuration and properties.
  • 16. FLUORESCENCE CHARACTERISTICS Some of the essential characteristics and parameters of fluorescence that are utilized in fluorescence microscopy, such as 1) The fluorescence life time 2) Quantum yield 3) Anisotropy 4) Quenching 5) Photobleaching 6) Fluorescence intermittency / blinking 7) Autoflurosence 8) Resonance energy transfer 9) Energy transfer
  • 17. 1. Quantum yield: The quantum yield (Ф) basically determines how bright a fluorochrome’s emission is. It is given by the ratio of the number of emitted to absorbed photons, which is determined by the rate constants of emission (Γ) and the sum of all non-radiative decay processes (knr) that depopulate the excited state. The quantum yield, as many intrinsic fluorescence parameters, is sensitive to environmental influences, such a solvent polarization, pH, fluorochrome concentration, and the presence of molecules affecting the excited state, such as molecular oxygen.
  • 18. 2. Fluorescence lifetime: The fluorochrome’s fluorescence lifetime (τ) is the average time the electron spends in the excited state before returning to the ground state. In other words, the depopulation of excited state molecules through radiative (Γ) and non-radiative processes (knr) follows an exponential decay and the time of this process is basically the fluorescence lifetime
  • 19. 3. Anisotropy: This refers to the quality of having different properties along different axes: in a pool of randomly oriented fluorochromes, only those fluorochromes with transition dipole moments that are aligned (near) parallel to the polarization direction of the excitation beam (linearly polarized) will be excited (photo selection). Fluorescence polarization is determined by the orientation of the fluorochromes’ transition moment at the instant of emission, which allows the determination of the fluorochromes’ rotation by measuring their anisotropy. Theoretically, the maximal anisotropy is achieved when the emission transition dipole moment is exactly parallel to the absorption transition dipole moment.
  • 20. 4. Fluorescence quenching: Quenching is a phenomenon by which interaction of a molecule, the quencher, with the fluorochrome reduces the quantum yield or the lifetime. Quenching phenomena can be subdivided into: 1) Dynamic quenching occurs through collision of the quencher and the excited state fluorochrome, which leads to a decrease in the lifetime and emission intensity. 2) Static quenching arises from direct interaction of the fluorochrome and quenching molecules, for instance by forming a non-fluorescent ground state complex. This form of quenching does not necessarily decrease the measured emission lifetime and often occurs simultaneous with dynamic quenching. 3) Self-quenching or concentration quenching, the fluorochrome quenches its own fluorescence because of close proximity of identical molecules at high concentration. Self-quenching occurs in particular in biomembranes, where the lipid bilayer behaves as a 2D fluid with different domains of fluidity where fluorochromes can be concentrated or when labeling proteins with multiple labels. 4) Color-quenching is a process in which emitted photons are absorbed by a strongly colored component such as β-carotene. This leads to a decrease in intensity, but not the fluorescence lifetime.
  • 21. 5. Fluorescence intermittency or “blinking”: This phenomenon occurs when the fluorochrome randomly alternates between a fluorescent (“on”) and dark state (“off”) despite continuous excitation illumination. As a result, when tracking single fluorochromes, a stroboscopic effect may interfere with the tracking procedure. Blinking generally follows power law statistics and occurs commonly in luminescent nanoparticles, but also in some organic dyes, and fluorescent proteins. The random nature and power law dynamics generally frustrates and precludes comparison of results between independent experiments, because the “on” and “off” time distributions can significantly differ.
  • 22. 6. Autofluorescence: Fluorescence that does not originate from the fluorochrome of interest (FOI), but rather from cellular components that have fluorescent properties, most notably flavins, e.g., FAD+ and riboflavin, NAD(P)H, and extracellular matrix components, e.g., elastin and collagen, but also retinol, folic acid, lipofuscin, and chlorophyll. The autofluorescence window approximately encompasses the range from 350 nm to 600 nm and can effectively be avoided by a number of strategies: 1) Precise filtering of the FOI signal with narrow band pass optical filters, 2) The use of probes that fluoresce outside the autofluorescence window, commonly in the (near) infrared (NIR) region, 3) The use of time-resolved techniques (autofluorescent bio fluorochromes have distinctly different lifetimes), 4) The use of up converting fluorochromes that allow excitation in the IR; (v) multispectral imaging (recording spectra in every pixel), and (vi) spectral un mixing (mathematical disentangling of mixed emission signals).
  • 23. 7. Photobleaching: Photobleaching or “fading” is a photochemical process in which the fluorochrome’s ability to enter repetitive excitation is permanently interrupted by destruction or irreversible covalent modification of the fluorochrome by reaction with surrounding biomolecules. Photodestructive and photochemical processes occur predominantly when the fluorochrome is in the dark triplet excited state, which is longer lived than singlet states and exhibits a high degree of chemical reactivity.
  • 24. 8. Resonance energy transfer: This is a photophysical process in which the excited state energy from a donor fluorochrome is transferred via a non-radiative mechanism to a ground state acceptor chromophore via weak long-range dipole–dipole coupling. The theoretical basis for the molecular interactions involved in resonance energy transfer was first described by Theodor Förster in the 1940s.
  • 25. 9. Charge-transfer complexes: These are nanosecond short-lived homodimers (excimer) or heterodimers (exciplex) of two molecules of which at least one is in the excited state that show red-shifted emission compared with the monomer’s emission. Such complexes occur via electrostatic attraction because of partial electronic charge transfer between the individual entities. The individual ground state monomers would normally not associate and the monomers in the complex dissociate and repel each other once relaxation to the ground state occurs. Since these complexes require close proximity, excimer and exciplex formation require high concentrations of the monomers.
  • 26. BRIEF HISTORY The first fluorescence microscopes were developed at the beginning of the 20th century. In 1904, August Köhler constructed an ultraviolet (UV) illumination microscope at Zeiss Optical Works in Jena, Germany, in which he used a cadmium arc lamp as a light source. However, it was Oskar Heimstädt who developed the first working fluorescence microscope in 1911, with which he studied autofluorescence in organic and inorganic compounds . Still, these early fluorescence microscopes suffered from several drawbacks, including the fact that the light sources at that time did not have enough power to excite fluorochromes at high enough rates and that effective separation of the fluorescence signal from the excitation light was difficult to achieve. In order to obtain sufficient signal, Heimstädt had to rely on darkfield illumination, which ensured that only a limited amount of excitation light would enter the objective lens, but this was a technically challenging method and certainly not suited for developing fluorescence microscopy as a mainstream tool. The invention of the epi-fluorescence microscope in 1929 by Philipp Ellinger and August Hirt was a major step forward to achieving this goal.
  • 27. Figure 5 Anatomy of an epi-illumination fluorescence microscope.
  • 28. In the 1930s the Austrian Max Haitingen and others developed the technique of ‘secondary fluorescence’ in which samples were systematically stained with fluorescent dyes, initially simply to make the weak autofluorescent biological samples better visible. Haitingen also was the first to introduce the word ‘fluorochrome’ for these fluorescent stains. In the early 1940s, Albert Coons developed the technique of labeling antibodies with fluorescent dyes . This was a breakthrough, as it allowed to specifically label proteins and subcellular structures and as a result made these molecular structures visible in a contrast and resolution never seen before. Since these first experiments, antibody staining with fluorescent secondary markers has become a standard method in biological and biomedical research, and clinical diagnostics for fixed samples, including tissues and single cells. Furthermore, a significant increase in fluorescence signal can be achieved with these fluorochromes over the weak autofluorescent endogenous biological species. The lack of excitation power was resolved with the development of lasers in the 1960s based on Einstein’s theoretical foundations regarding stimulated emission by Gould, Townes, Schawlow, and Maiman. Lasers offered what other light sources could not: a high degree of spatial and temporal coherence, which means that the diffraction limited monochromatic and coherent beam can be focused in a tiny spot, achieving a very high local irradiance. Furthermore, it now became possible to effectively separate signals by using suitable filters and dichroic mirrors (also called dichromatic beam splitters). (figure 5) The latter are specialized interference filters that selectively allow passage of light in a particular wavelength range, while reflecting other wavelengths when placed into the light path at a 45° angle (Figure 5).
  • 29. GREEN FLUORESCENT PROTEIN (GFP) The next foremost breakthrough that resulted in an explosion in both instrument and technique development and concurrently biological research was the discovery in the 1960s, sequencing and subsequent development of green fluorescent protein (GFP) as a fluorescent label in the 1990s by Tsien, Chalfie, and Shimomura. GFP is a 238 amino acid protein that shows bright green fluorescence and was first isolated from the jellyfish Aequorea victoria. The 26.9 kDa wild-type GFP consists of a β-barrel structure (Figure 6) in which the essential chromophoric moiety, an amino acid triplet of Ser65, Tyr66, and Gly67, lies at the centre. The entire poly-peptide structure is necessary for GFP fluorescence, the chromophore forms autocatalytically and that the molecular structure surrounding the tripeptide influences its fluorescent properties. Furthermore, the protective β-barrel surrounding the tripeptide ensures stability, makes GFP relatively insensitive to environmental influences, and causes physical separation from species such as molecular oxygen. As a result, GFP’s photobleaching rate is lower than those of conventional fluorochromes. Wild-type GFP (from A. victoria) fluorescence is characterized by a major excitation peak at 395 nm and a minor one at 475 nm (Figure 6), which results in bright green emission at 509 nm and a quantum yield of 0.77.
  • 30. Figure 6 Molecular structure and localization of the chromophoric tripeptide in A. victoria wild-type GFP.
  • 31. Many fluorescent proteins (FPs) from other species, such as the Anthozoan button polyp Zoanthus (ZsYellow), sea anemone Discosoma (DsRed), or Anemonia majano (AmCyan1), have been identified and isolated, which now results in a wide color palette, with various photostabilities, sensing properties, photo-switchability, and useful FRET pairs.
  • 32. The development of FP technology was so significant that it opened the doors to completely new ways of performing fluorescence live cell imaging, particularly since it was now possible to tailor the fluorescent label’s properties through genetic engineering and to label proteins by expressing fluorescent fusion constructs directly in living cells. Bio nanotechnology over the past decades resulted in the development of luminescent nanoparticles with exceptional physical and chemical properties, not seen in other fluorochromes. Quantum dots (QDs), for instance, are inorganic semiconducting nanoparticles consisting of a core-shell configuration creating a spectral bandgap, e.g., CdSe/ZnS QDs. QDs have a relatively long lifetime, which provides the possibility to correct for background signals from short lived fluorescent species by time-gating techniques. QDs have broad absorption spectra, a single light source can be used to excite multiple QDs with different emission wavelengths simultaneously. Quantum dots are characterized by a number of additional unique properties 1) QDs are about 10–100 times brighter than organic fluorogenic dyes 2) They are 100–1,000 times more resistant to photobleaching, because the shell and various coatings form physical barriers that separate the excited state from surrounding biomolecules and molecular oxygen 3) They show narrower and more symmetric emission spectra compared with other fluorochromes.
  • 33. Fluorescence microscopy is the method of choice for live cell imaging and it is a standard procedure to study normal and pathological cell biological processes in single cells, subcellular compartments or across a population of cells by introducing fluorochromes specifically targeted to the (bio)molecules of interest. Major advantages are that fluorescence microscopy techniques provide information with spatio-temporal resolution and are generally less destructive compared with other imaging techniques, e.g., Electron Microscopy (EM).
  • 34. What makes fluorescence microscopy such a great and specific tool for cellular and molecular imaging and analysis?  Essentially it is its selectivity and contrast enhancement.  While the selectivity is achieved predominantly through the labeling methods  The contrast increase is realized in the microscope itself.  Modern fluorescence microscopes can maximize the collection of emitted fluorescent light, while minimizing the collection of the incident excitation light.  The main advantages of fluorescence microscopy is the dramatic increase in signal from the labeled structures and molecules against a dark background  Image contrast critically dependents on the ability of the microscope to pass fluorescent light to the detector while blocking the excitation light.  Due to its selectivity and contrast, not only fine cellular and subcellular structures, but even single molecules can be made visible in the fluorescence microscope.  If they are spatially well separated and thus not too close to each other or do not light up at the same time, localization of individual molecules is feasible, but is diffraction limited.  Three basic components are present in every light microscope, irrespective of the type: 1) An illumination source 2) A magnifying lens 3) An image acquisition device.
  • 35. In a wide field fluorescence microscope, the white light source is replaced by a high power lamp (a mercury or xenon source), which excites the fluorochromes in the fluorescently labeled sample and induces fluorescence emittance(Figure 5). Images are typically acquired visually by eye or electronically with a CCD camera. Fluorochromes have characteristic excitation spectra. Thus, an appropriate excitation filter, usually a band-pass filter (BP), is placed between the lamp and the sample to narrow the wavelength range of light reaching the sample to such an extent that the fluorochromes used are excited efficiently, whereas unwanted excitation is minimized. (Figure 7) Since the emitted light has a longer wavelength than the excitation light, an emission filter (either a long pass [LP] or BP filter) placed between the sample and the detector effectively blocks the excitation light and prevents perturbation of the final image. Intense light is required for successful fluorescence excitation. Lasers generally produce high intensity light and have proven to be an excellent alternative excitation source to mercury and xenon lamps. Since lasers are a source of monochromatic light, generally no excitation filter is required. However an emission filter or an alternative spectral selection device is still needed to stop the excitatory laser light from reaching the detector and to tune in on the fluorochrome’s emission signal, especially in multiple labeling experiments.
  • 36. Figure 7 Optical settings for a fluorescence microscope
  • 37. RESOLUTION IN FLUORESCENCE MICROSCOPY In fluorescence microscopy, the optical resolving power determines the amount of detail observed in a specimen, which in turn is determined by a number of physical factors and instrument limitations. In order to obtain sharp images, the objective must capture as much of the deflected light as possible, which is achieved with wide angular openings (aperture). Ernst Abbe first defined the numerical aperture (N.A.), which determines the objective’s light capturing capacity and can mathematically be written as Where, n is the refraction index of the medium between the object and the objective (n = 1 for air and for immersion oil n = 1.51) α is half the objective opening angle.
  • 38. To maximize capturing the deflected light and to increase the resolution, several strategies can be employed, including the use of a condenser lens for illumination to widen the angle of the ray cone on the illumination side and or to use an immersion liquid between objective lens and the cover slip, which abrogates reflections that normally diminish the resolving power. In fluorescence microscopy the resolution is not directly governed by the magnification. Resolution and contrast are two reciprocally interrelated parameters that are important in fluorescence microscopy and should not be considered as separate entities. Individual objects in a specimen cause diffraction of light and as a result, an illuminated point source within the specimen is observed as a bright central spot (Airy disc) with surrounding diffraction rings (Airy pattern) as shown in Figure 7. Figure 7 Airy disc diffraction pattern
  • 39. Essentially, resolution may be defined as the smallest distance between two points in the specimen that can still be discriminated as separate points at a particular contrast, which with Equation 5 can be written as:
  • 40. Contrast is defined as the difference between the maximum intensity and minimum intensity occurring in the space between two objects of equal intensity. When the two point objects are well separated, the contrast minimum between them is near zero and the objects can be discriminated . However, as the point objects approach and their PSFs start to overlap, the intensity minimum between the two object maxima is reduced until the objects are no longer resolved. Rayleigh criterion for resolution Which states that two points are resolved when the first minimum of one Airy disc is aligned with the central maximum of the second Airy disc. From the above mentioned statement , it becomes obvious that the smaller the Airy pattern, the higher the resolution.
  • 41. SAMPLE PREPARATION Fluorescence from a fluorophore tagged to a molecule of interest is often used to measure the quantity of the tagged molecule. Fluorescent proteins expressed in live cells are excellent for quantitation; because there is a constant number of fluorophores per labeled protein. The number of photons emitted can be an accurate measure of the quantity of fluorescently labeled protein. Quantitation of live versus fixed cells is generally preferable because the fixation and extraction process can remove tagged proteins, quench the fluorescence of fluorescent proteins, and change the size and shape of cells. The fixation and extraction necessary to get antibodies into cells can change the quantity and localization of detectable epitopes. Measuring fluorescence deep into specimens can also be problematic for measurements of signal intensities. In biological specimens, light scattering and optical aberrations increase with distance from the coverslip and decrease signal intensity. These effects are difficult to characterize and correct for in inhomogeneous biological samples. Although the effects of light scattering are minimized when using multi-photon illumination.
  • 43. CONCLUSION The significance of imaging-based methodologies is underscored by the fact that the major part of discoveries in life sciences over at least the past 50 years were based on imaging biological and pathological processes. The advanced fluorescence microscopic techniques has a major impact on cell biological research and (bio)medicine. Nowadays functional insight in cellular processes that was previously the mainstay of analytical biochemistry and could only be observed on gels and blots can now directly be visualized and also be analyzed in the living cell. Fluorescence microscopy is a valuable toolbox to study cellular structures and dynamics spanning scales from the single molecule to the live animal. The spatial resolution that can be achieved with any light-based microscopy is however limited to about 200 nm in the imaging plane and >500 nm along the optical axis. It has been a motivation and a challenge to bypass this limit in spatial resolution, and to extend the range of fluorescence microscopy reaching a near-molecular resolution. It’s a selection of techniques that successfully demonstrated sub-diffraction resolution fluorescence imaging and which today are used for imaging of small cellular structures. However, even though techniques such as FRAP, FLIP, and FRET have become more common place in life science research, they are certainly not trivial methodologies with many possible pitfalls, some of which are obvious, whilst others are more obscure.
  • 44. REFERENCE Hellen C. Ishikawa-Ankerhold etal. 2012,Advanced Fluorescence Microscopy Techniques-FRAP, FLIP, FLAP, FRET and FLIM. 17(4): 4047–4132. Berezin M.Y., Achilefu S. Fluorescence lifetime measurements and biological imaging. Chem. Rev. 2010;110:2641–2684 Lakowicz J.R. Principles of Fluorescence Spectroscopy. 3rd. Springer Science; New York, NY, USA: 2006 Wang Y.L. Fluorescence Microscopy of Living Cells in Culture. Part A. Fluorescent Analogs, Labelling Cells, and Basic Microscopy. Methods in Cell Biology. Vol. 29 Academic Press; San Diego, State abbr., USA: 1989 Swift S.R., Trinkle-Mulcahy L. Basic principles of FRAP, FLIM and FRET. Proc. Royal Mic. Soc. 2004;39:3– 10.