Download to read offline
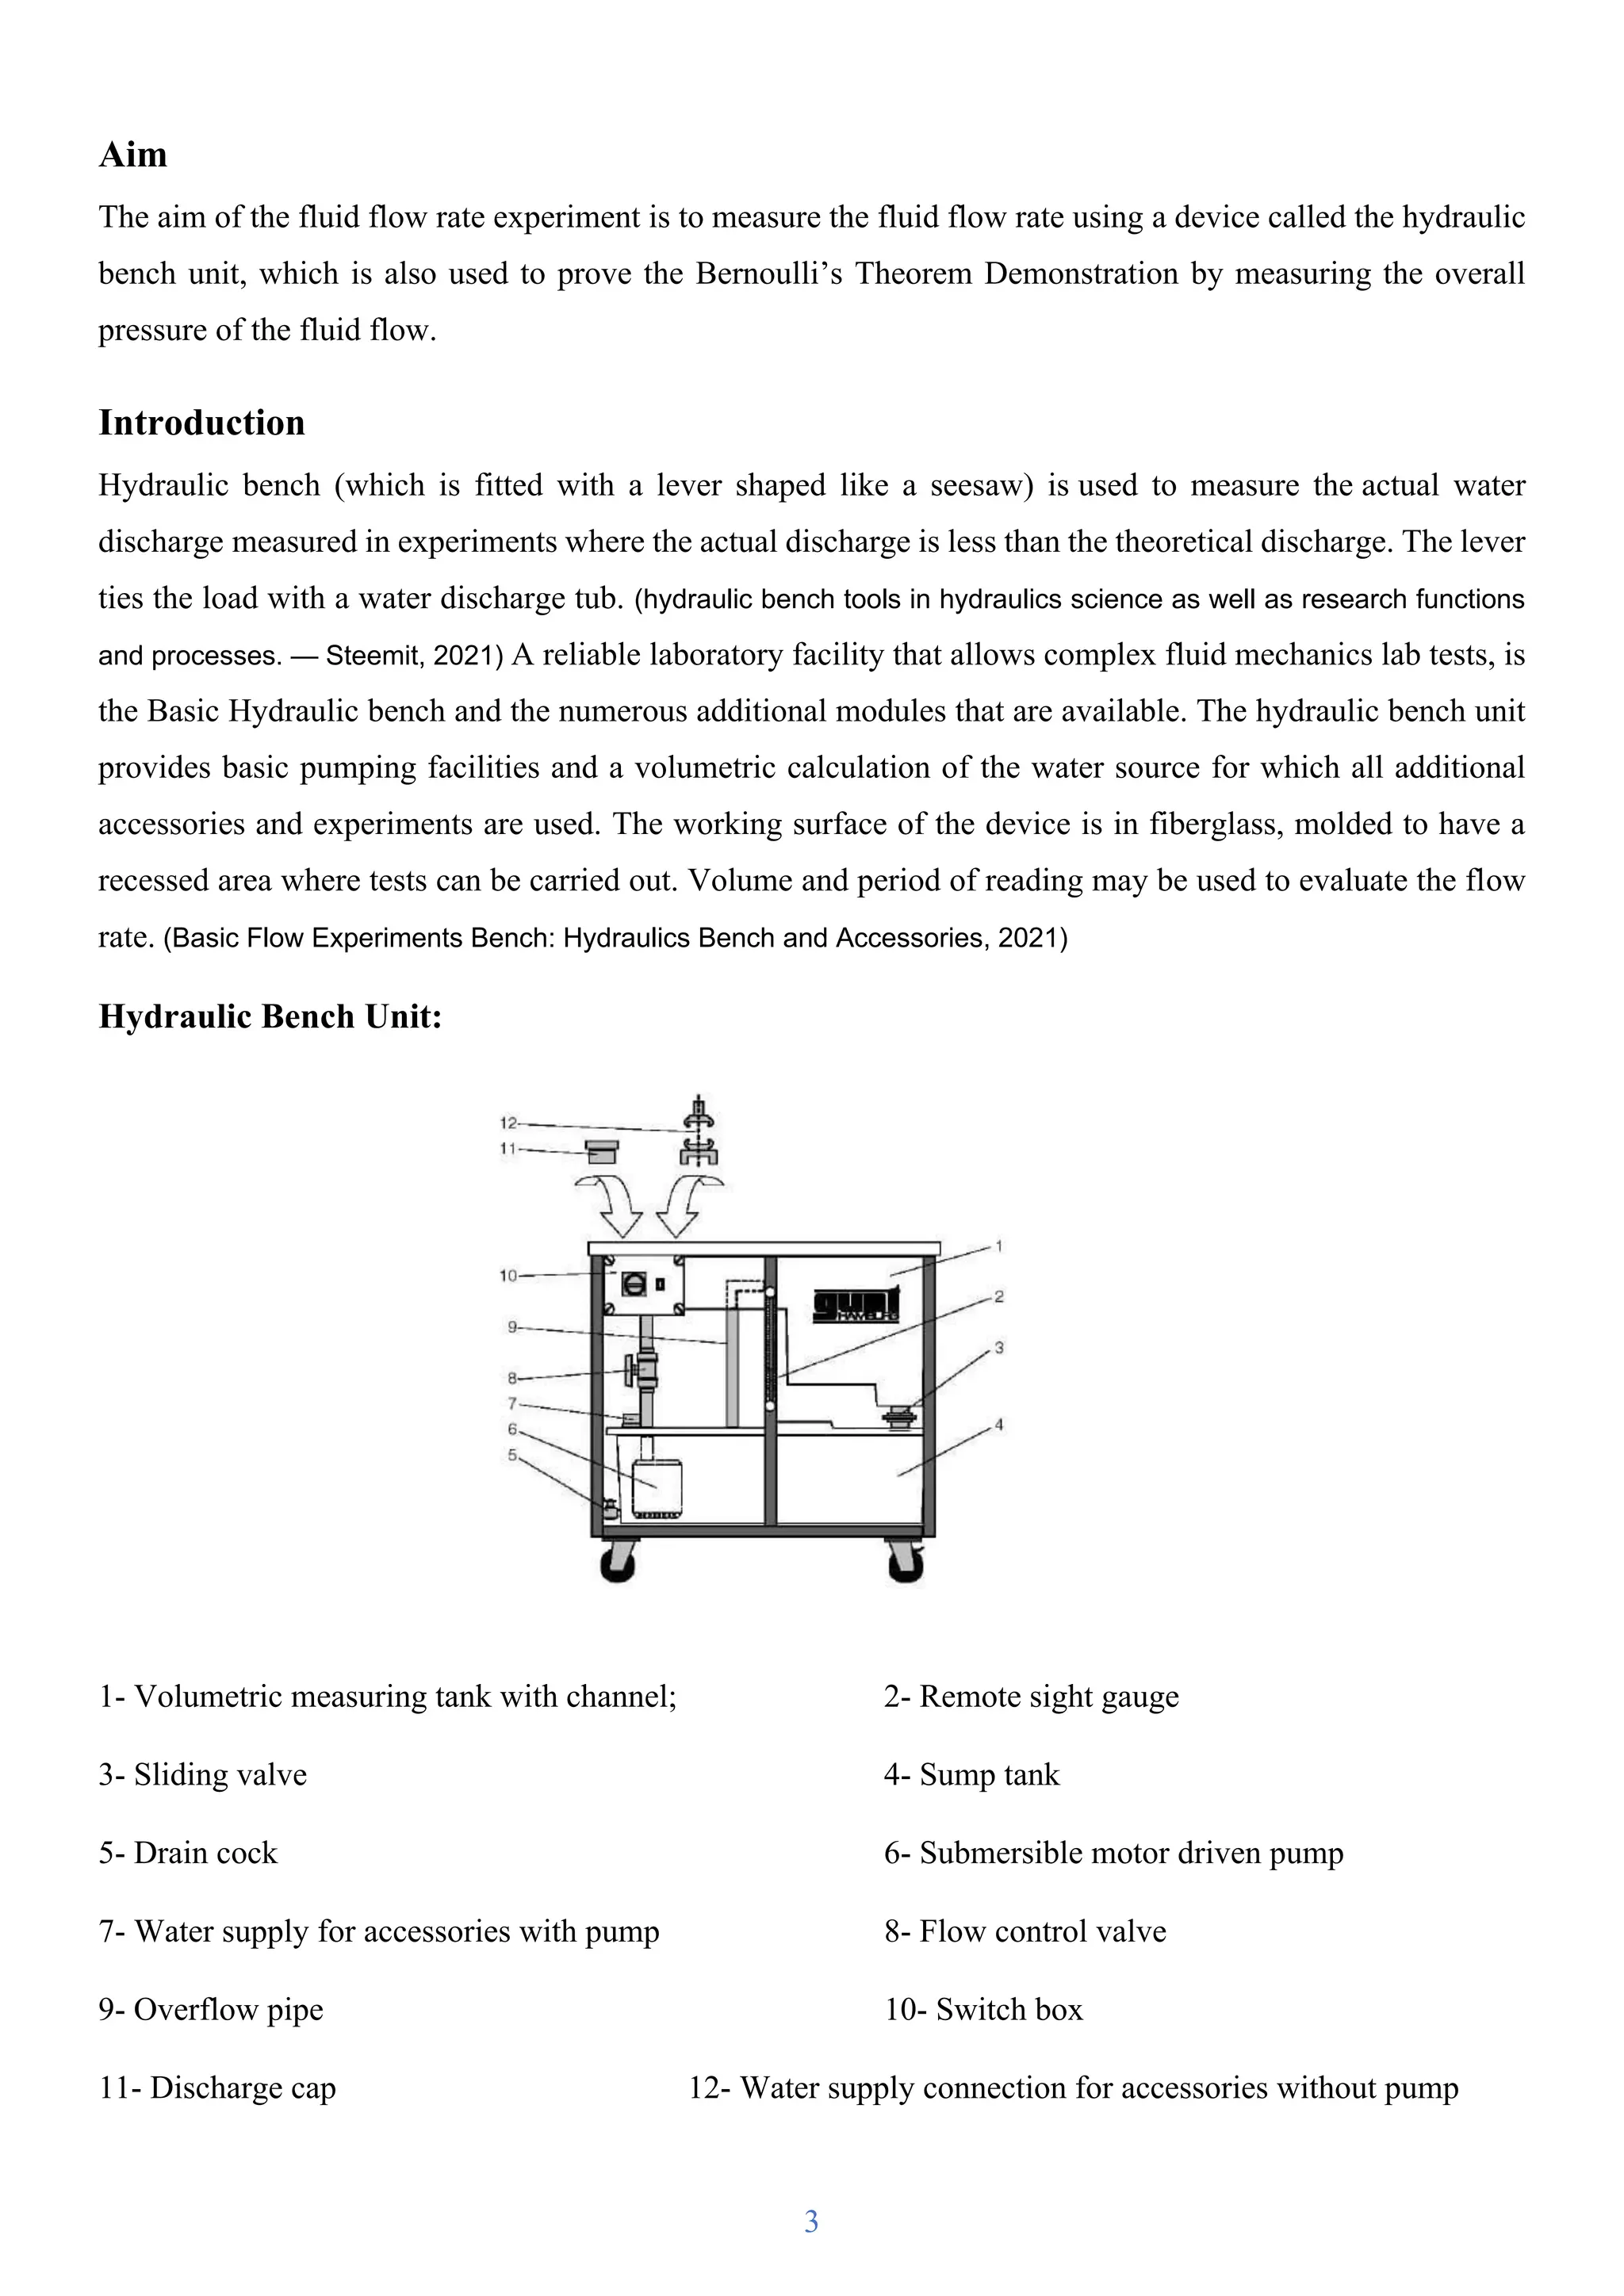
![5
The hydrostatic pressure (P) along the flow is measured by manometers tapped into the duct. The pressure
head (h), thus, is calculated as:
ℎ𝑠 =
𝑃
𝜌𝑔
Therefore, Bernoulli’s equation for the test section can be written as:
ℎ1 +
𝑣12
2𝑔
= ℎ2 +
𝑣22
2𝑔
= 𝐻
in which
𝑣2
2𝑔
is called the velocity head (hd)
z is called potential head
Total head (ht) may be measured by the traversing hypodermic probe.
ℎ𝑚 = ℎ +
𝑣2
2𝑔
The velocity of flow at any section of the duct with a cross-sectional area of is determined as:
𝑣 =
𝑄
𝐴
Procedure of the Experiment (fluid flow rate)
1. Plugin the device to the electricity power and turn on the pump.
2. Bring a stopwatch and set it to zero.
3. Close the valve at the bottom of the volumetric tank, and as liquid starts flowing into the volumetric
tank start the stopwatch from 2 liters and wait until the liquid reaches a value of 5 liters.
4. After the liquid reached a value of 5 liters stop the watch.
5. Read off and note the measurement time and the high value of water in tank.
Procedure of the Experiment (Bernoulli’s Theorem Demonstration)
1. Arrange the experimentation set-up on the Hydraulic Bench such that the discharge routes the water
into the channel.
2. Make hose connection between Hydraulic Bench and unit.
3. Open discharge of Hydraulic Bench
4. Set cap nut [1] of probe compression gland such that slight resistance is felt on moving probe.
5. Open inlet and outlet ball cock.
6. Switch on pump and slowly open main cock of Hydraulic Bench.
7. Open vent valves [3] on water pressure gauges.
8. Carefully close outlet cock until pressure gauges are flushed.](https://image.slidesharecdn.com/raboons1streport3rdstage-210622195537/75/Fluid-Flow-Rate-Bernoulli-s-Theorem-Demonstration-5-2048.jpg)
![6
9. By simultaneously setting inlet and outlet cock, regulate water level in pressure gauges such that
neither upper nor lower range limit [4,5] is overshot or undershot.
10. Record pressures at all measurement points. Then move overall pressure probe to corresponding
measurement level and note down overall pressure.
11. Determine volumetric flow rate. To do so, use stopwatch to establish time t required for raising the
level in the volumetric tank of the Hydraulic Bench.
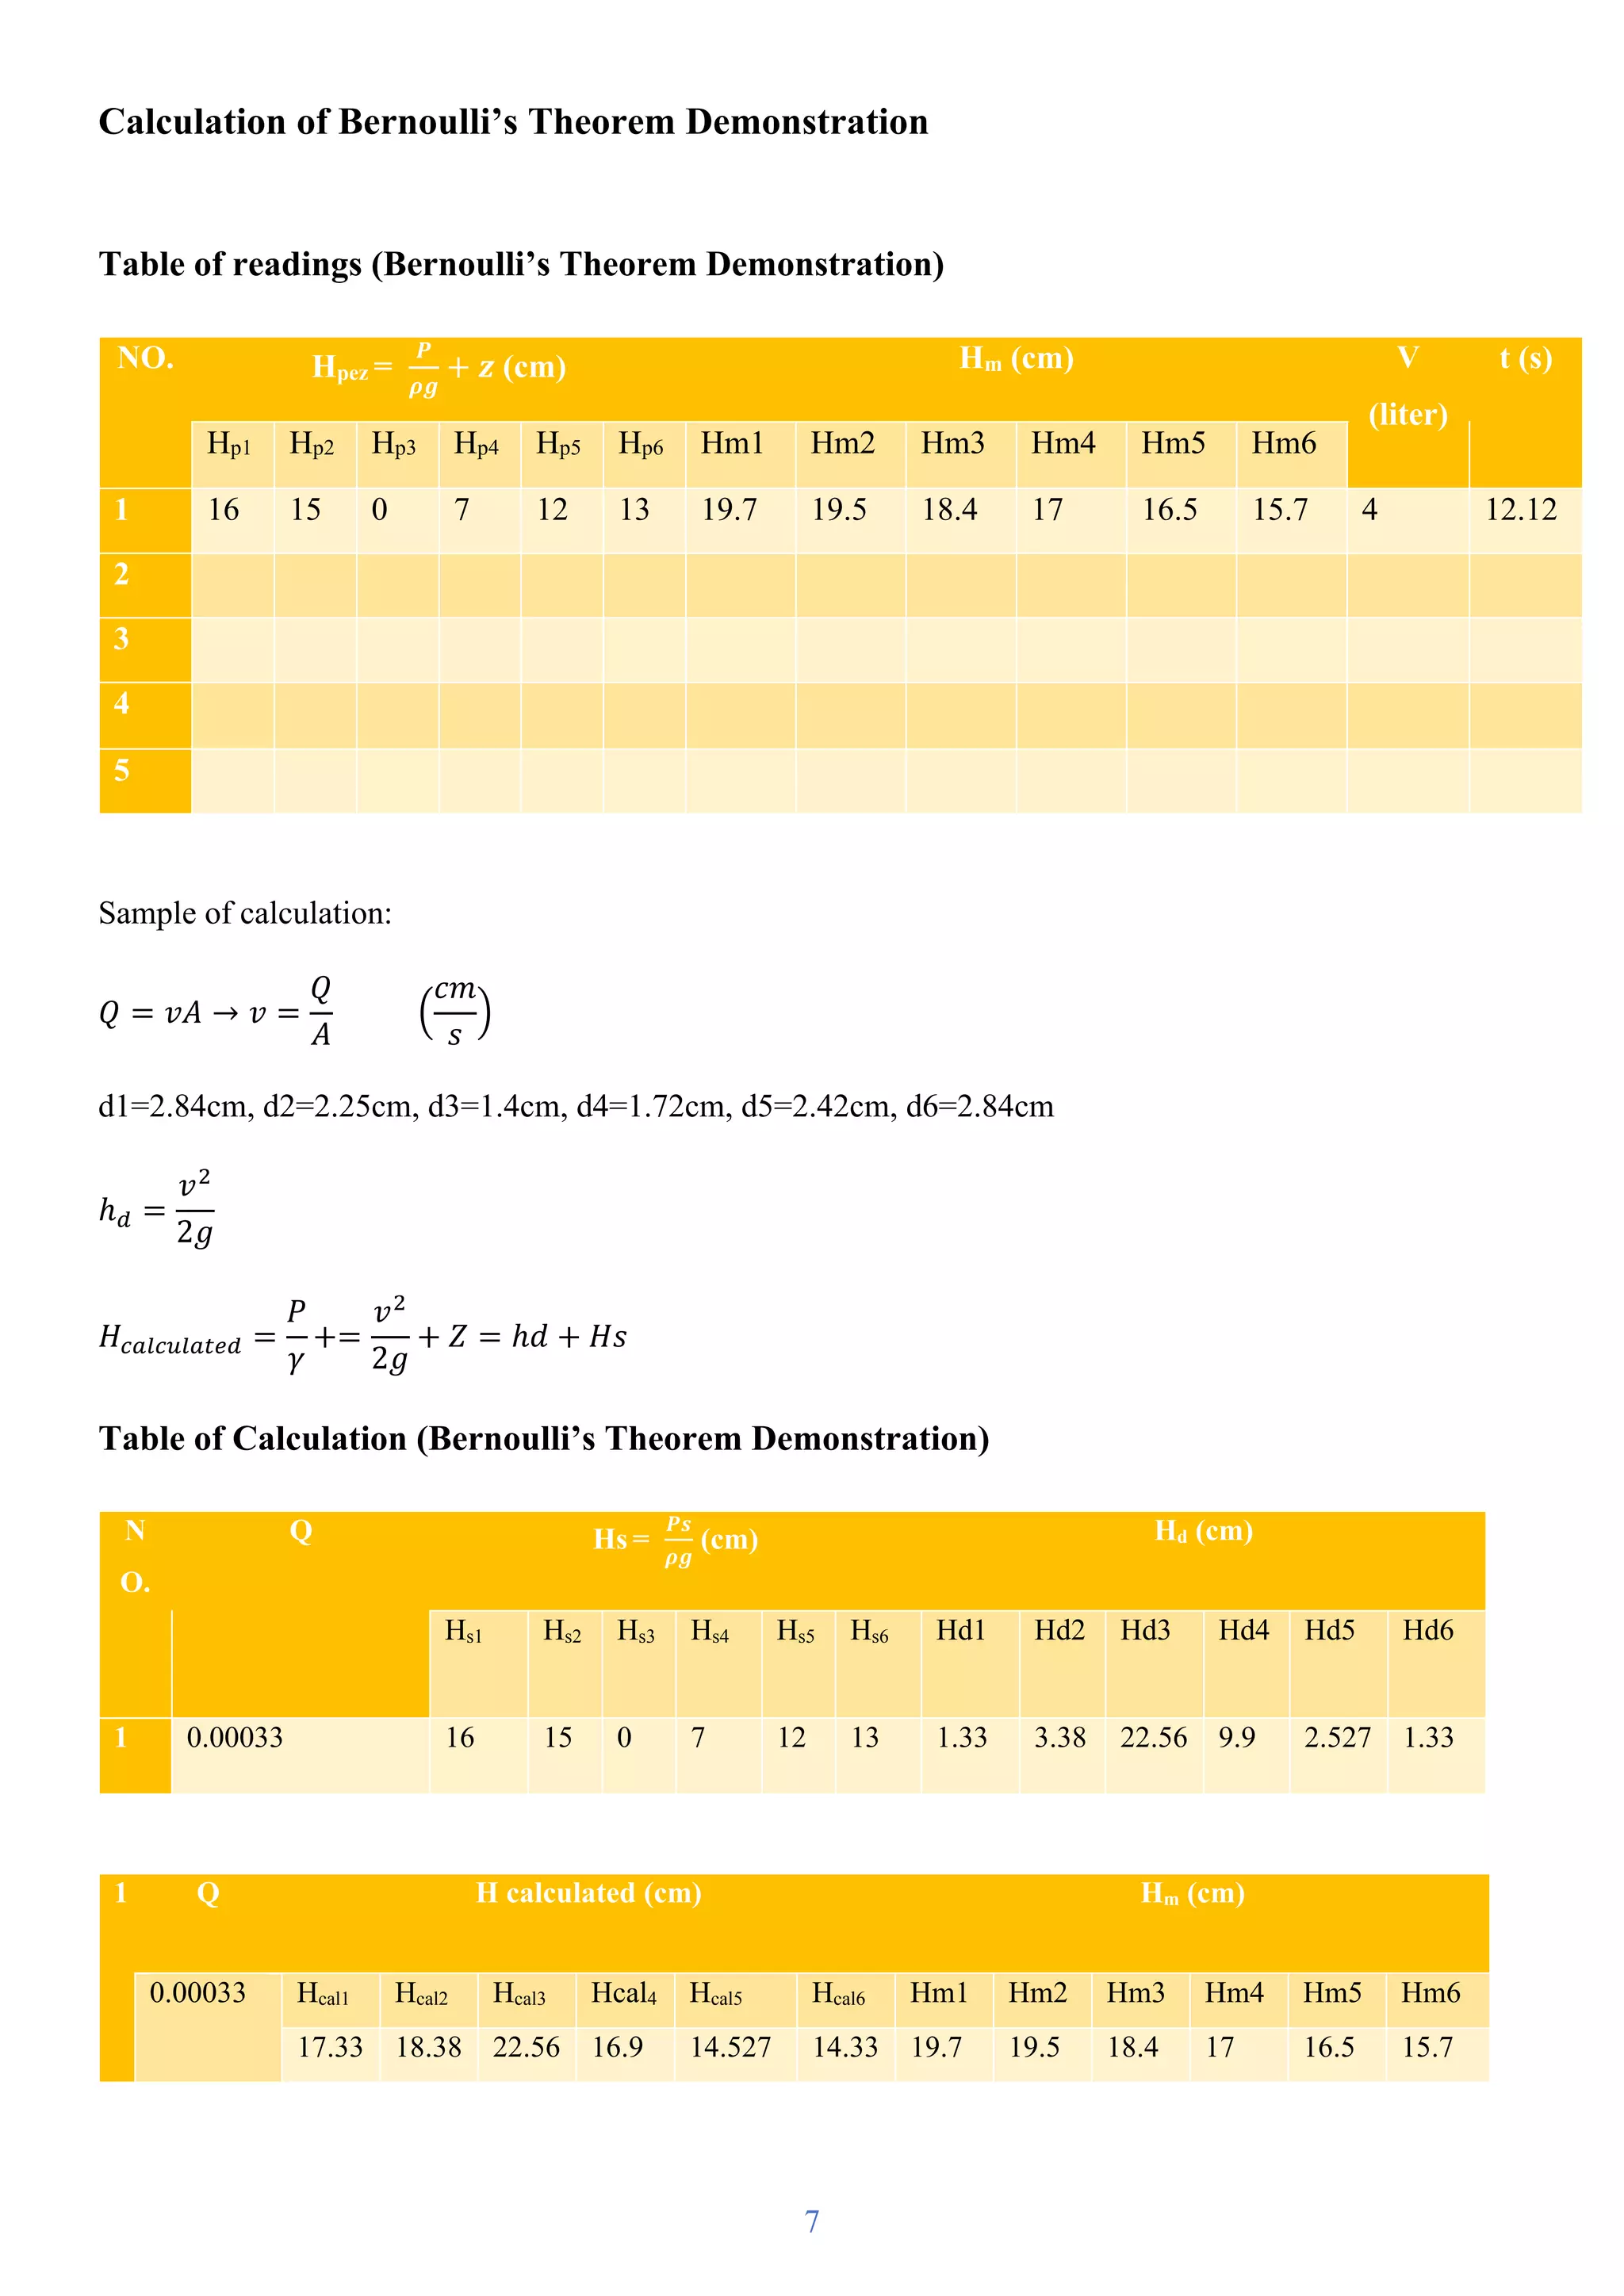
Calculation of (fluid flow rate)
Table of reading (fluid flow rate)
NO. V (liter) t (s)
1 0 0
2 3 27.04
3 3 16.11
4 4 17.30
5 8 22.06
Sample of calculation:
- Convert the liter to cubic meter by multiplying the liter unit with 0.001
- The volume flow rate can be shown as: 𝑄 =
𝑉
𝑡
which can be in (
𝑚3
𝑠
) 𝑜𝑟 (
𝐿
𝑠
)
- The mass flow rate can be shown as: ṁ = 𝜌𝑄 which can be in (
𝐾𝑔
𝑠
) (1000*Q)
- The weight flow rate can be shown as: ẇ = 𝜌𝑔𝑄 which can be in (
𝑁
𝑠
) (1000*9.81*Q)
Table of calculation (fluid flow rate)
NO. V (m^3) t (s) Q (
𝒎𝟑
𝒔
) ṁ (
𝑲𝒈
𝒔
) ẇ (
𝑵
𝒔
)
1 0 0 0 0 0
2 0.003 27.04 0.000111 0.110946746 1.088387574
3 0.003 16.11 0.00018622 0.186219739 1.826815642
4 0.004 17.30 0.000231214 0.231213873 2.268208092
5 0.008 22.06 0.000362647 0.362647325 3.557570263](https://image.slidesharecdn.com/raboons1streport3rdstage-210622195537/75/Fluid-Flow-Rate-Bernoulli-s-Theorem-Demonstration-6-2048.jpg)
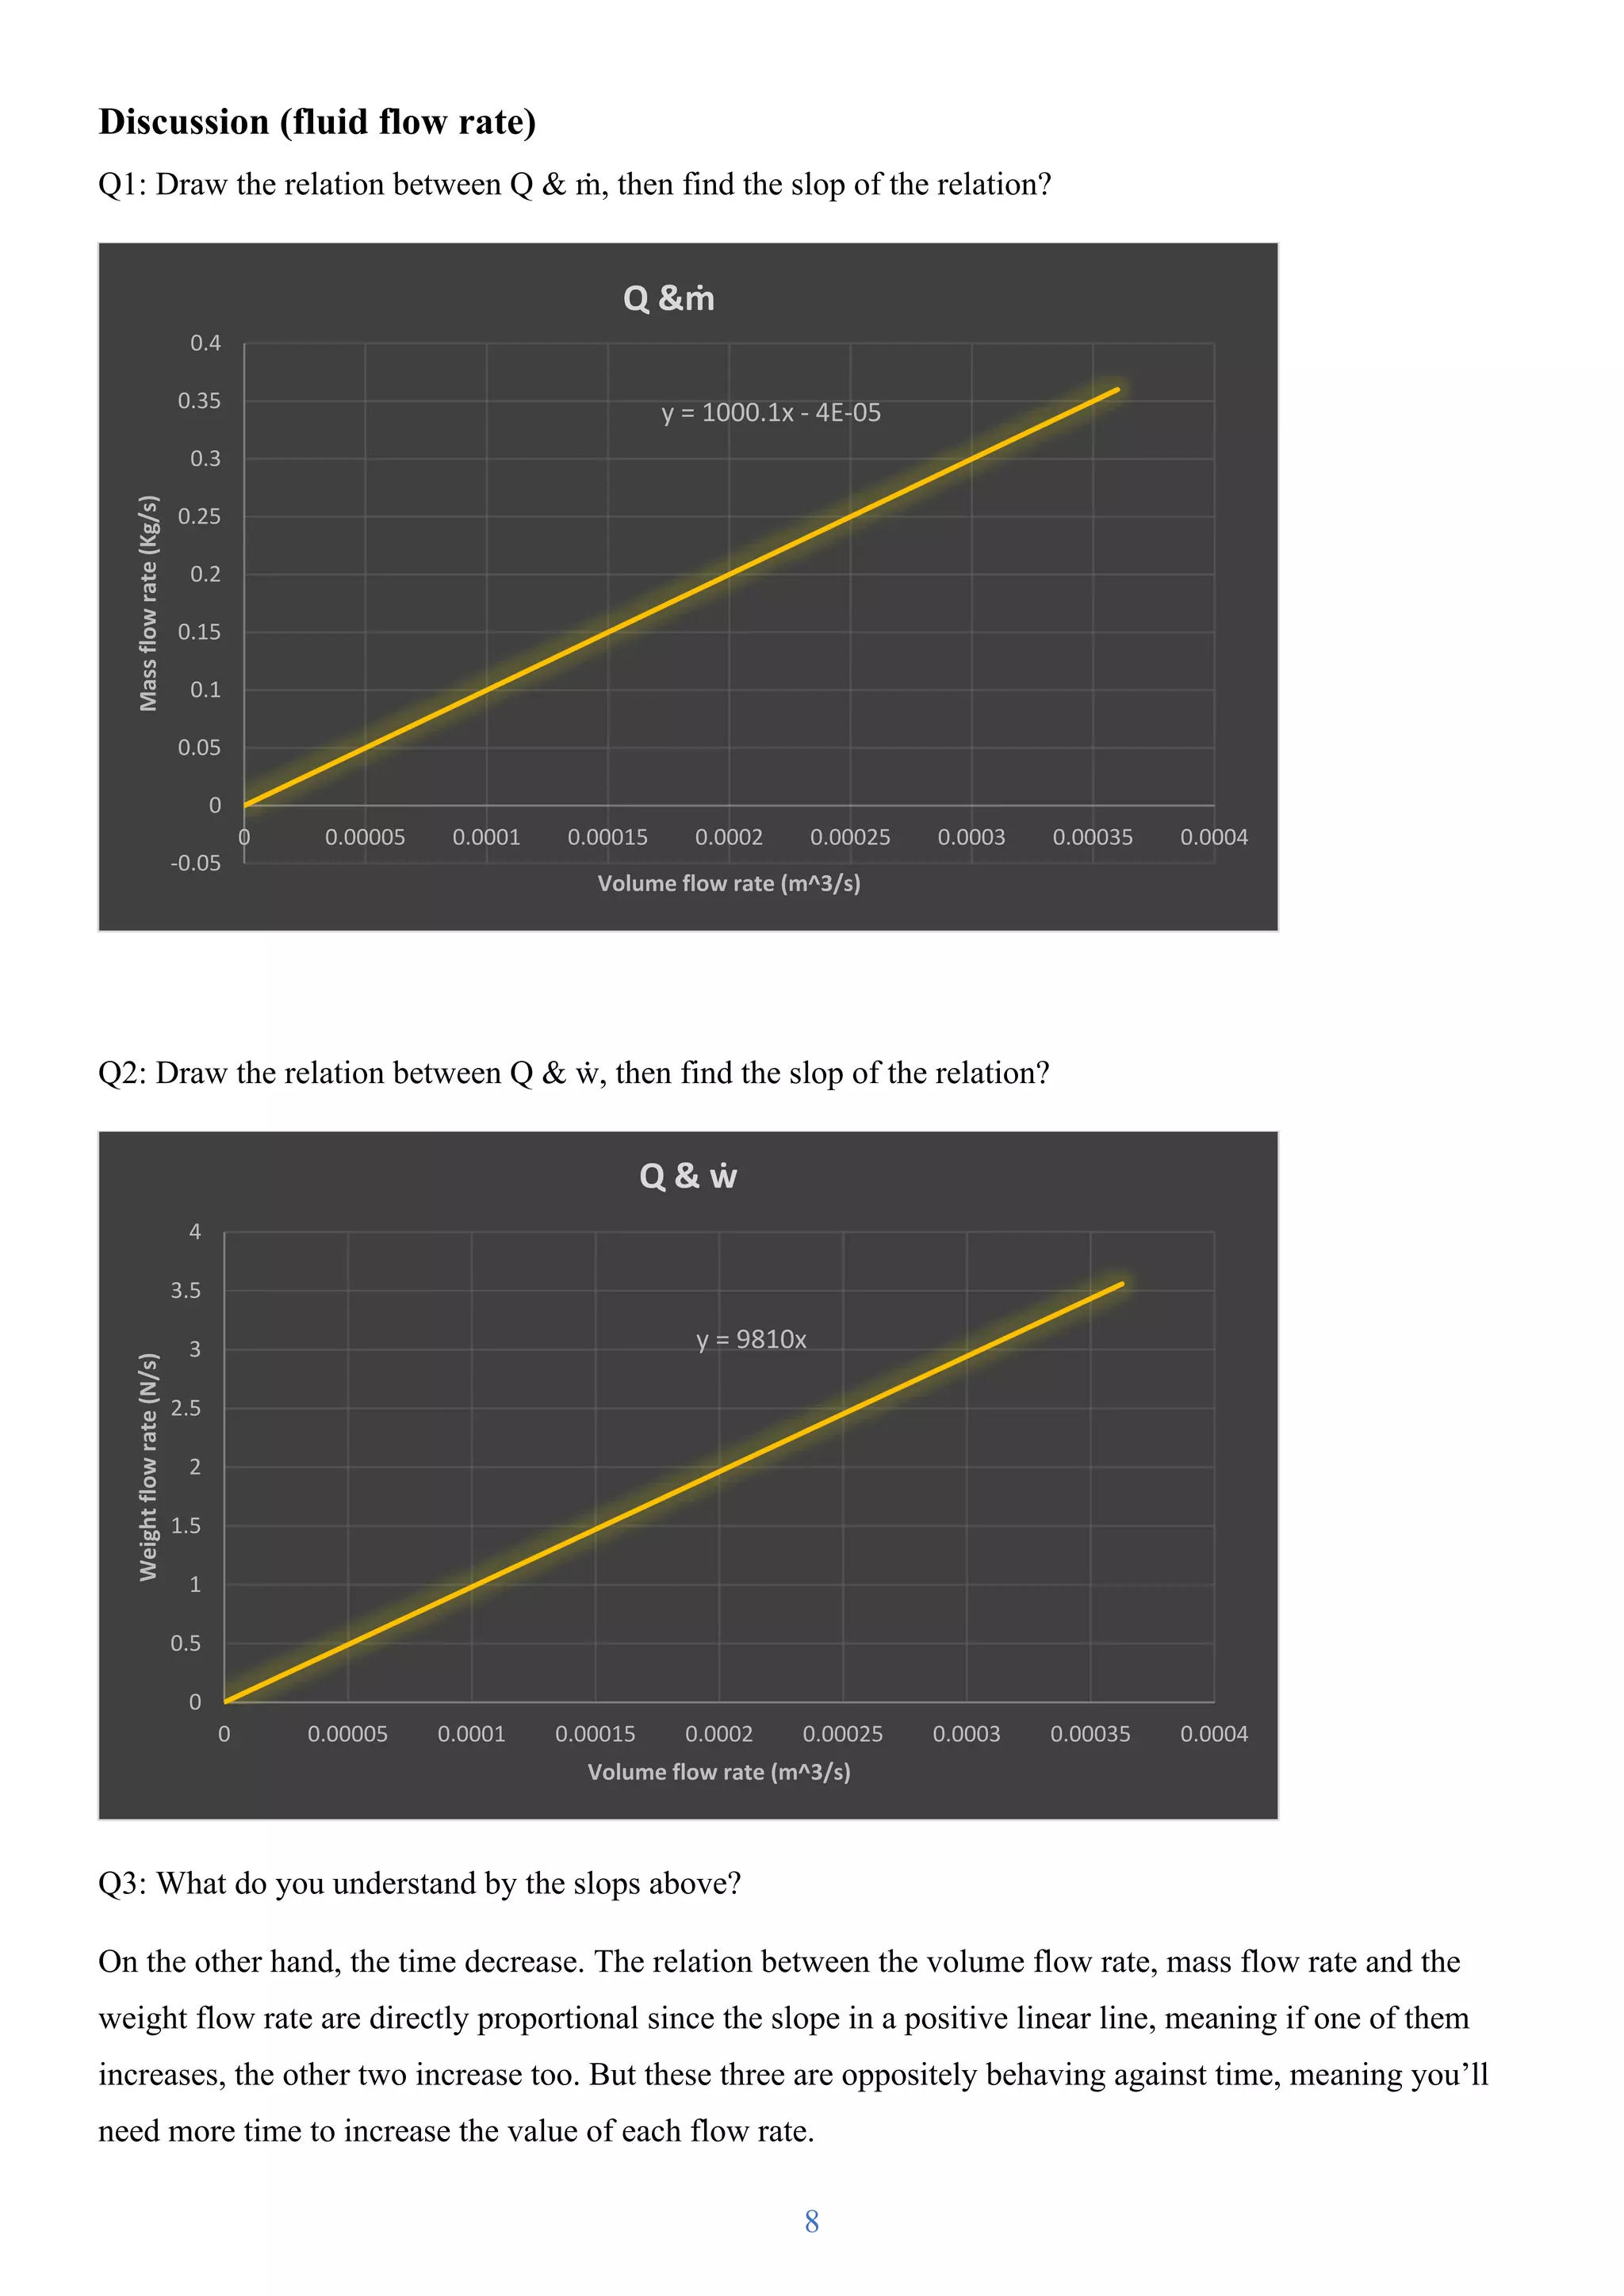
![10
Q3: Plot the total energy H calculated and Hm along the venture tube.
Q4: Discuss the relations above.
- Values of the Hm and H calculated from the venturi are nearly
equal to each other proving the correction of the Bernoulli
equation by inputting Z=0 because the venturi is horizontal.
- The pressure head at the 3rd
point has decreased too much that we
couldn’t even read it on the tubes, but can see the water level and assume it with zero. And notice
that as the pressure has decreased, the velocity is at its maximum value.
References
1. Armfield. 2021. F1-15 Bernoulli's Theorem Demonstration - Armfield. [online] Available at:
<https://armfield.co.uk/product/f1-15-bernoullis-theorem-demonstration/> [Accessed 16 January 2021].
2. Ahmari, H. and Kabir, S., 2021. Experiment #2: Bernoulli’S Theorem Demonstration. [online]
Uta.pressbooks.pub. Available at: <https://uta.pressbooks.pub/appliedfluidmechanics/chapter/experiment-2/>
[Accessed 16 January 2021].
3. Adamslab.co.uk. 2021. Basic Flow Experiments Bench: Hydraulics Bench And Accessories. [online] Available
at: <http://adamslab.co.uk/index.php?route=product/product&product_id=4403> [Accessed 16 January 2021].
4. Steemit.com. 2021. Hydraulic Bench Tools In Hydraulics Science As Well As Research Functions And
Processes. — Steemit. [online] Available at: <https://steemit.com/science/@aguess/hydraulic-bench-tools-in-
hydraulics-science-as-well-as-research-functions-and-
processes#:~:text=hydraulics%20bench%20are%20used%20to,with%20a%20water%20discharge%20tub.>
[Accessed 16 January 2021].
0
5
10
15
20
25
0 1 2 3 4 5 6 7
Hcalculated
&
Hm
Venture Points](https://image.slidesharecdn.com/raboons1streport3rdstage-210622195537/75/Fluid-Flow-Rate-Bernoulli-s-Theorem-Demonstration-10-2048.jpg)

This document details an experiment conducted by the Petroleum Engineering Department at Soran University to measure fluid flow rate and demonstrate Bernoulli’s theorem using a hydraulic bench unit. It includes an introduction to the equipment, procedures for the experiments, calculations for fluid flow rates and Bernoulli’s theorem, as well as data tables and discussions on the results. The findings confirm the theoretical relationships between pressure, velocity, and elevation of flowing fluids.


![Geotechnical Engineering-I [Lec #24: Soil Permeability - II]](https://cdn.slidesharecdn.com/ss_thumbnails/24-180924141149-thumbnail.jpg?width=640&height=640&fit=bounds)