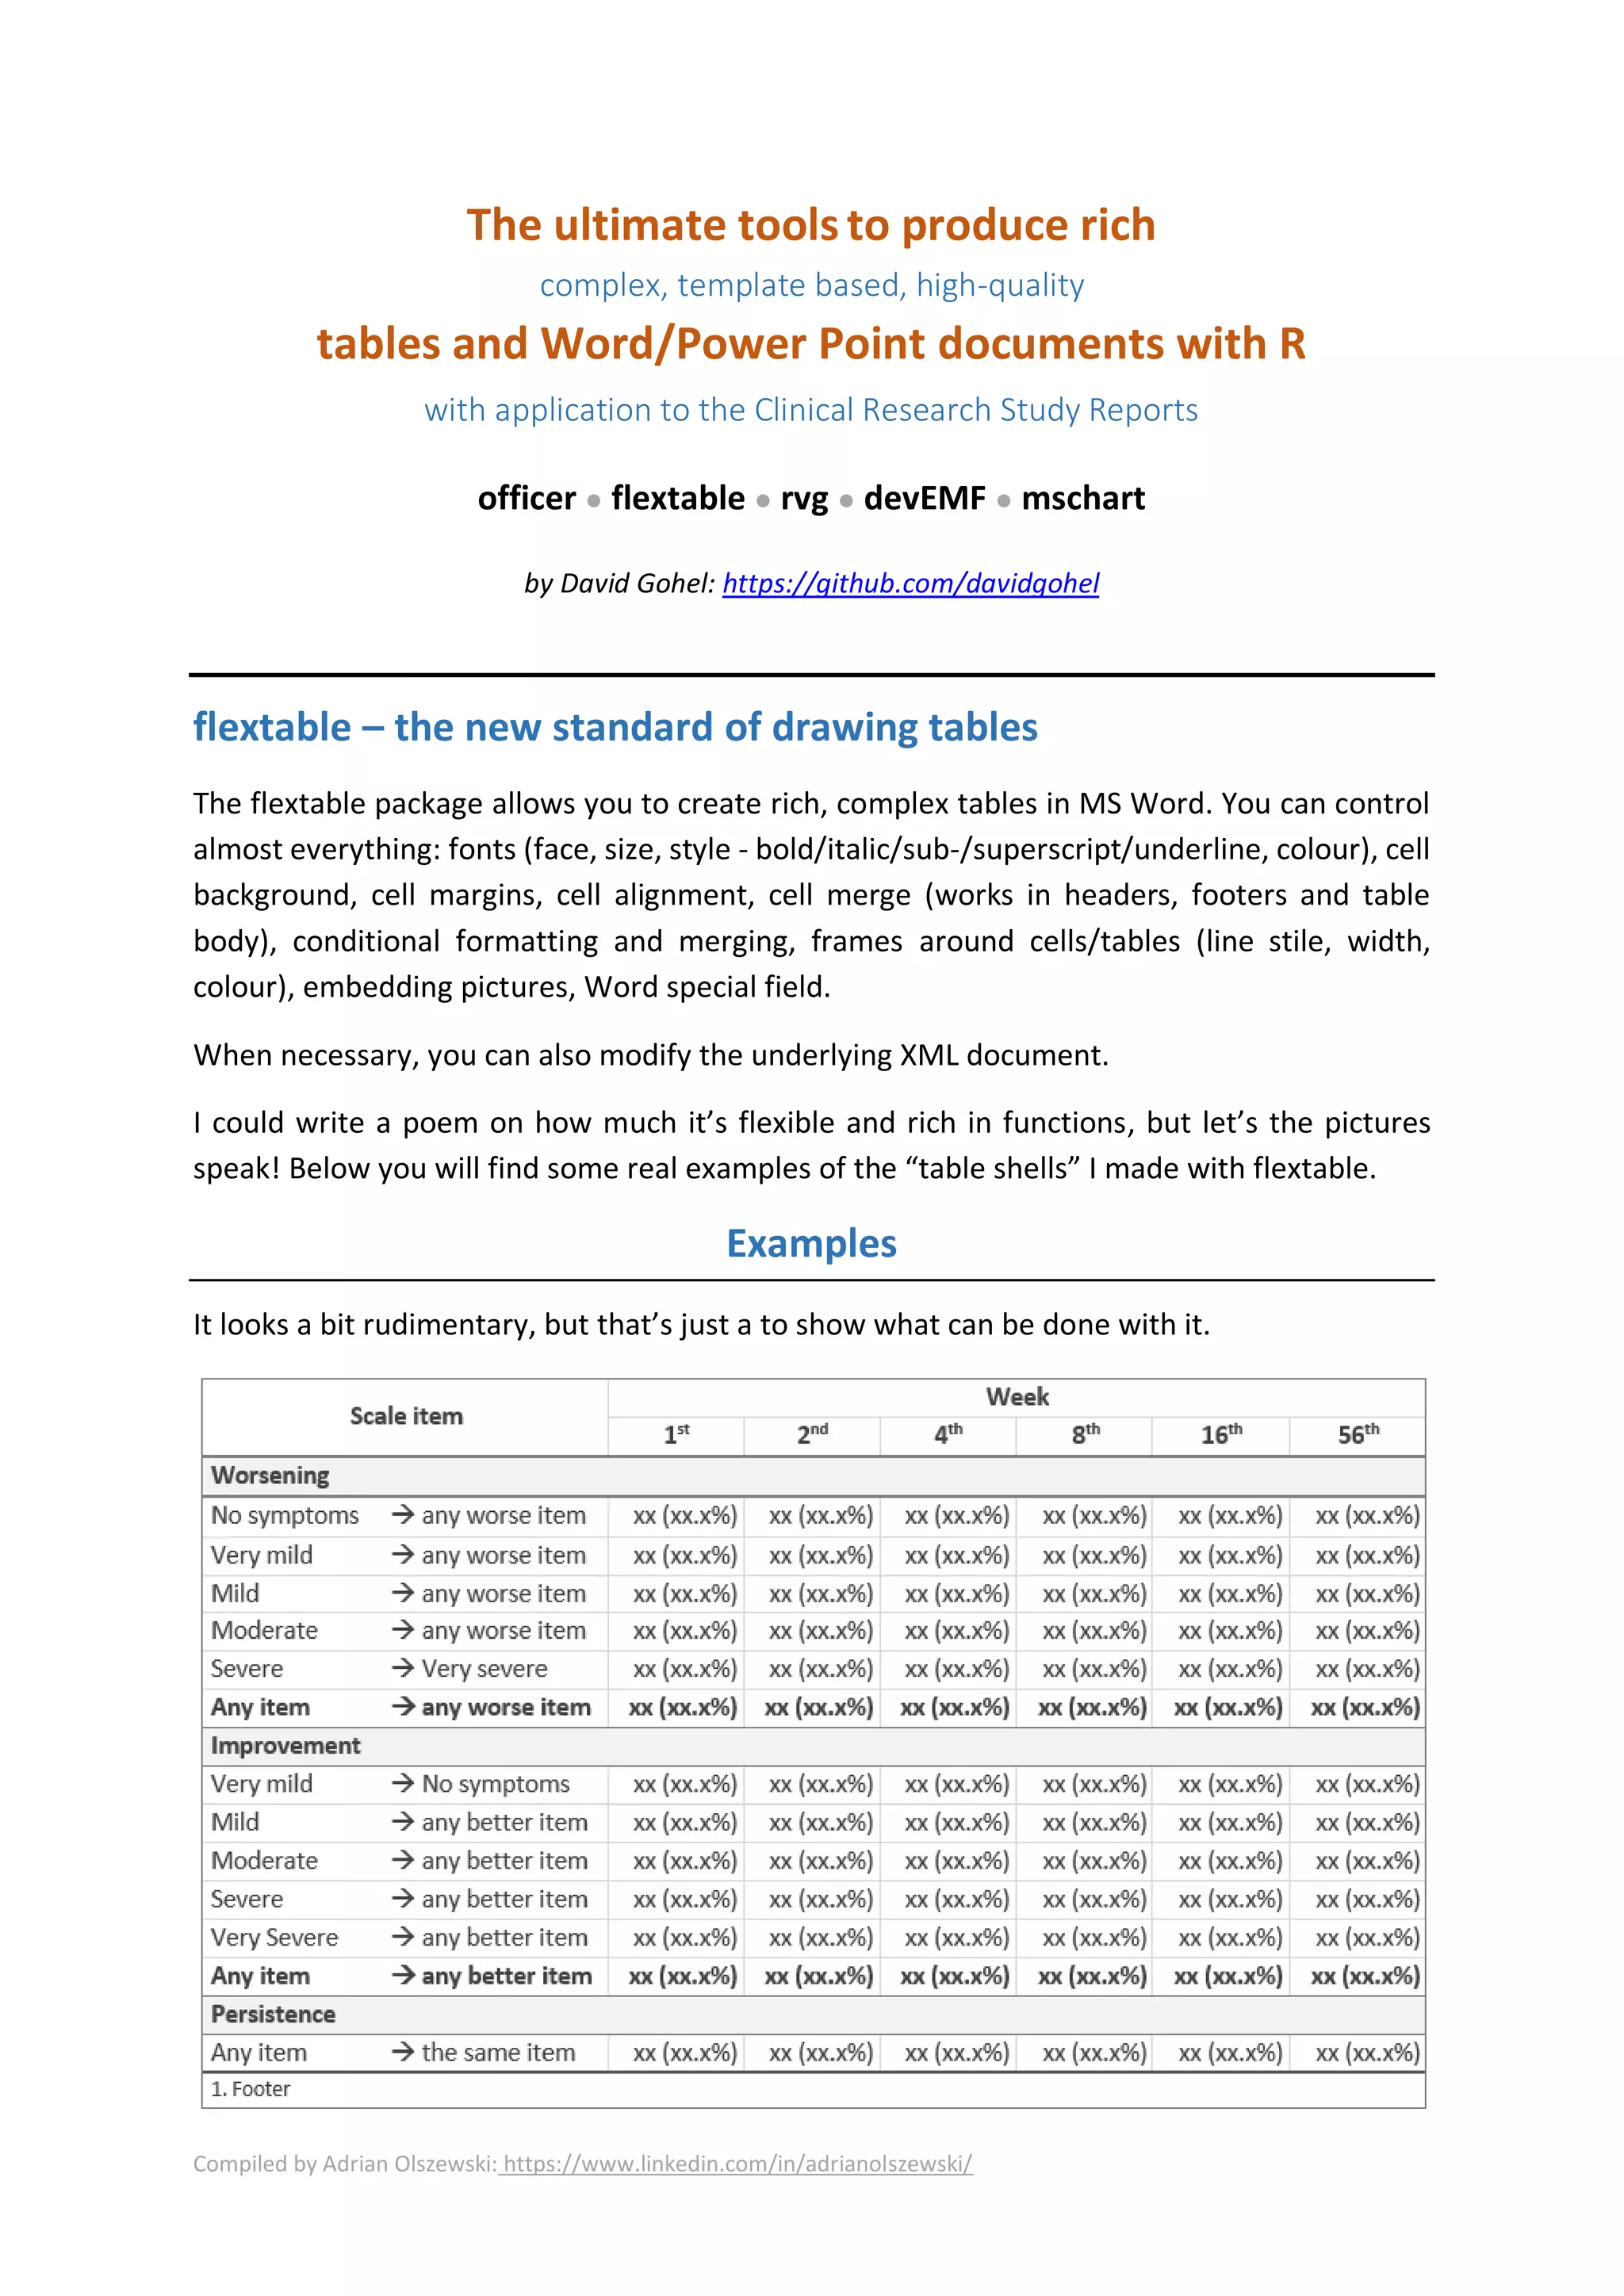
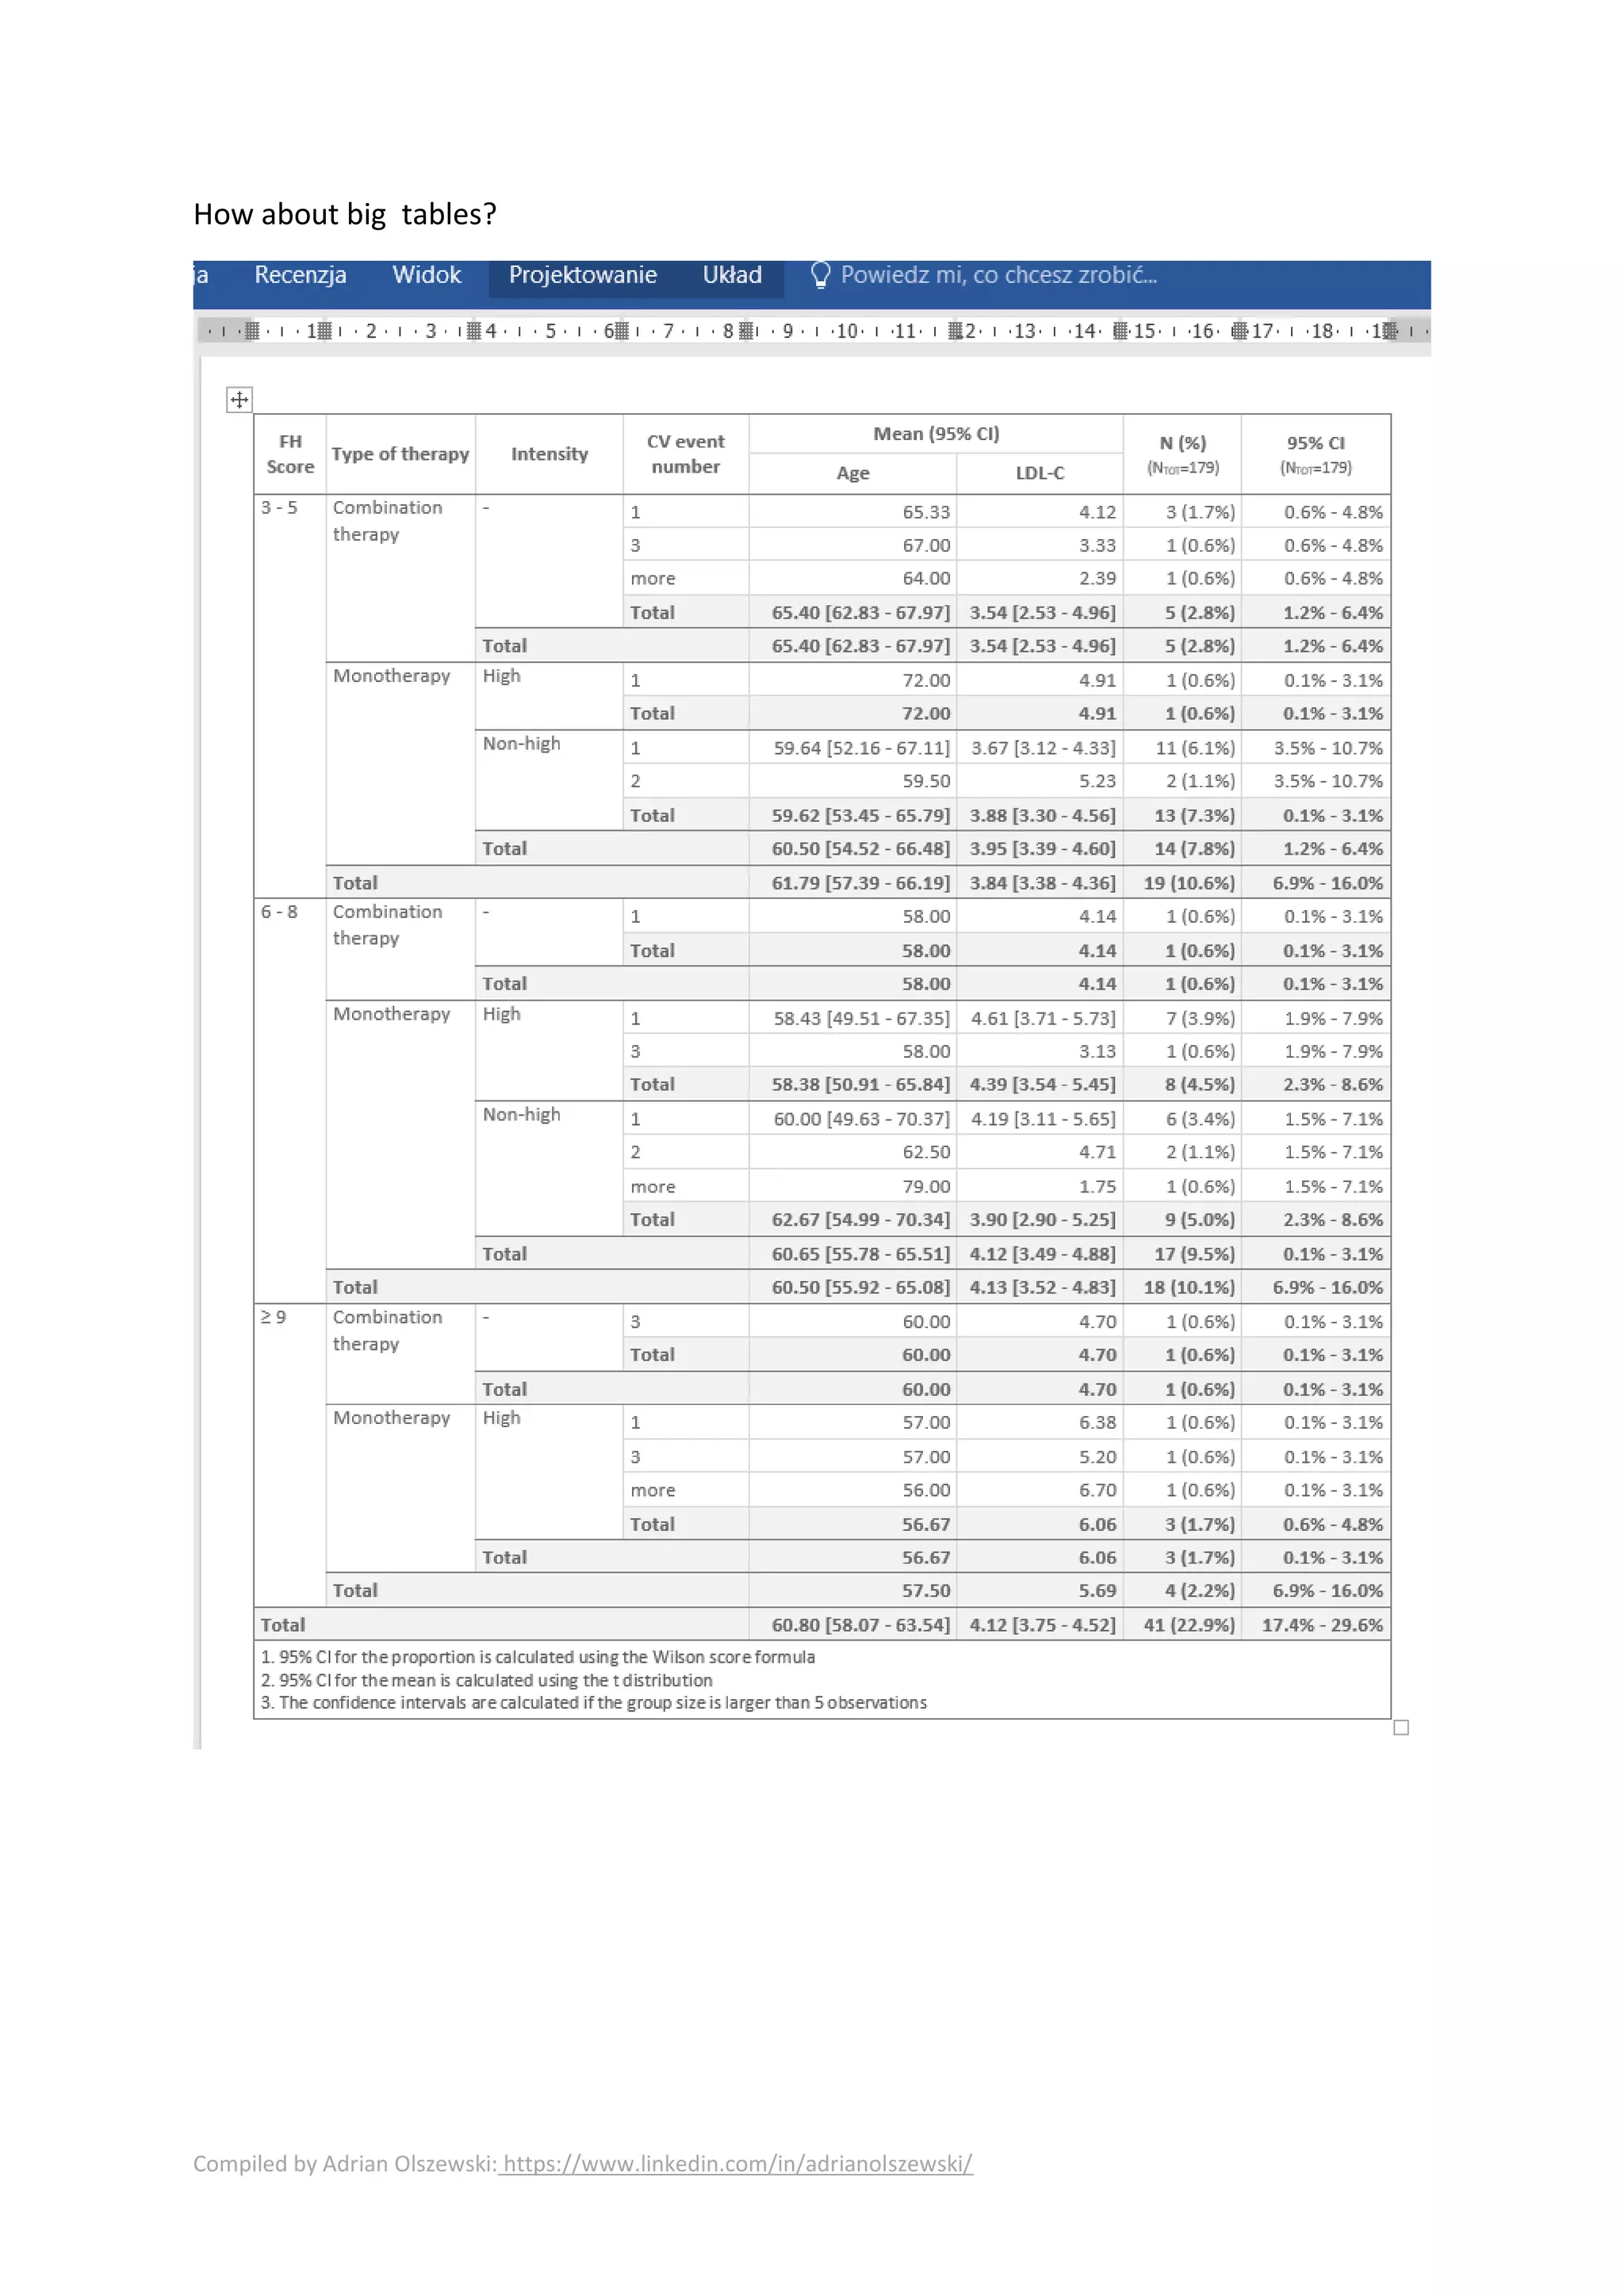
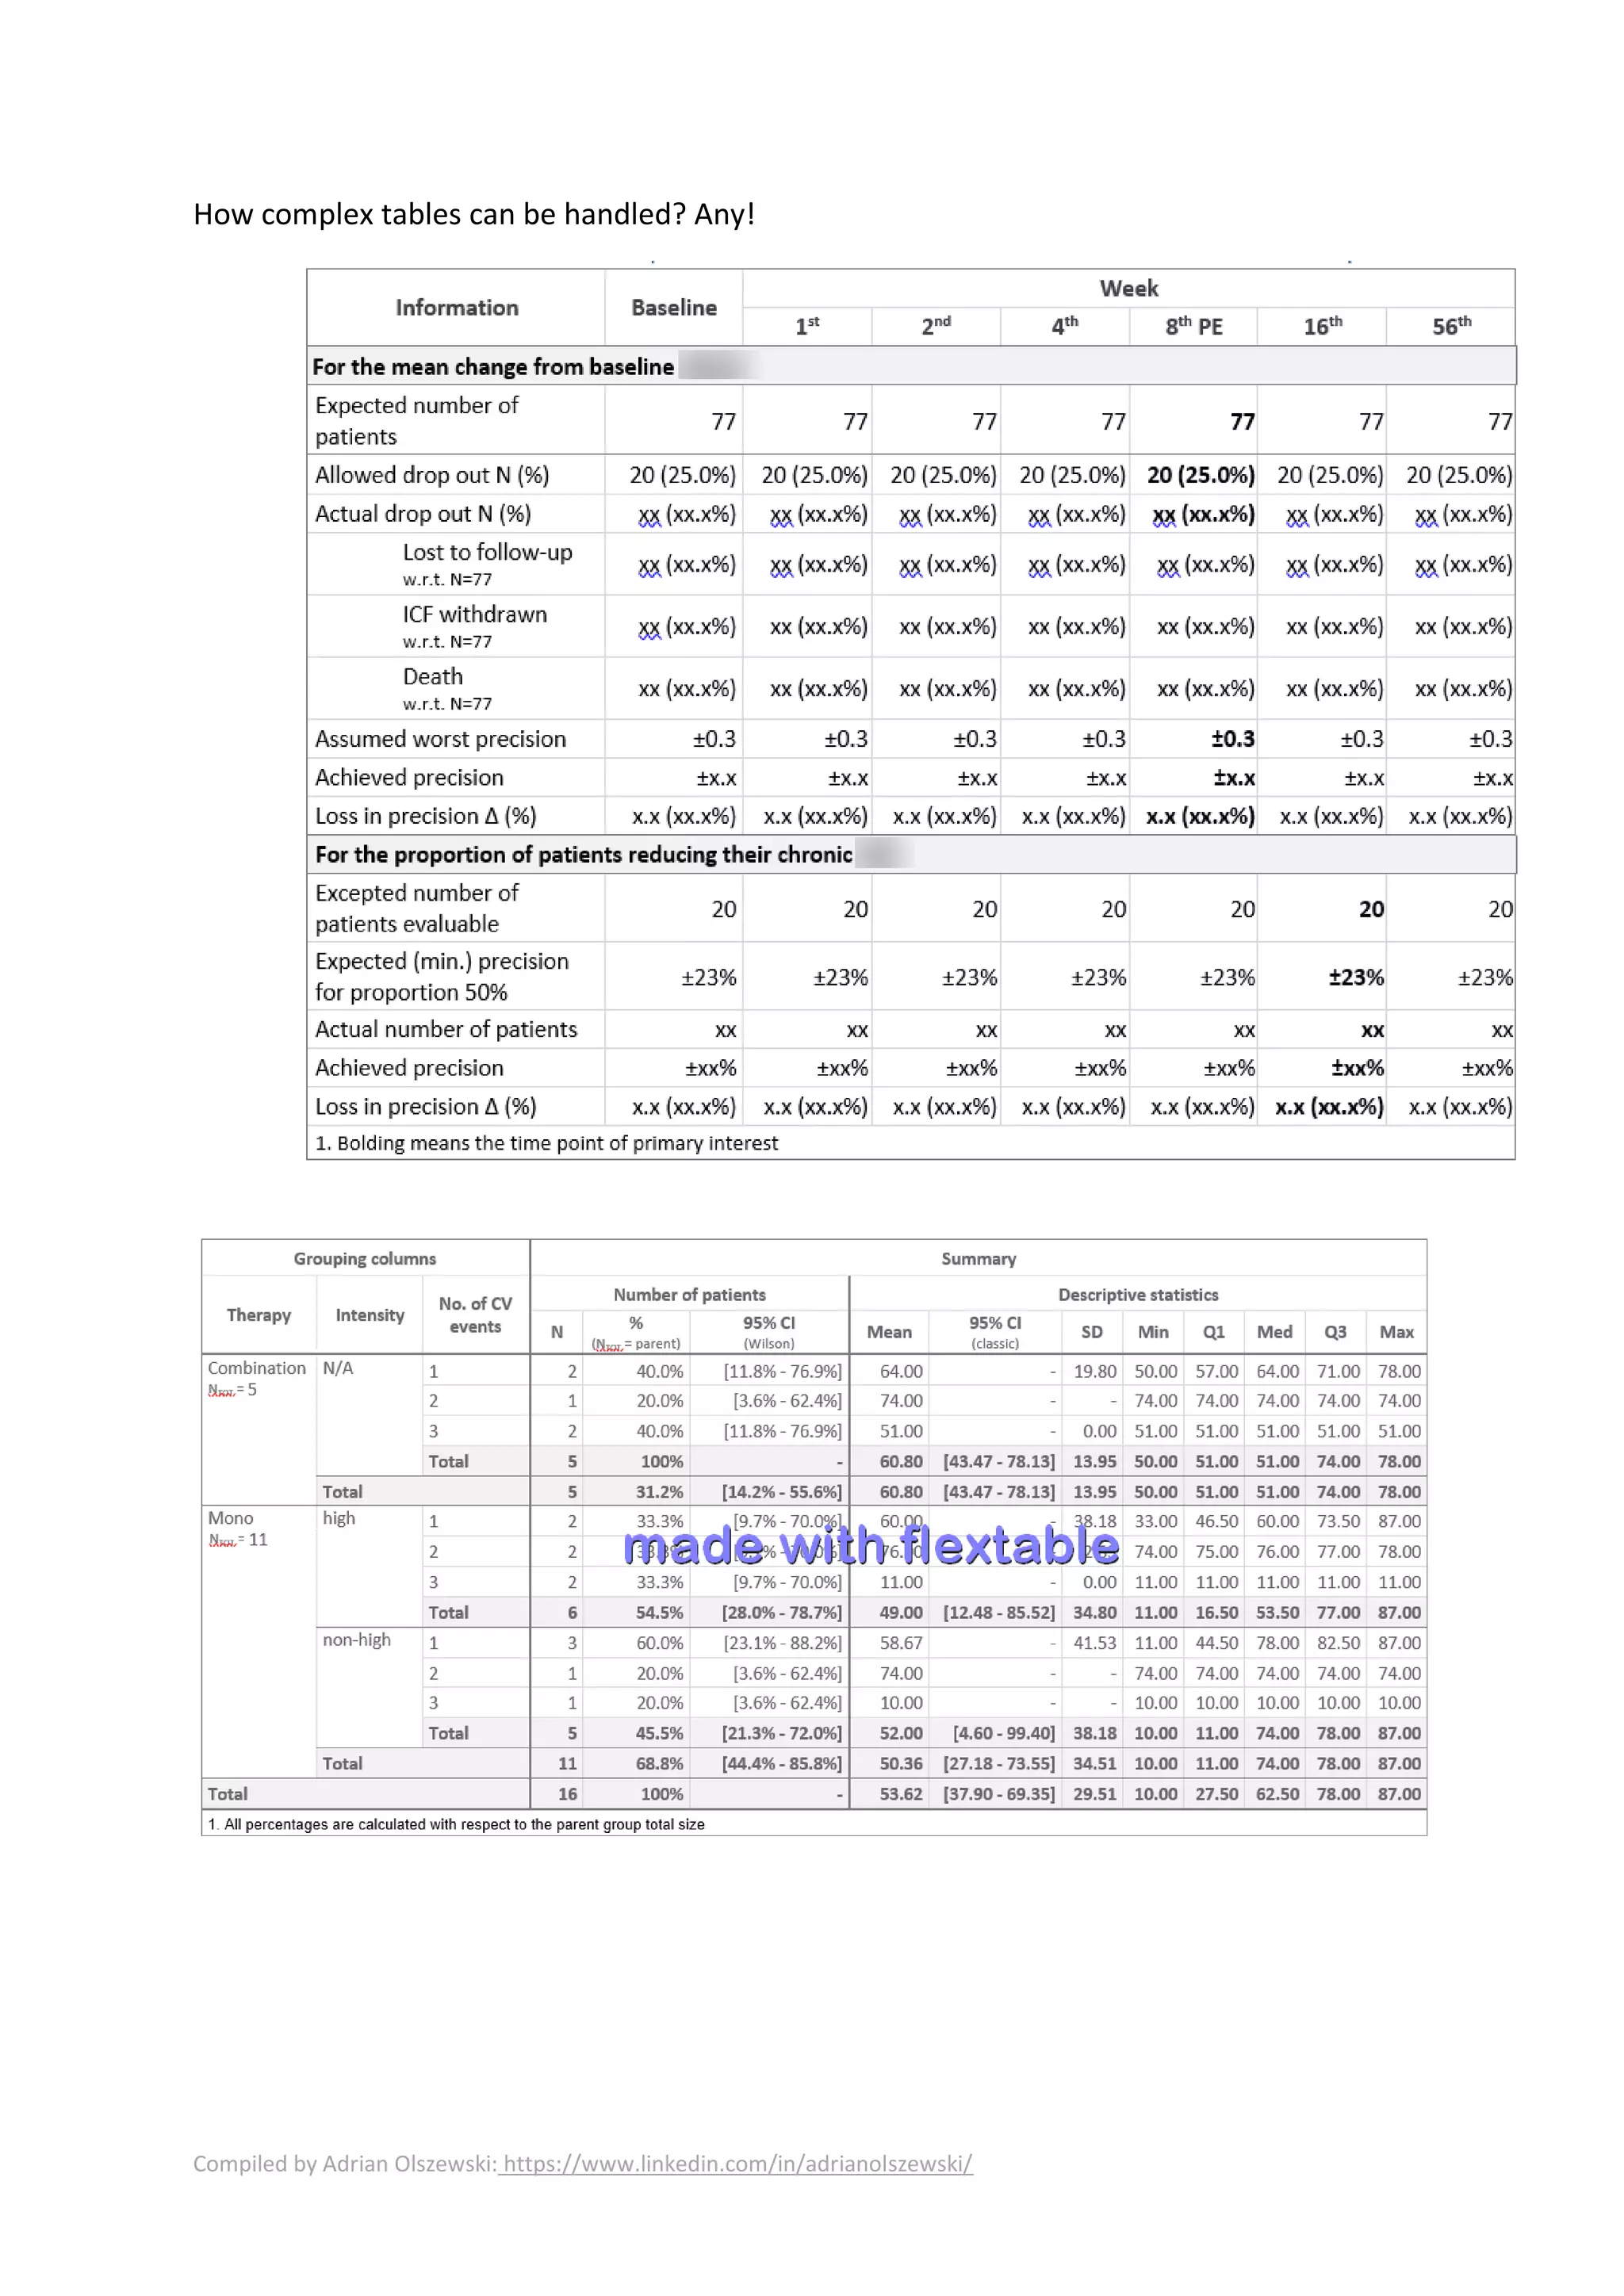
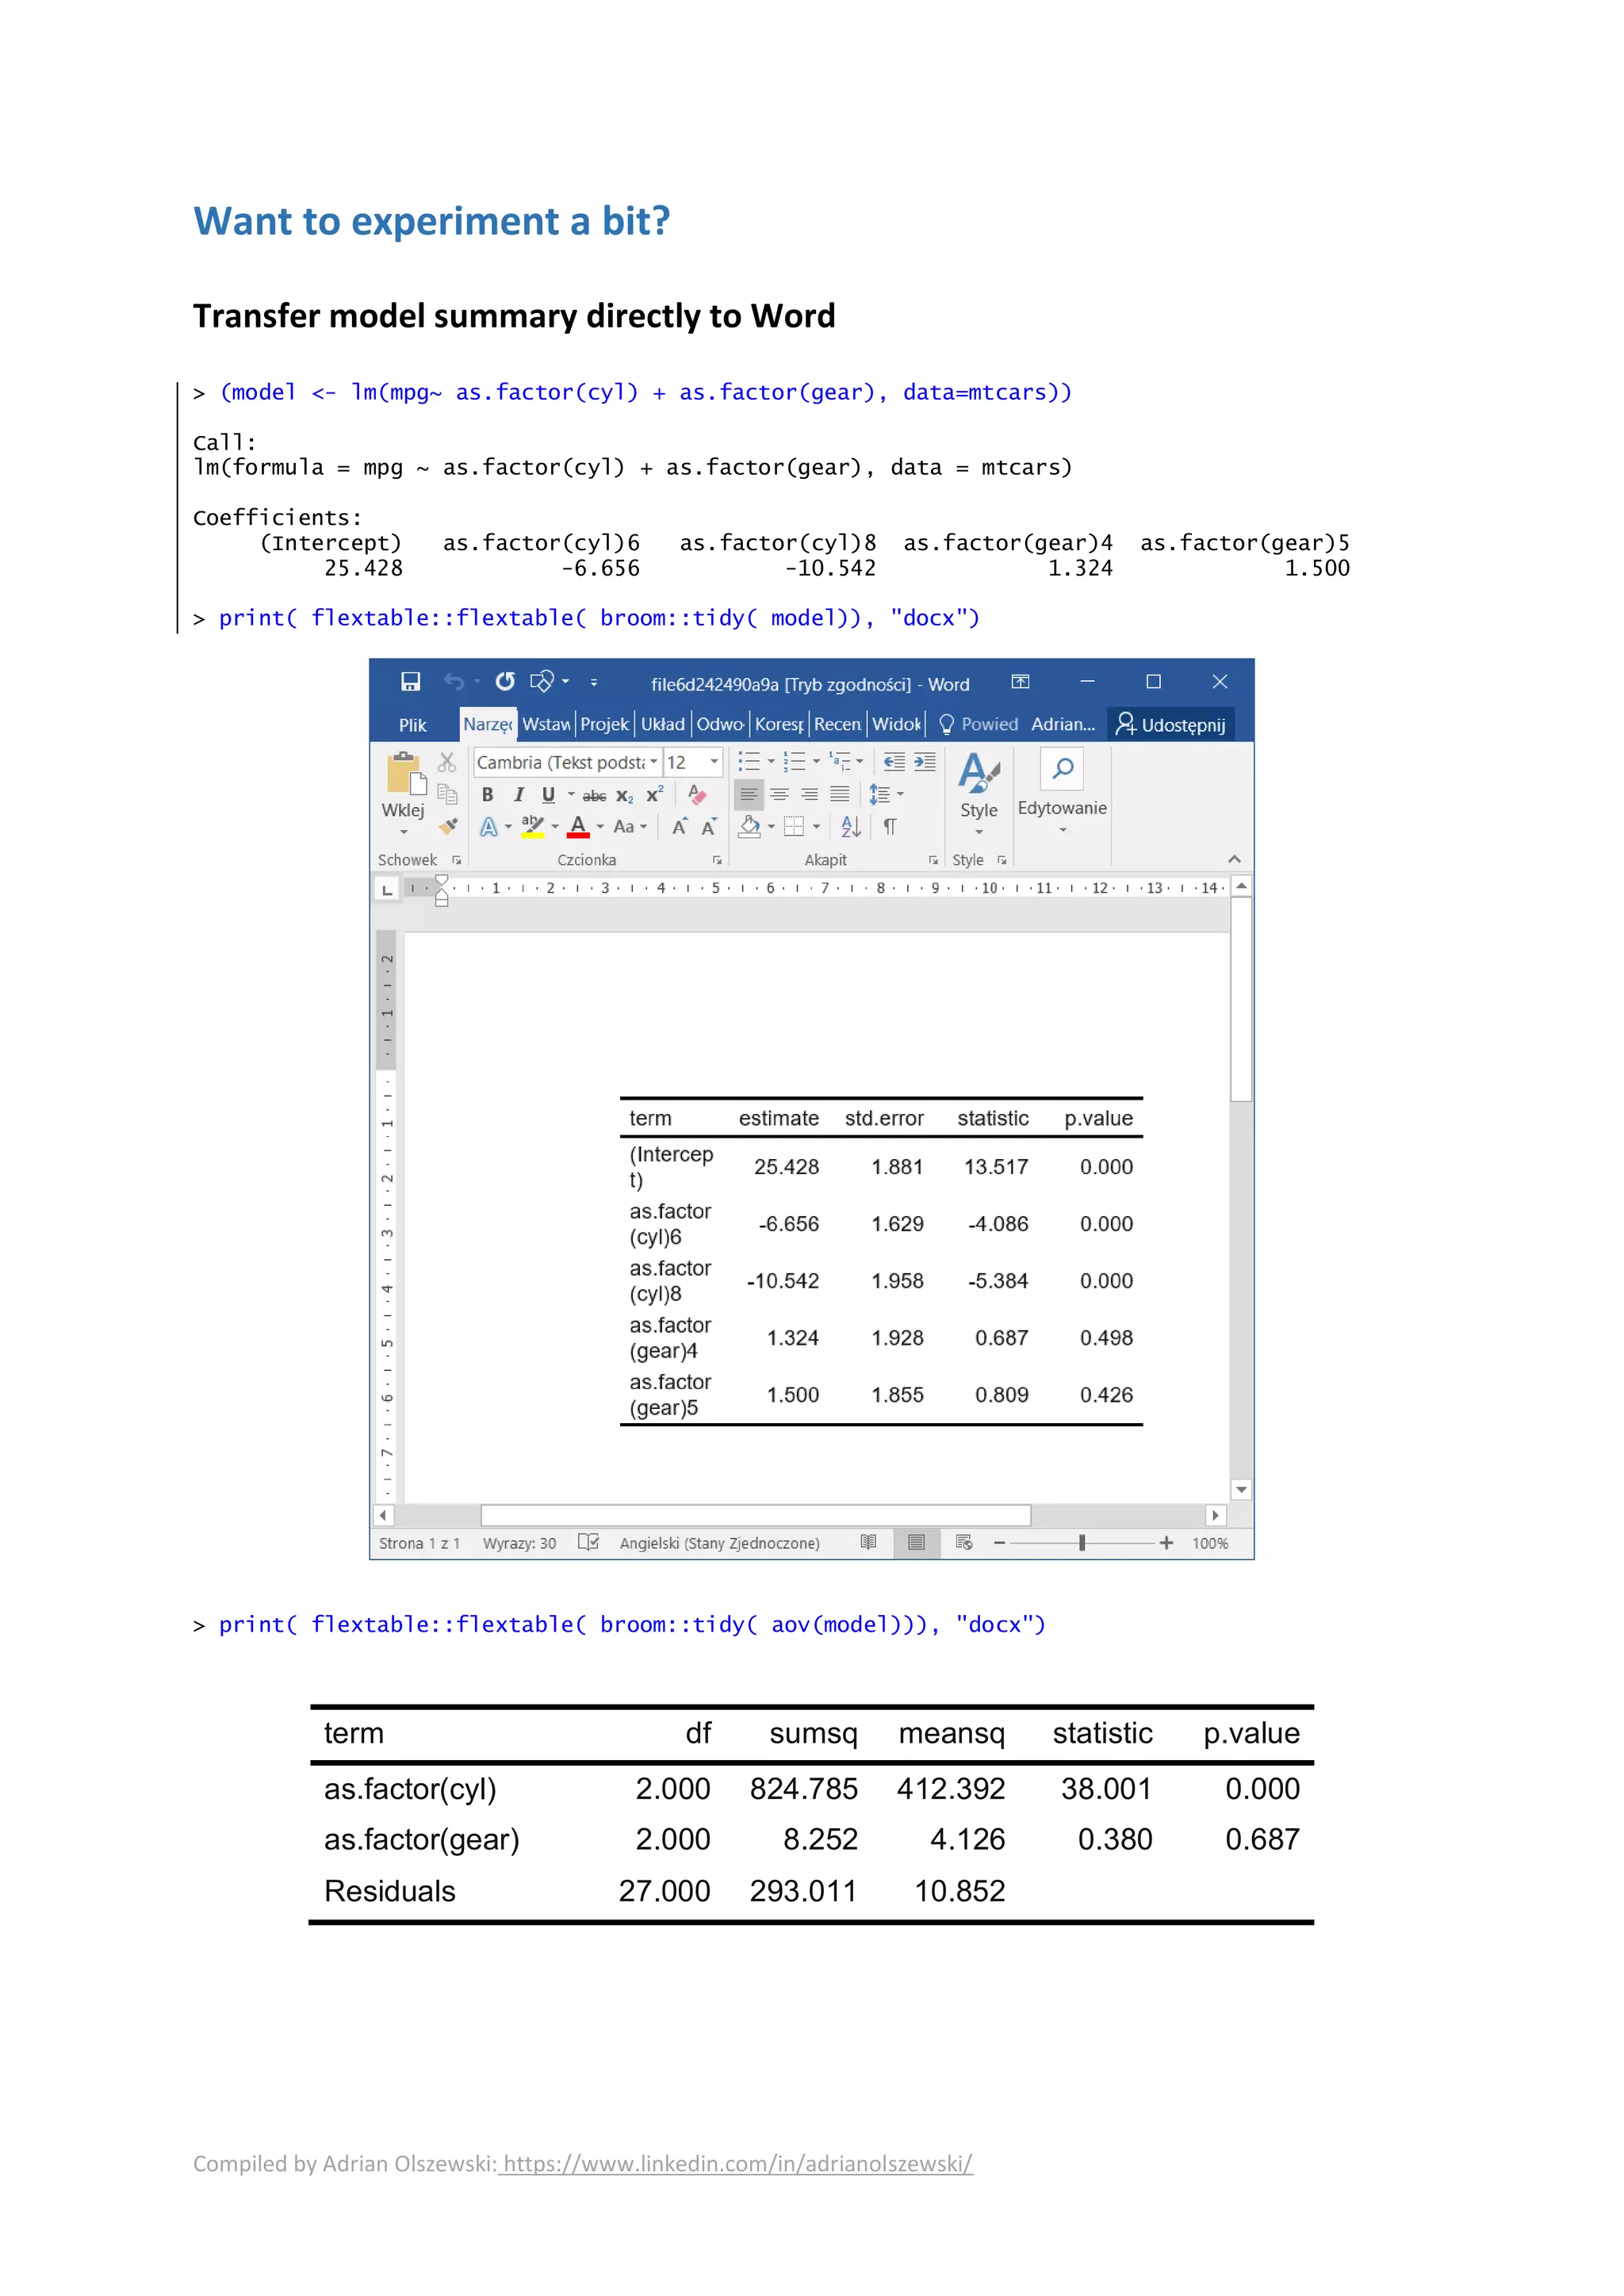
The document discusses R packages that allow users to generate rich, complex tables and documents in Microsoft Word and PowerPoint directly from R. It introduces the flextable, officer, devEMF, rvg, and mschart packages. Flextable allows creation of tables with control over formatting and styling. Officer can generate entire documents and embed plots. DevEMF and rvg convert ggplot2 plots to vector graphics that can be resized and edited within documents. Templates in Officer allow pre-defined reports. Examples demonstrate functions for exporting model summaries and plots to Word and PowerPoint.


![Compiled by Adrian Olszewski: https://www.linkedin.com/in/adrianolszewski/
Export R drawings to a vector graphics you can resize without blur
ggplot2_to_Word <- function(plot, where){
filename <- tempfile(fileext = ".emf")
devEMF::emf(file = filename, width = 6, height = 7)
print(plot)
dev.off()
officer::read_docx() %>%
officer::body_add_img(src = filename, width = 6, height = 7) %>%
print(target = where)
}
ggplot2_to_Word( ggplot2::qplot(mtcars$mpg), "test.docx")
`stat_bin()` using `bins = 30`. Pick better value with `binwidth`.
[1] "C:/tmp/test.docx"
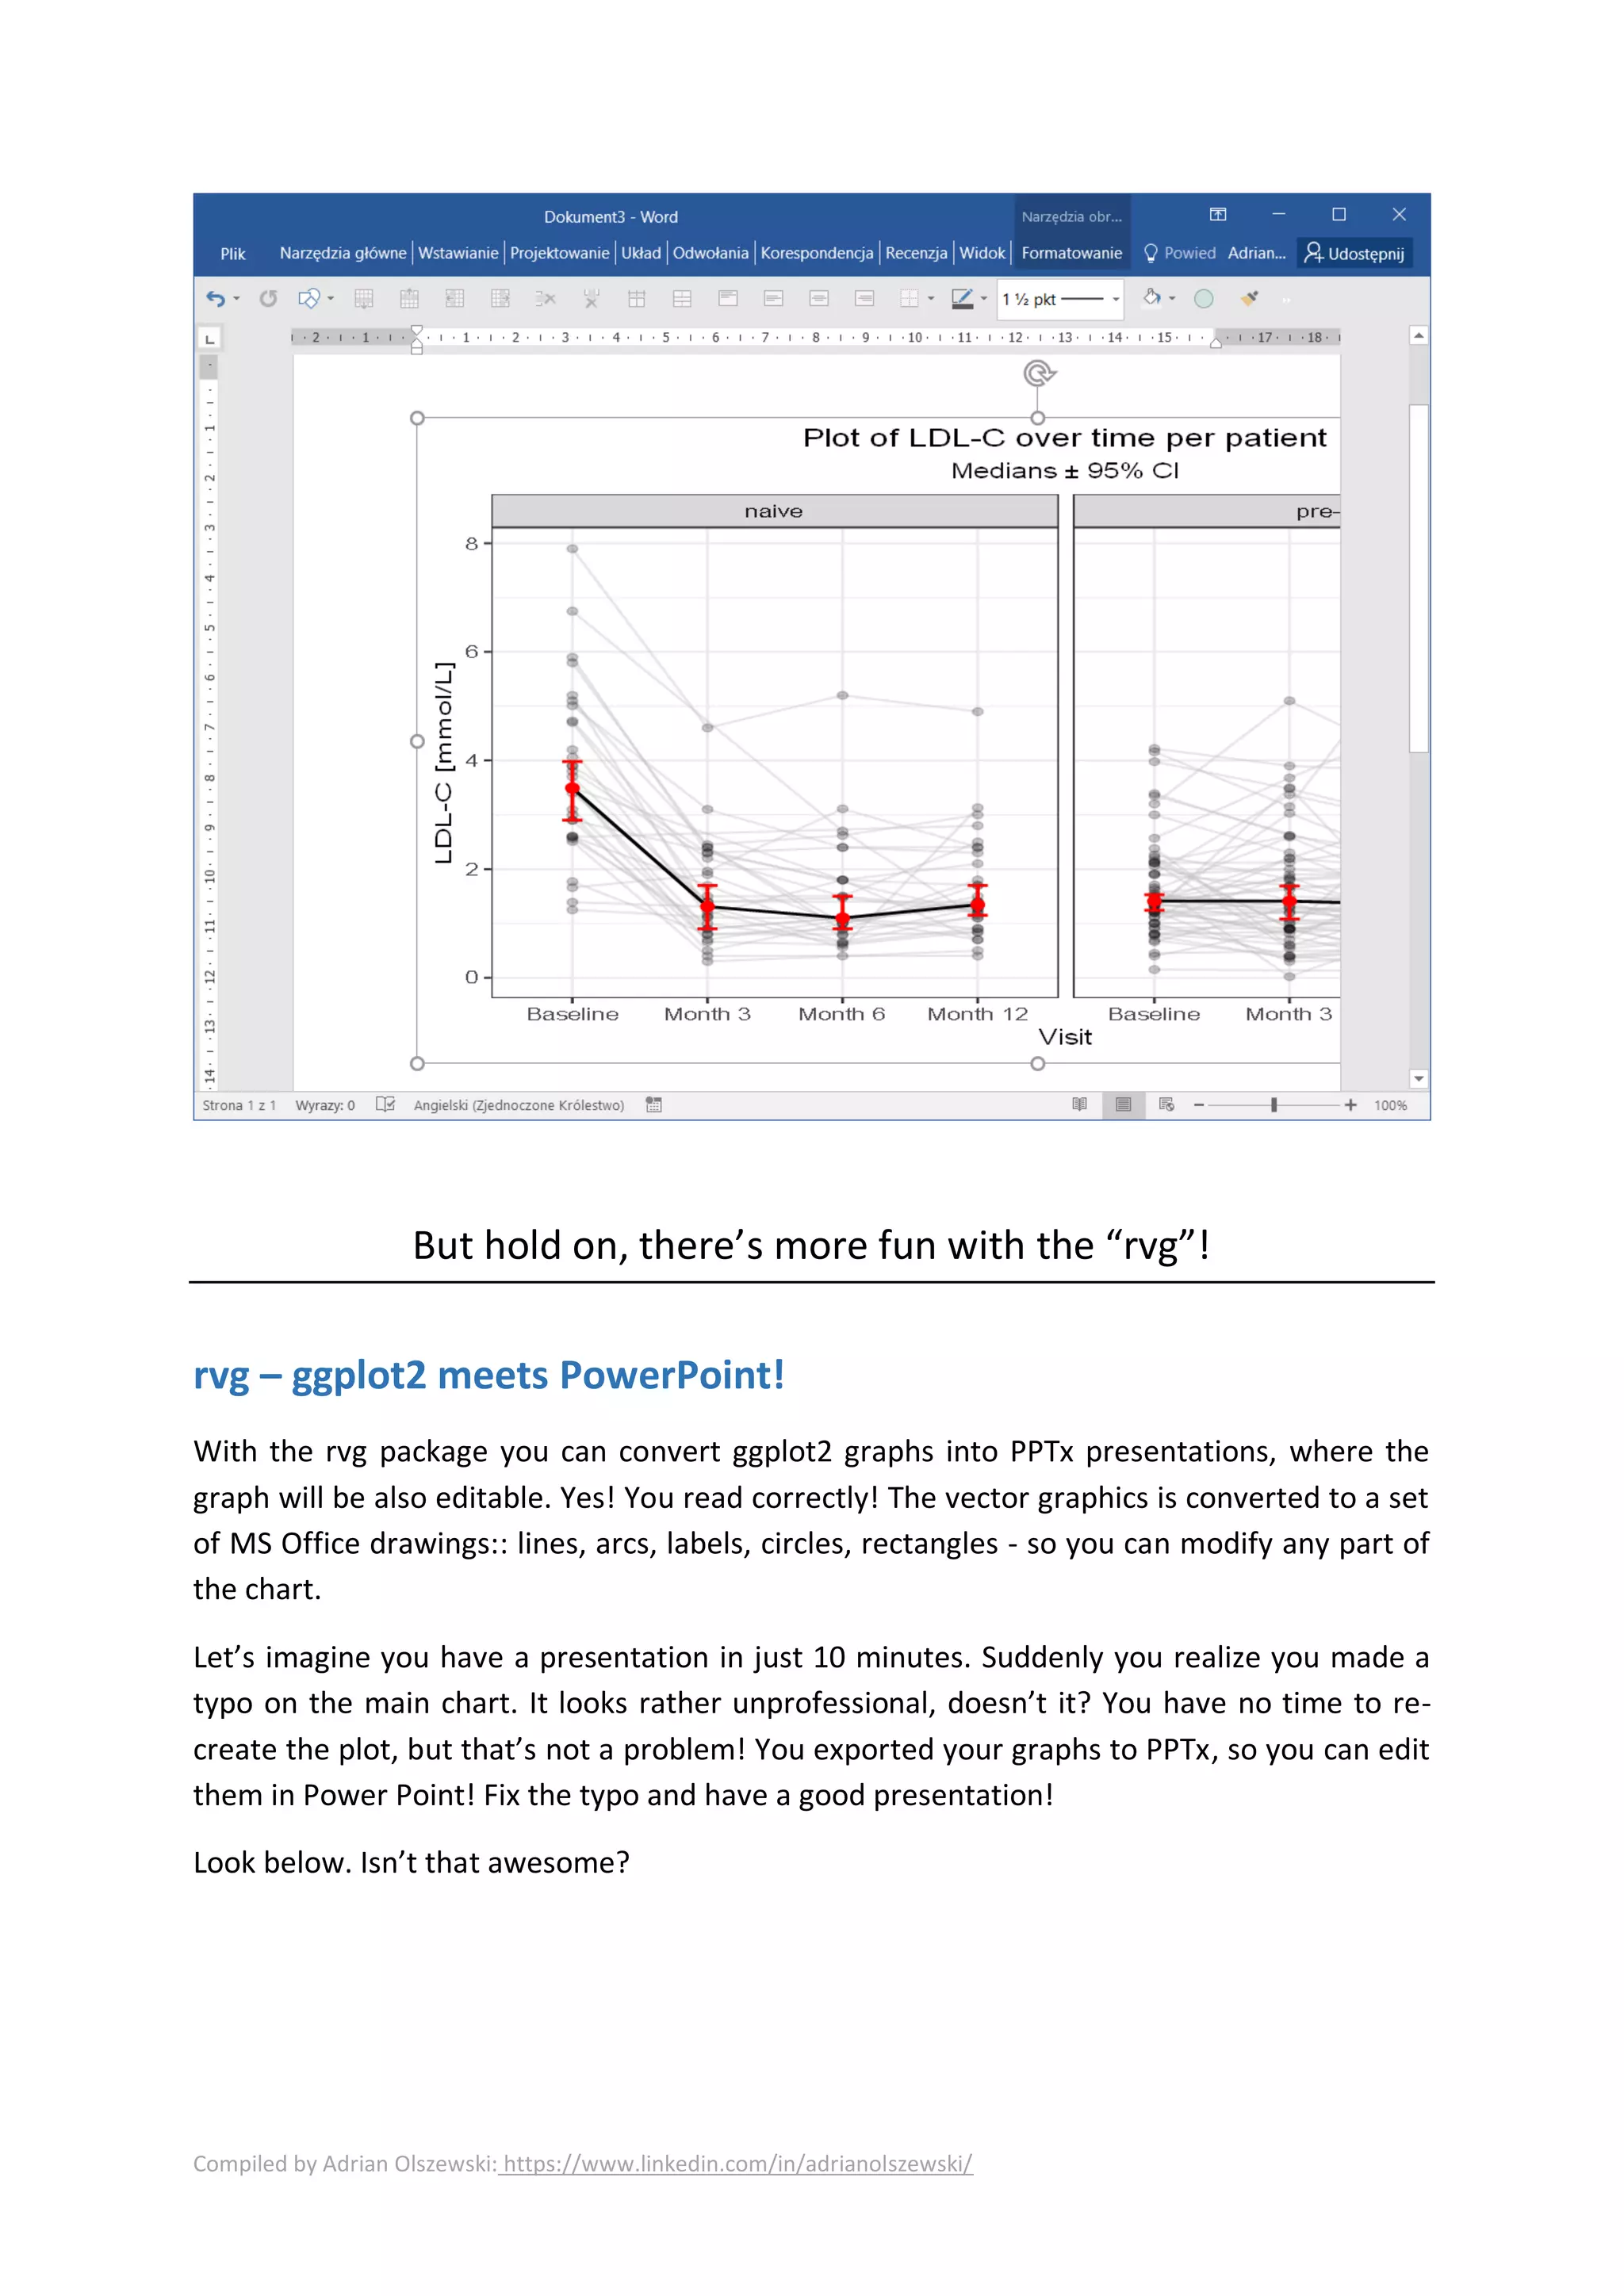
Export ggplot2 to an editable MS Office® drawing (in PowerPoint®)
ggplot2_to_pptx <- function(plots, where){
doc <- officer::read_pptx()
for(plot in plots){
if(ggplot2::is.ggplot(plot)) {
doc <- officer::add_slide(doc,
layout = "Title and Content",
master = "Office Theme") %>%
officer::ph_with(rvg::dml(ggobj = plot),
location = officer::ph_location_type(type = "body"))
}
}
print(doc, target = where)
}
ggplot2_to_pptx( list(ggplot2::qplot(mtcars$mpg)), "test.pptx")
`stat_bin()` using `bins = 30`. Pick better value with `binwidth`.
[1] "C:/tmp/test.pptx"
0
1
2
3
4
5
10 15 20 25 30 35
mtcars$mpg](https://image.slidesharecdn.com/flextableofficer-211207041306/75/Flextable-and-Officer-14-2048.jpg)