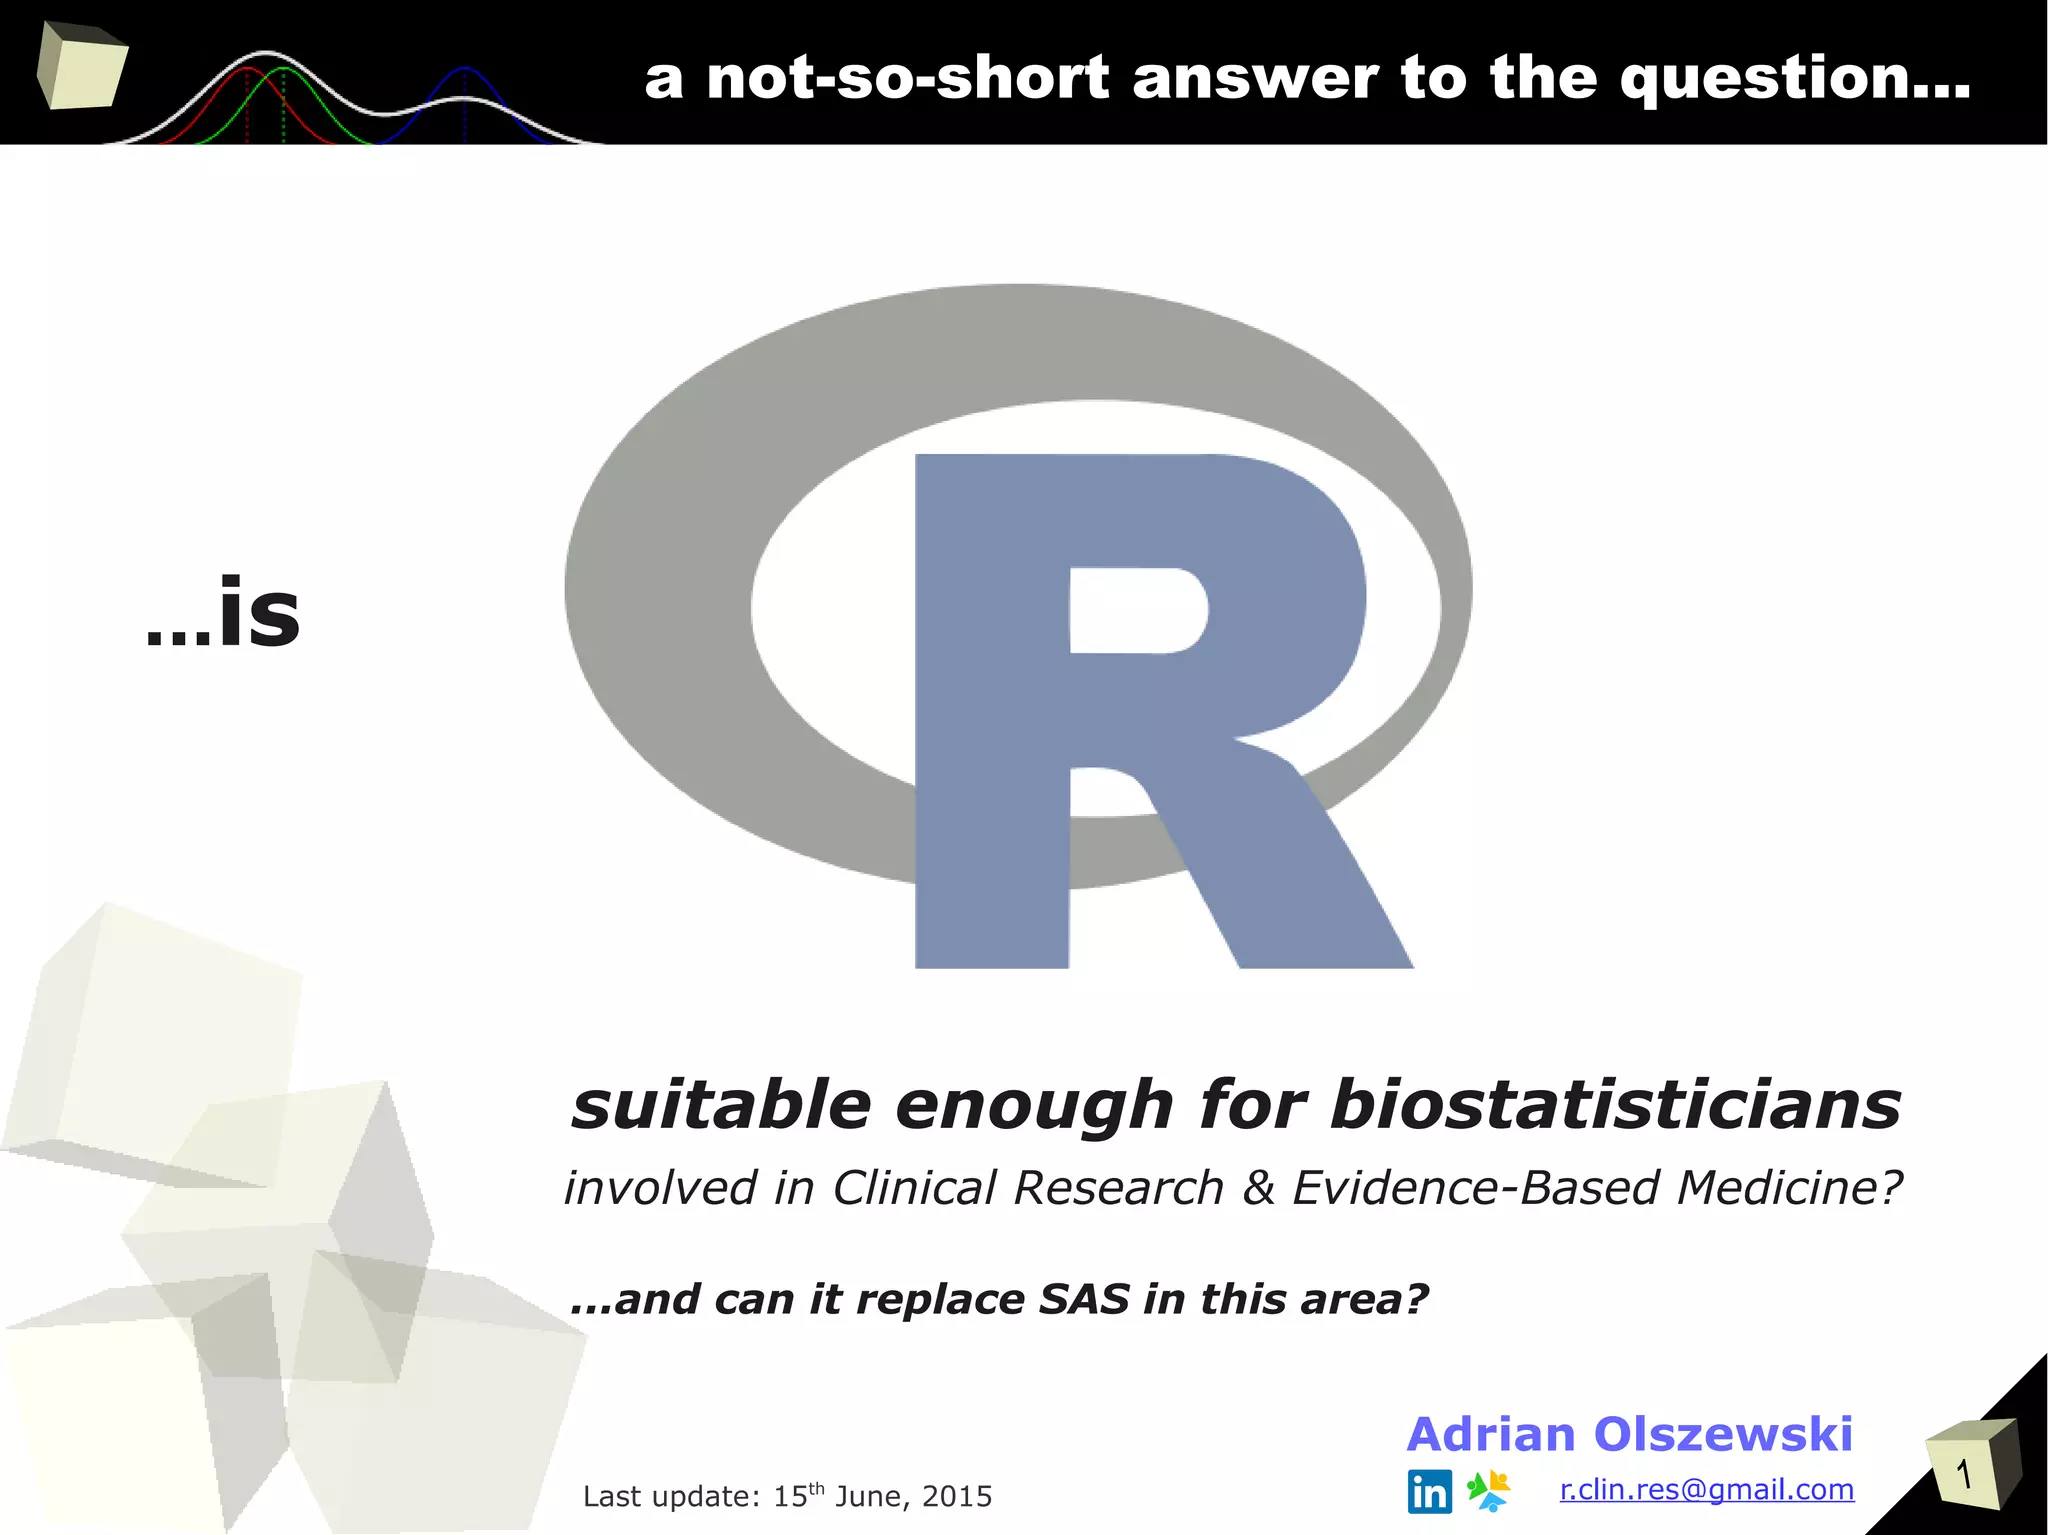
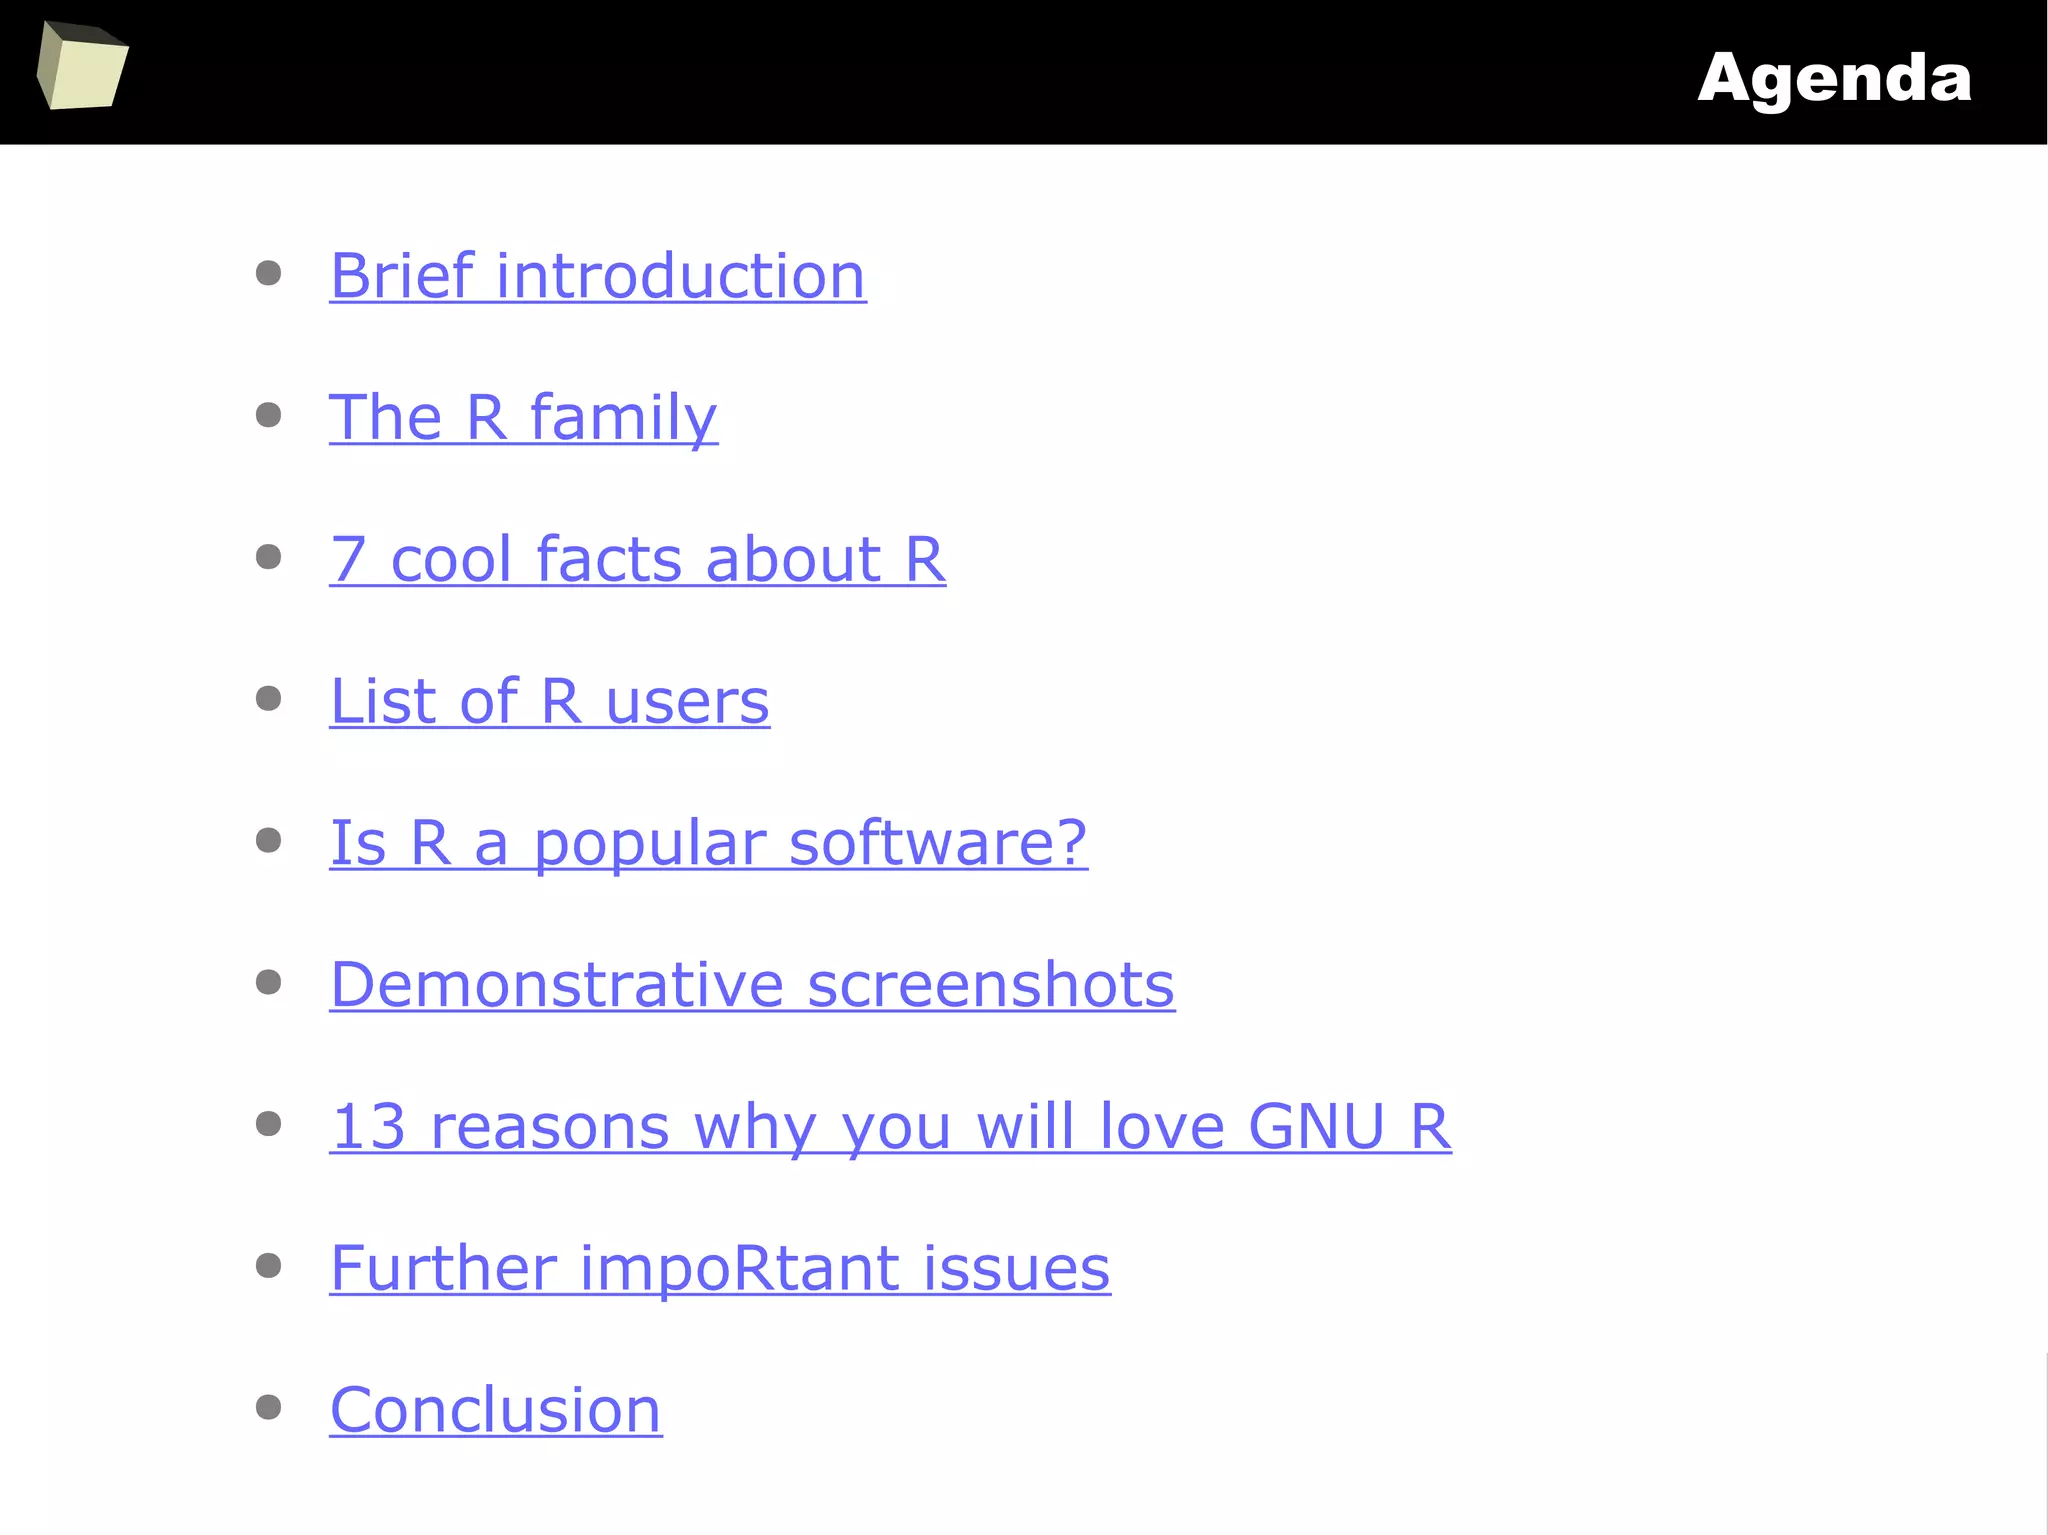
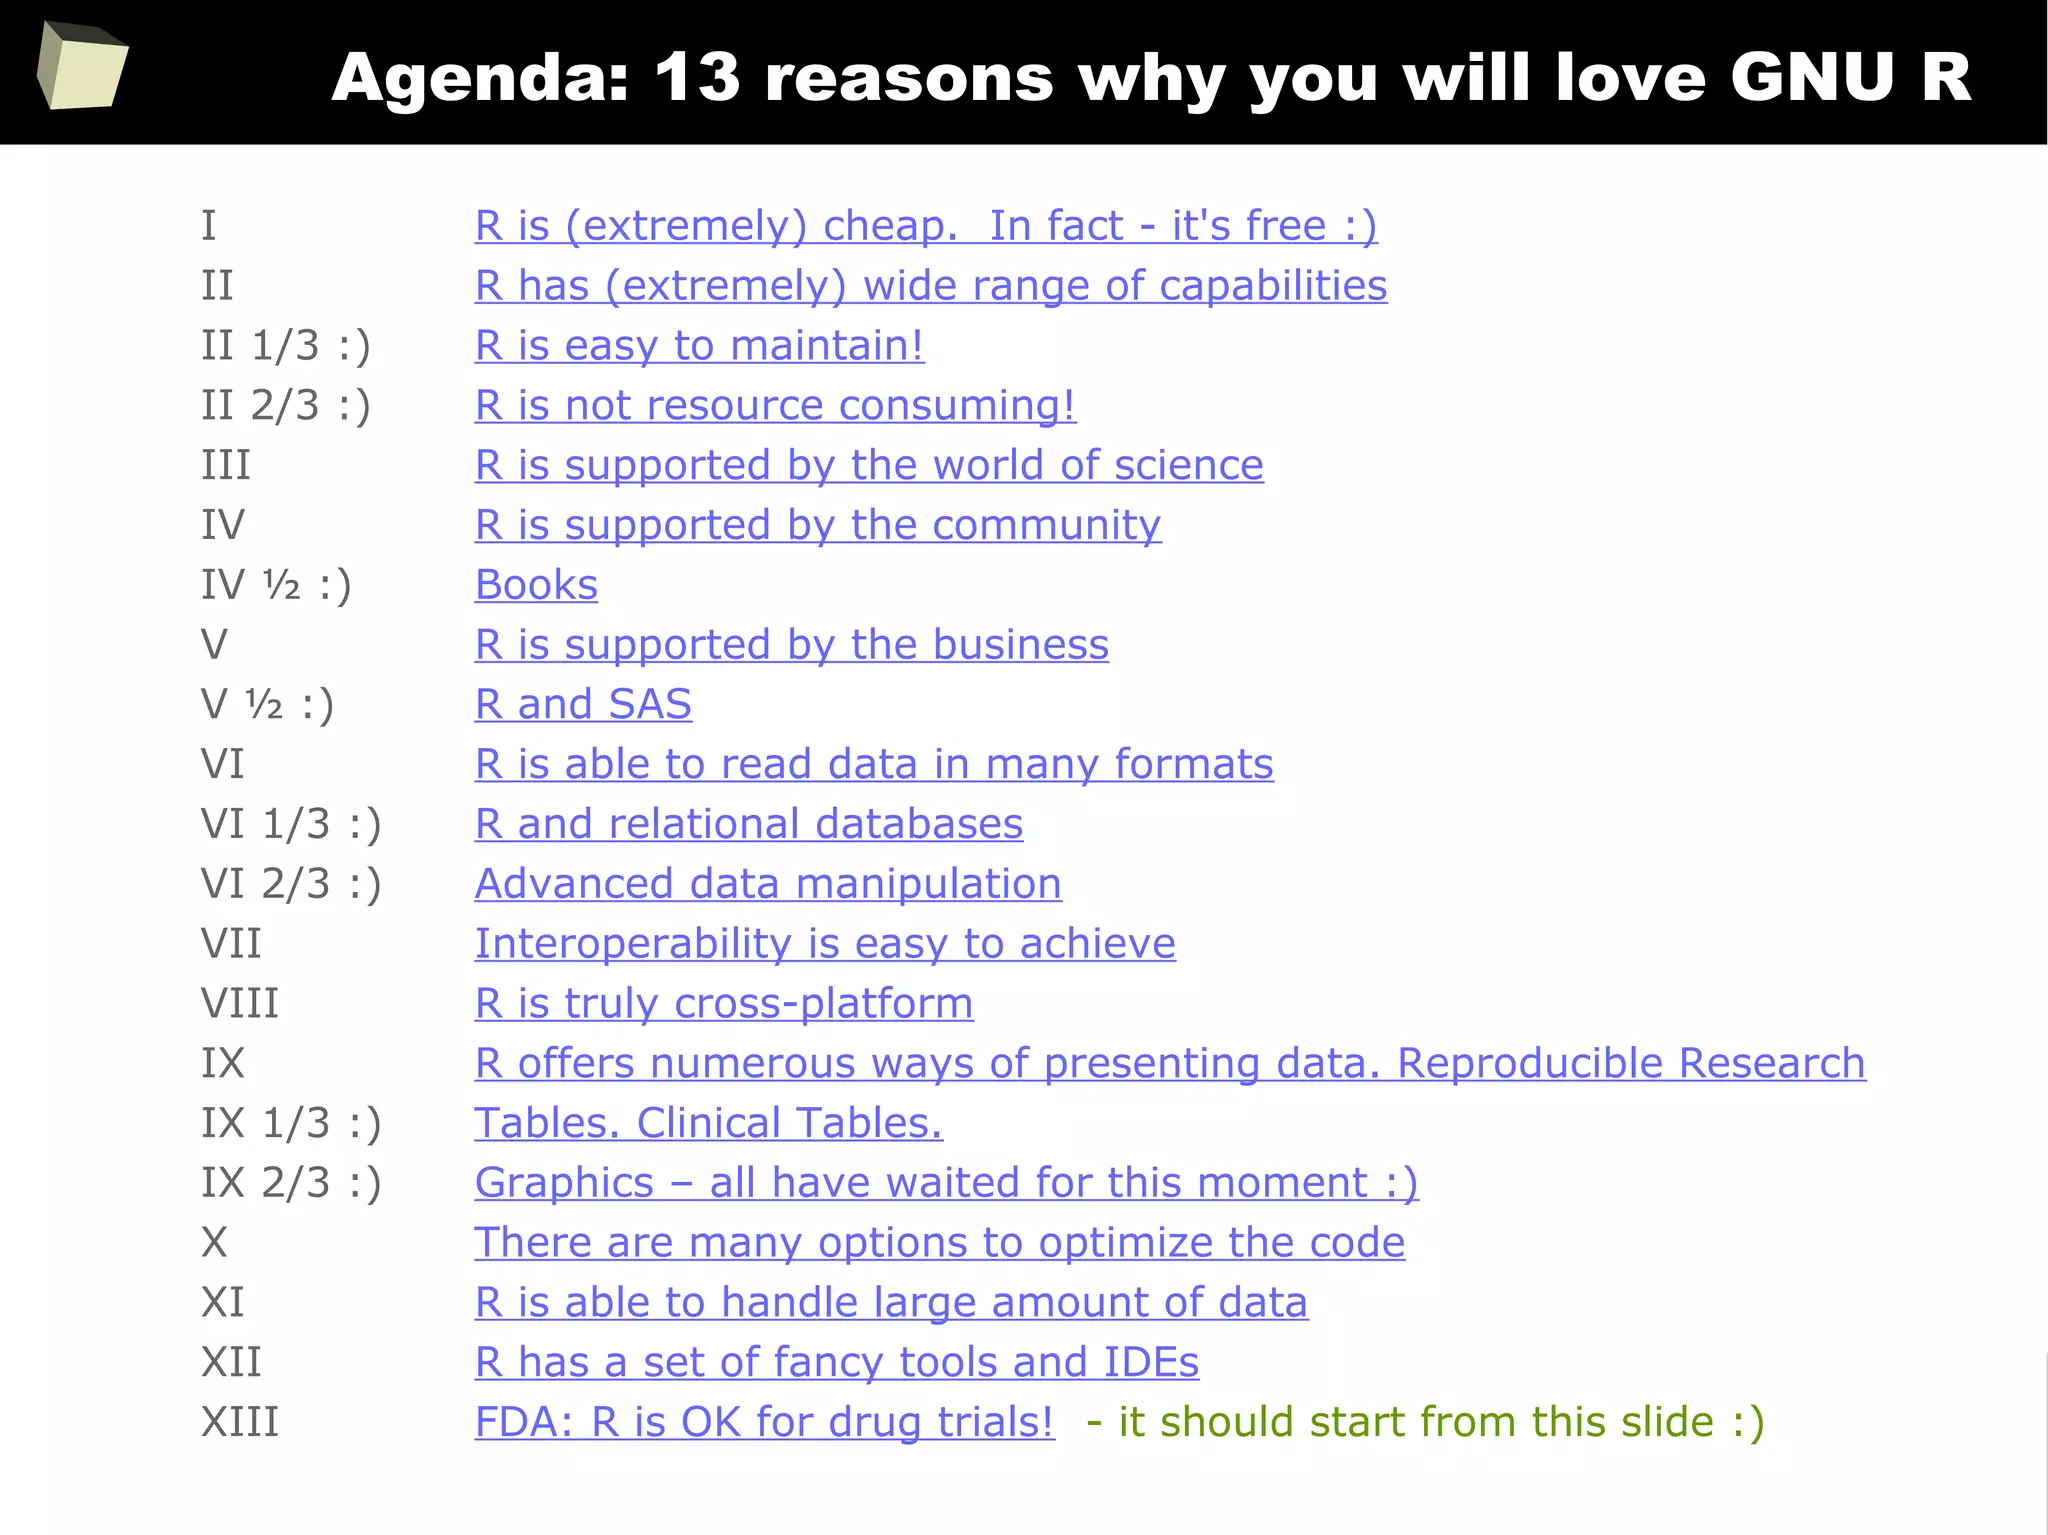
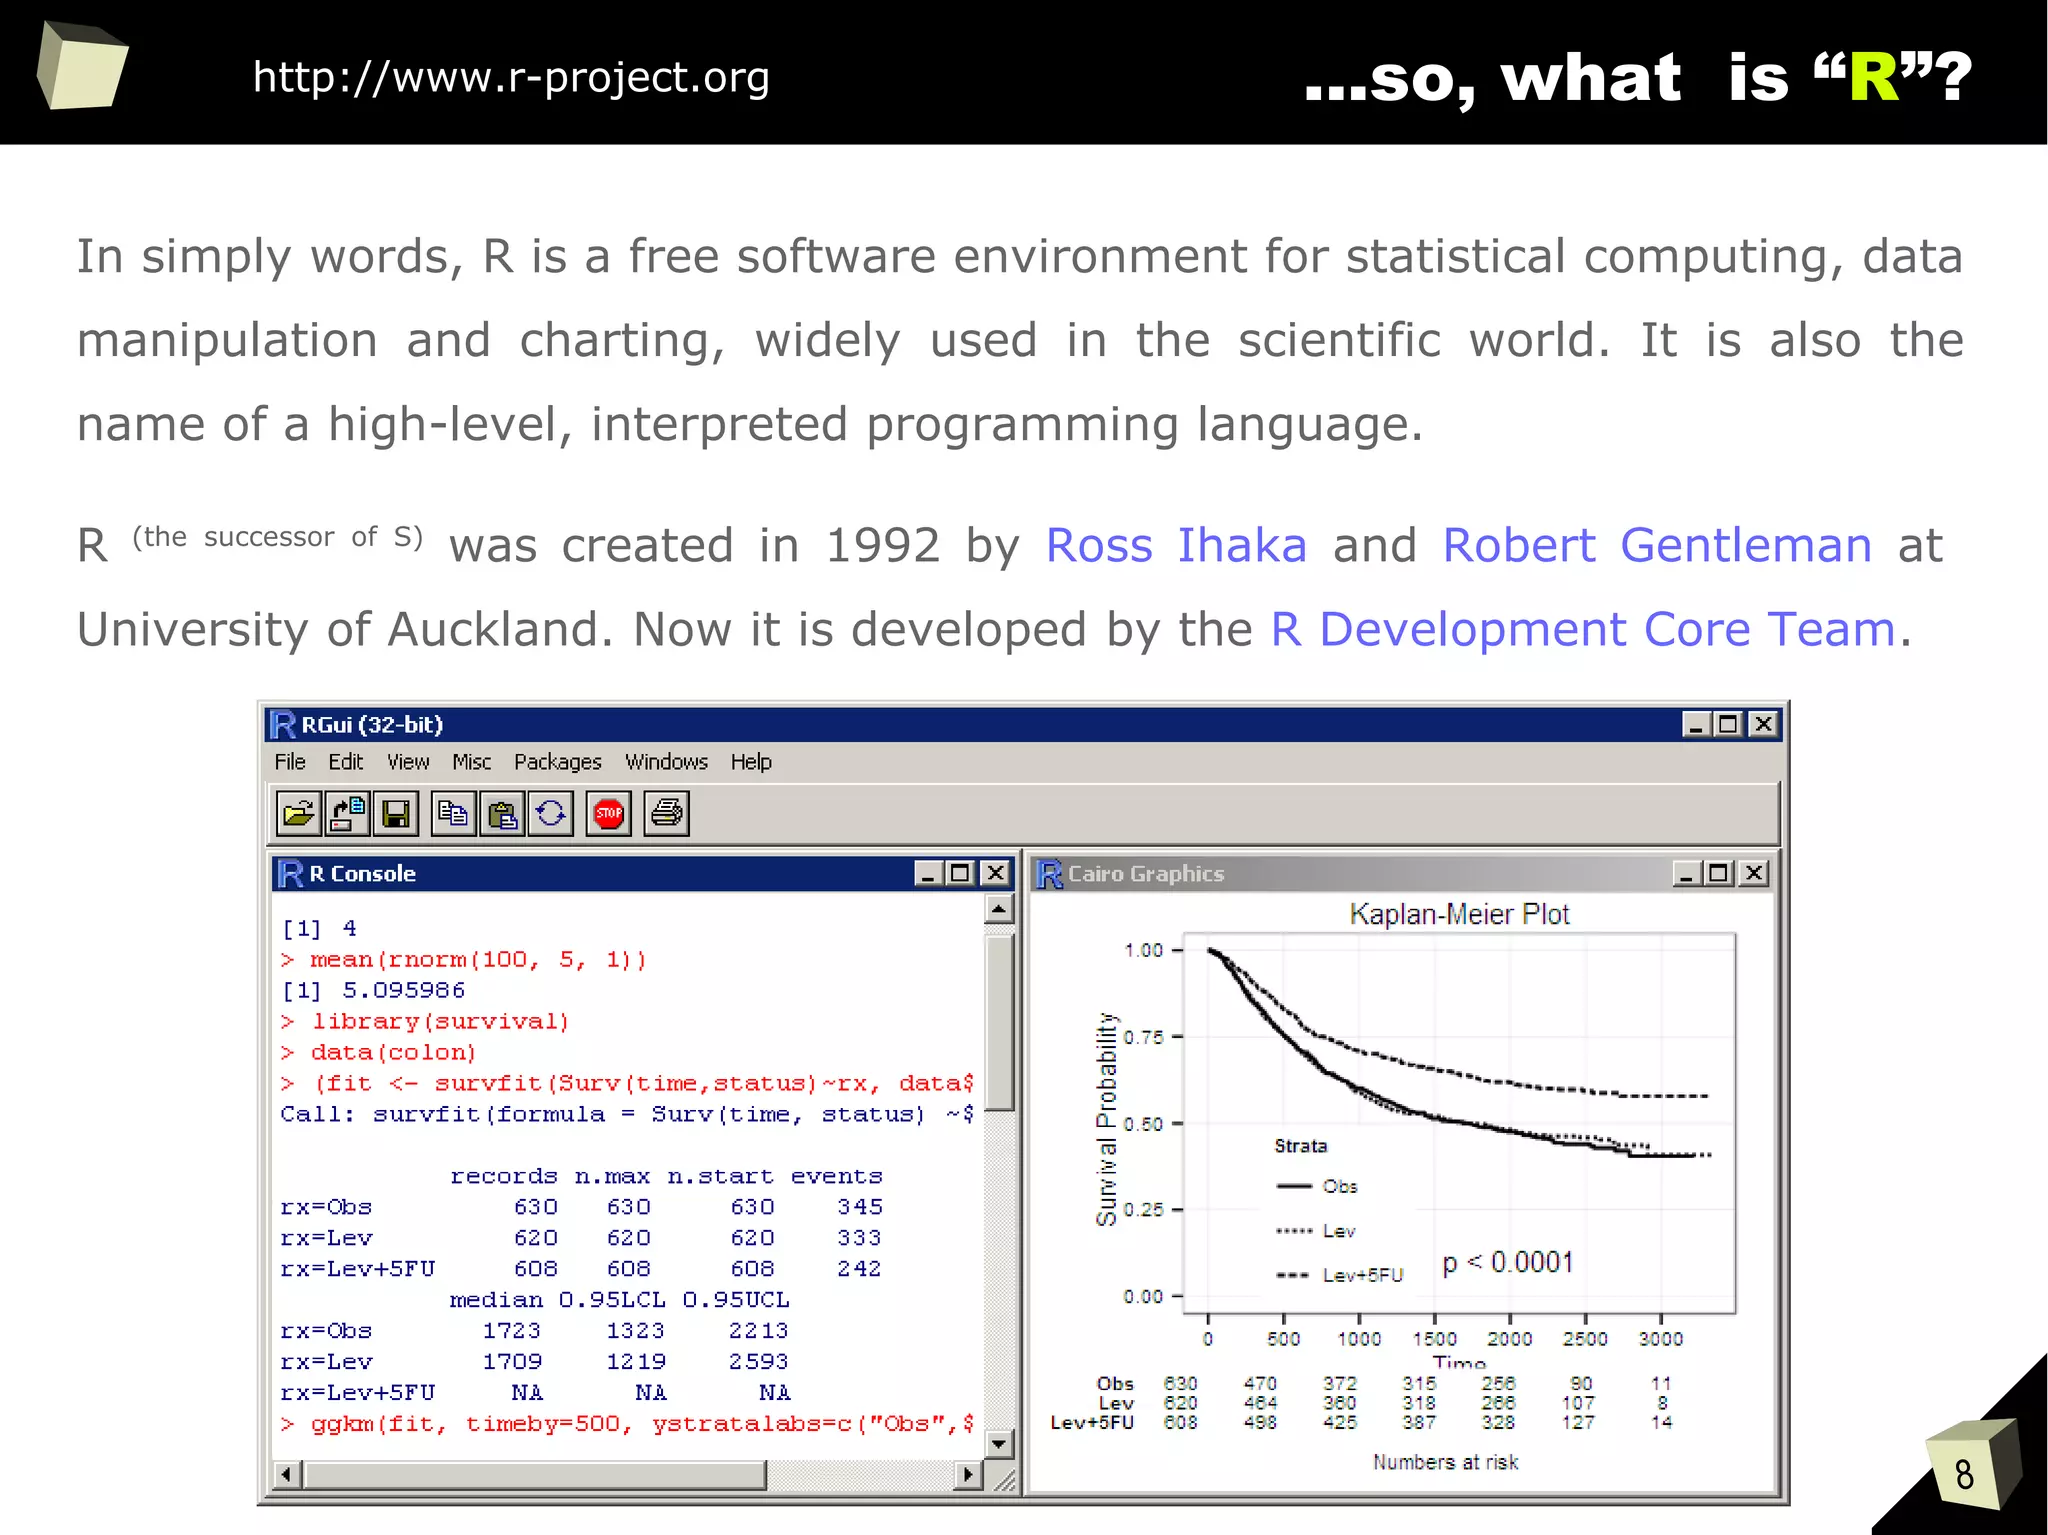
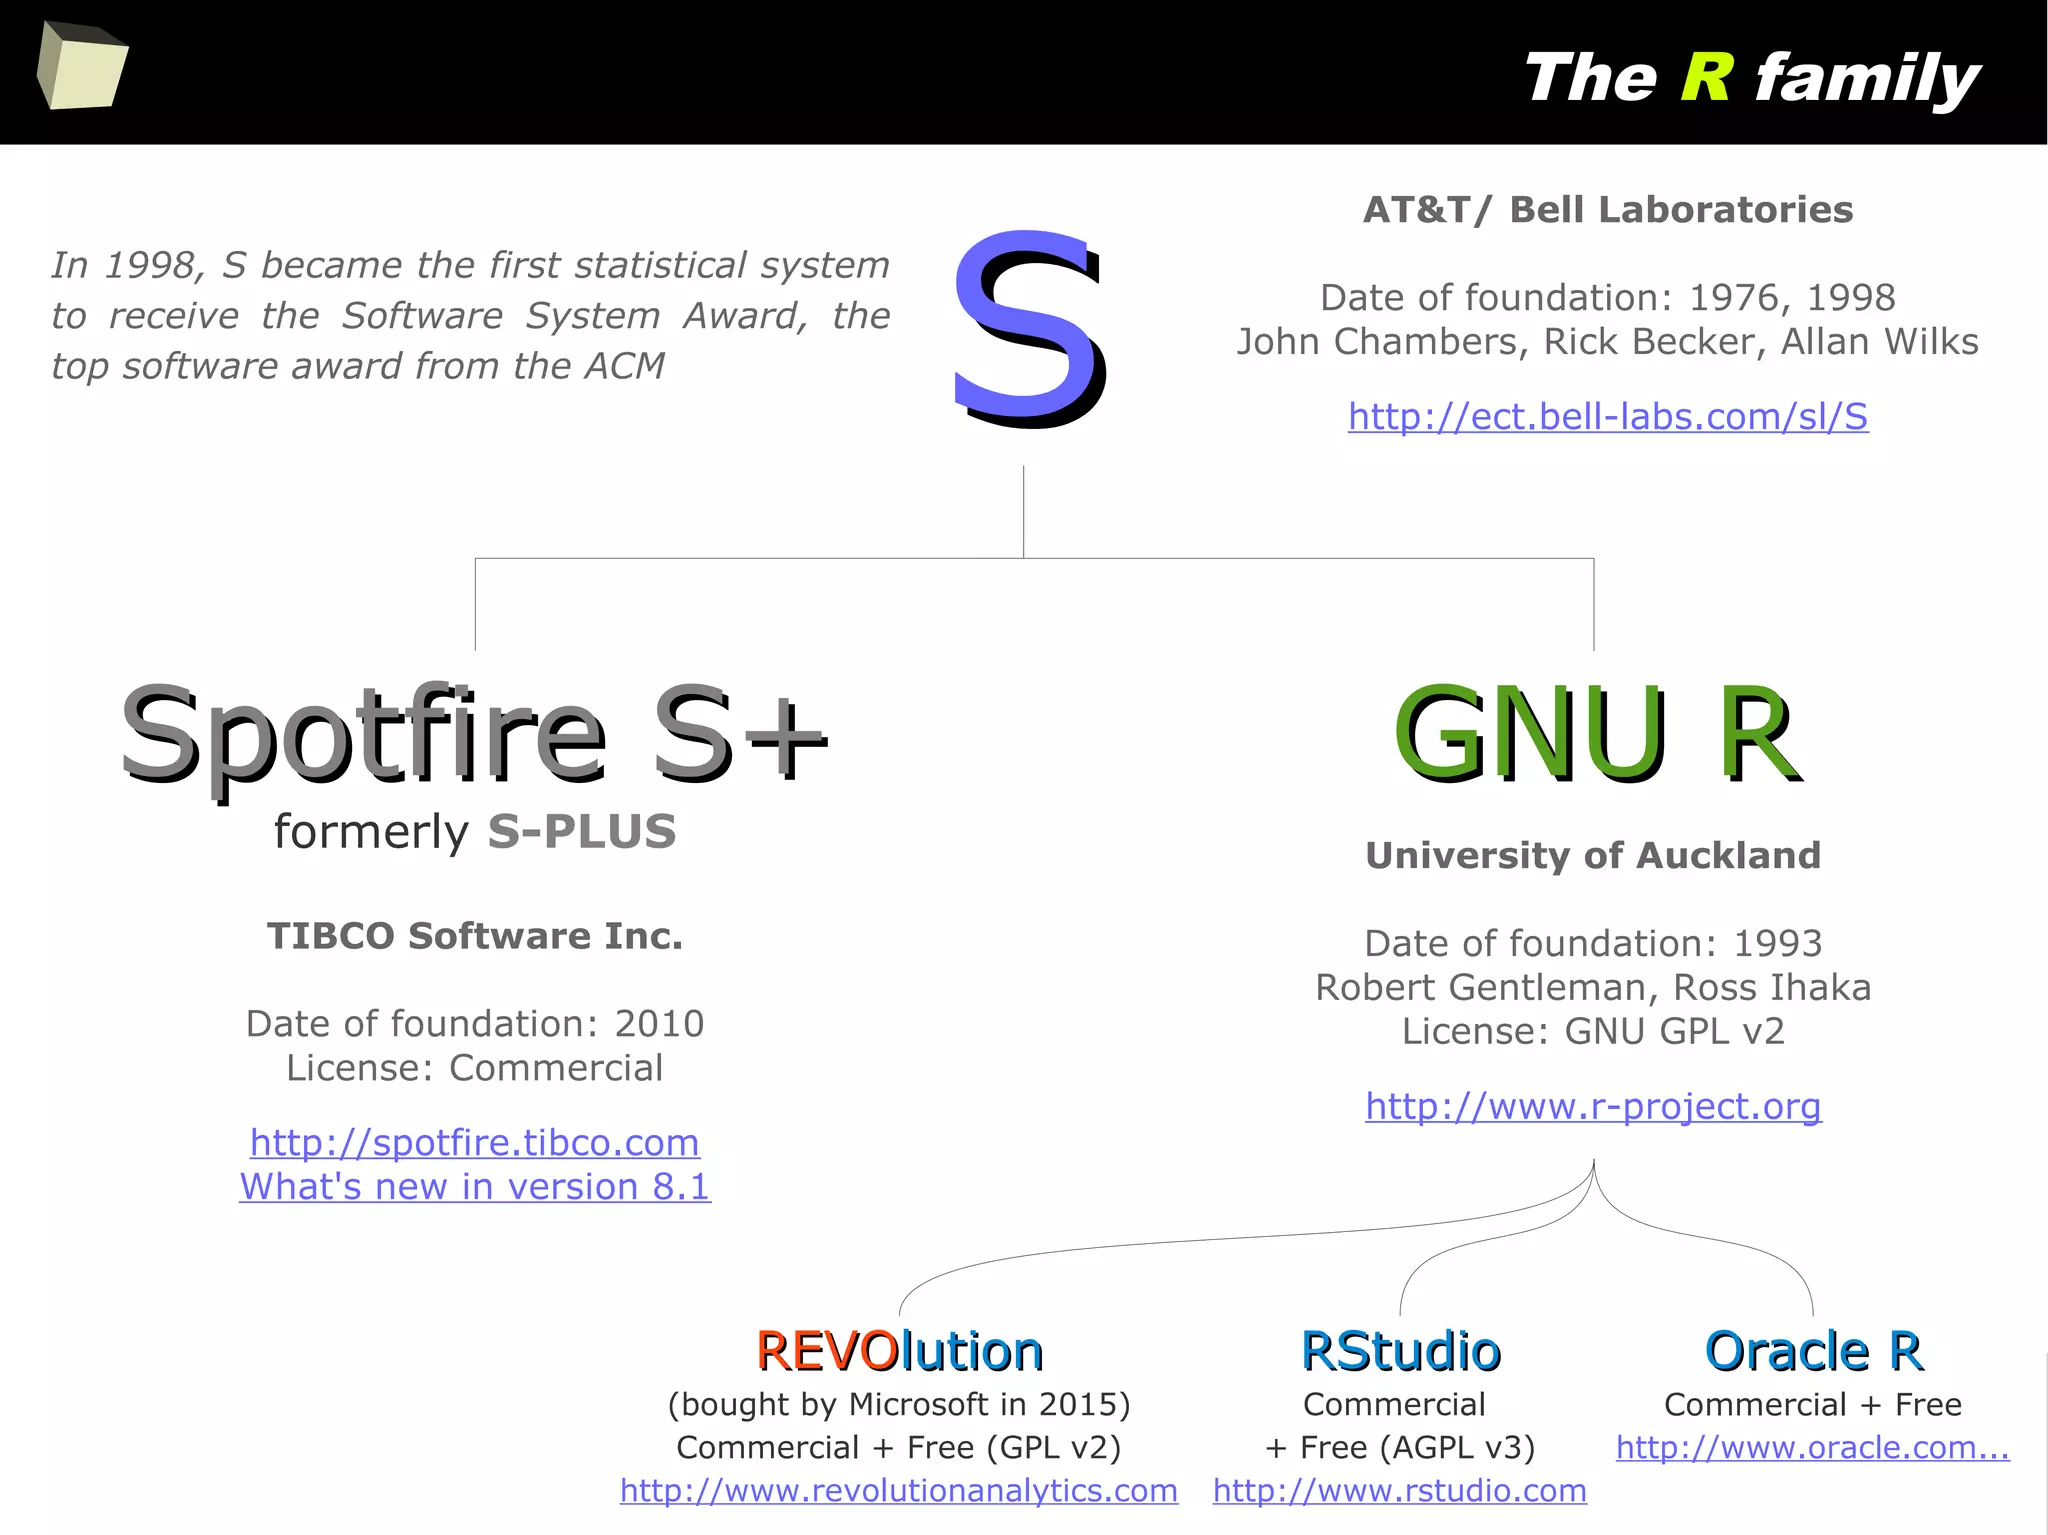
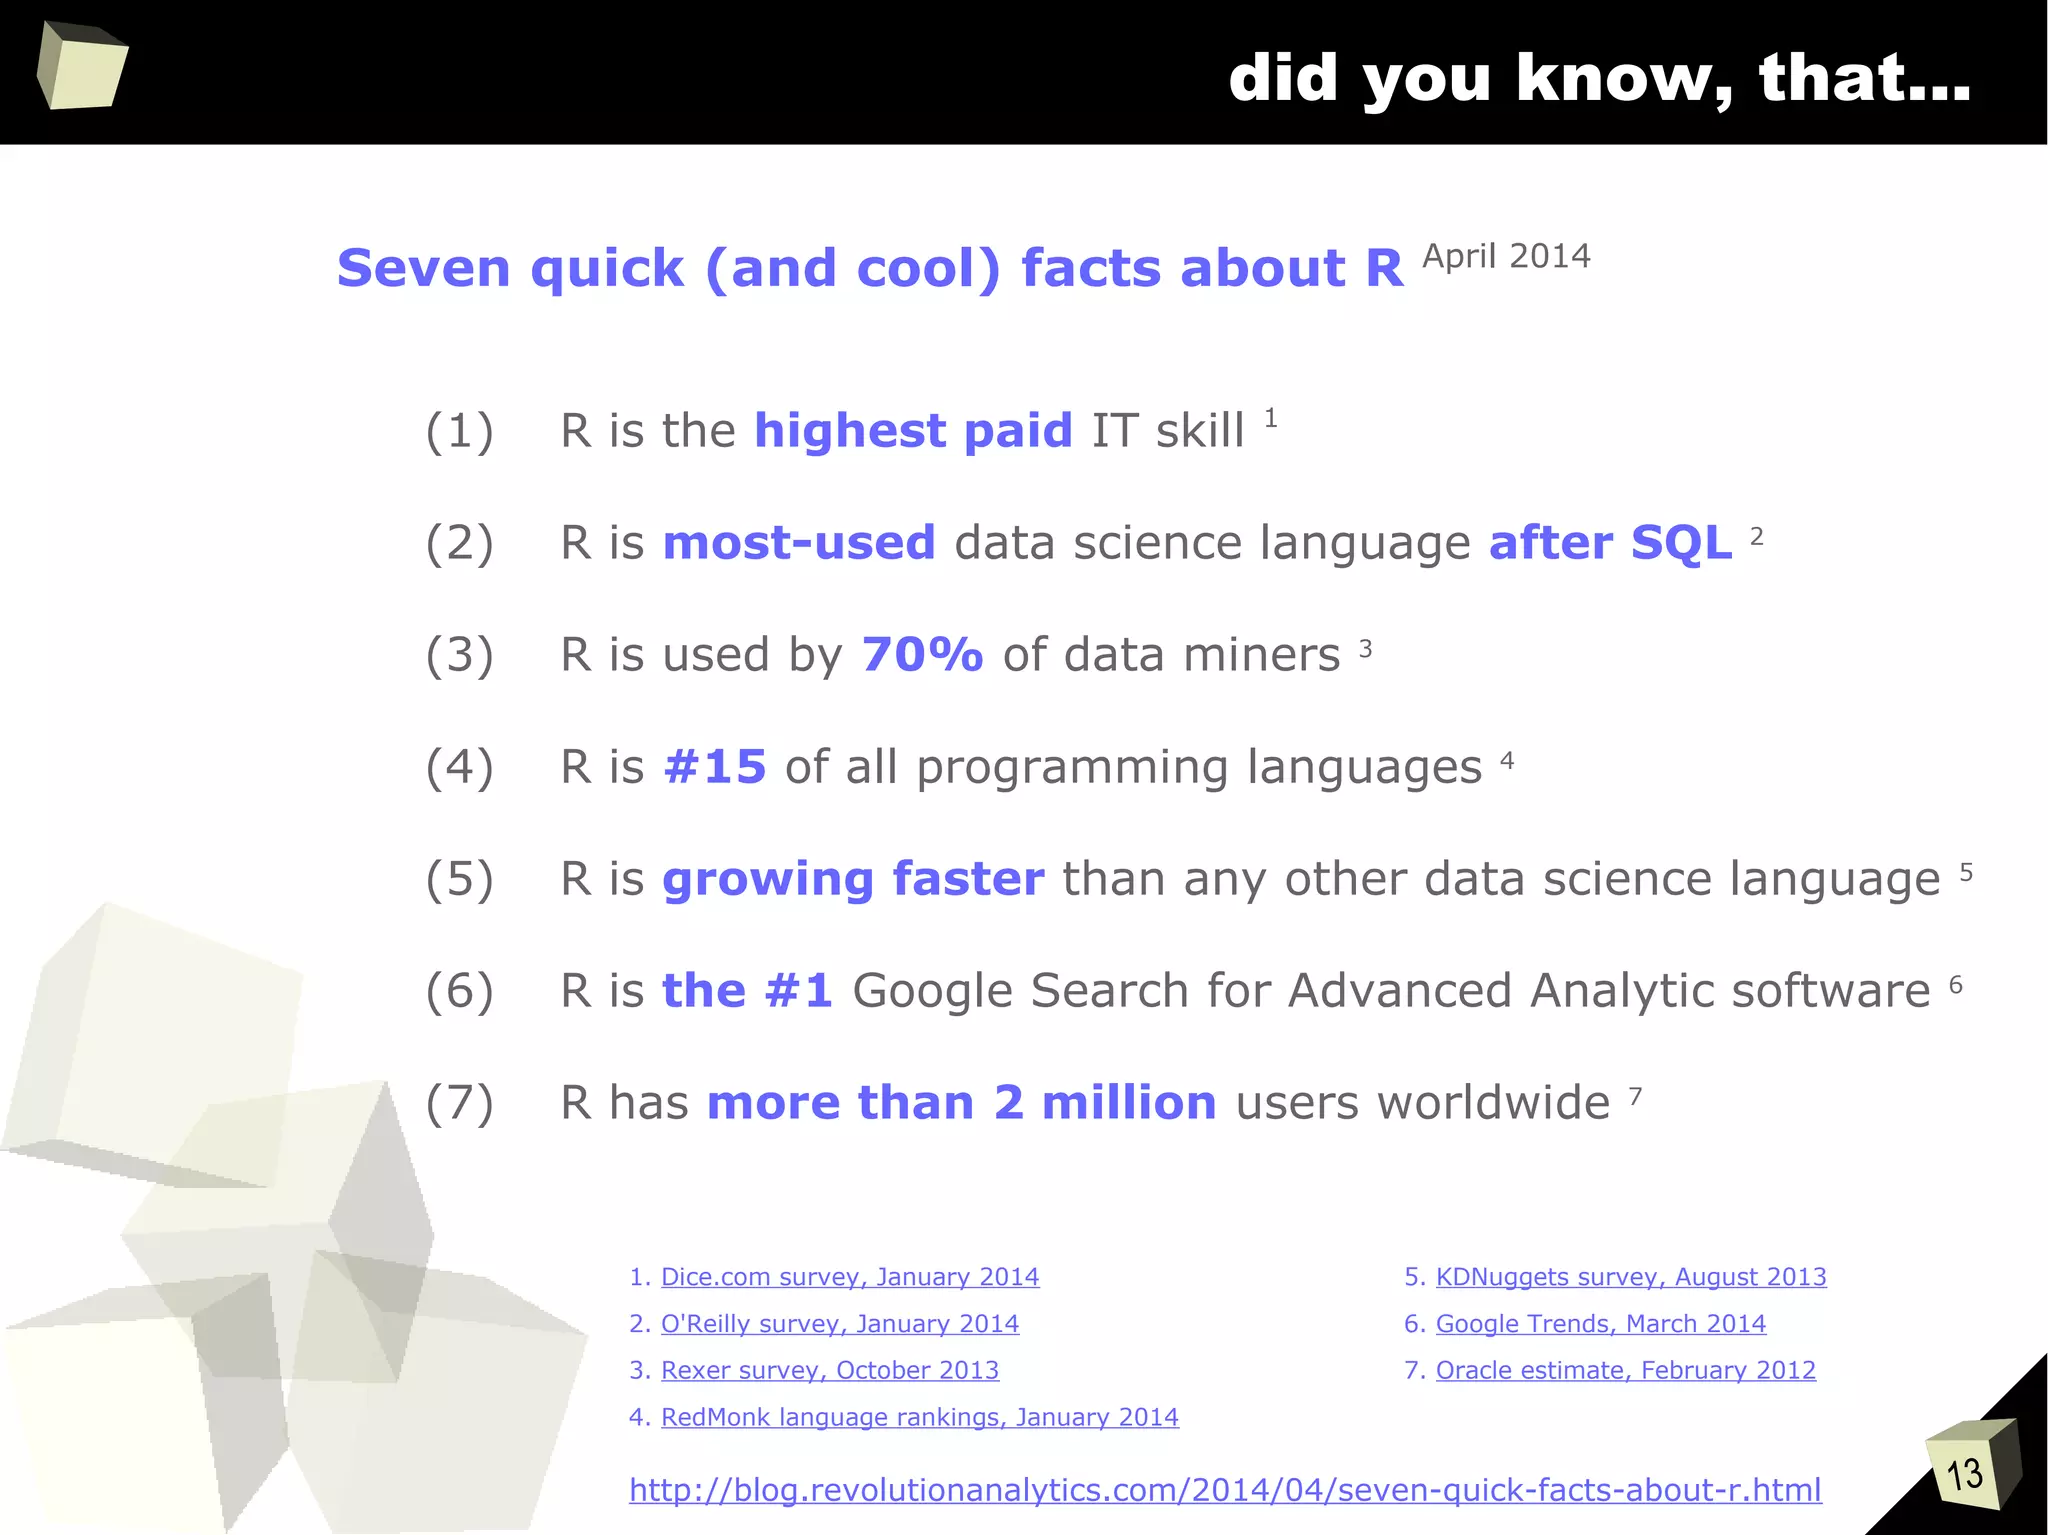
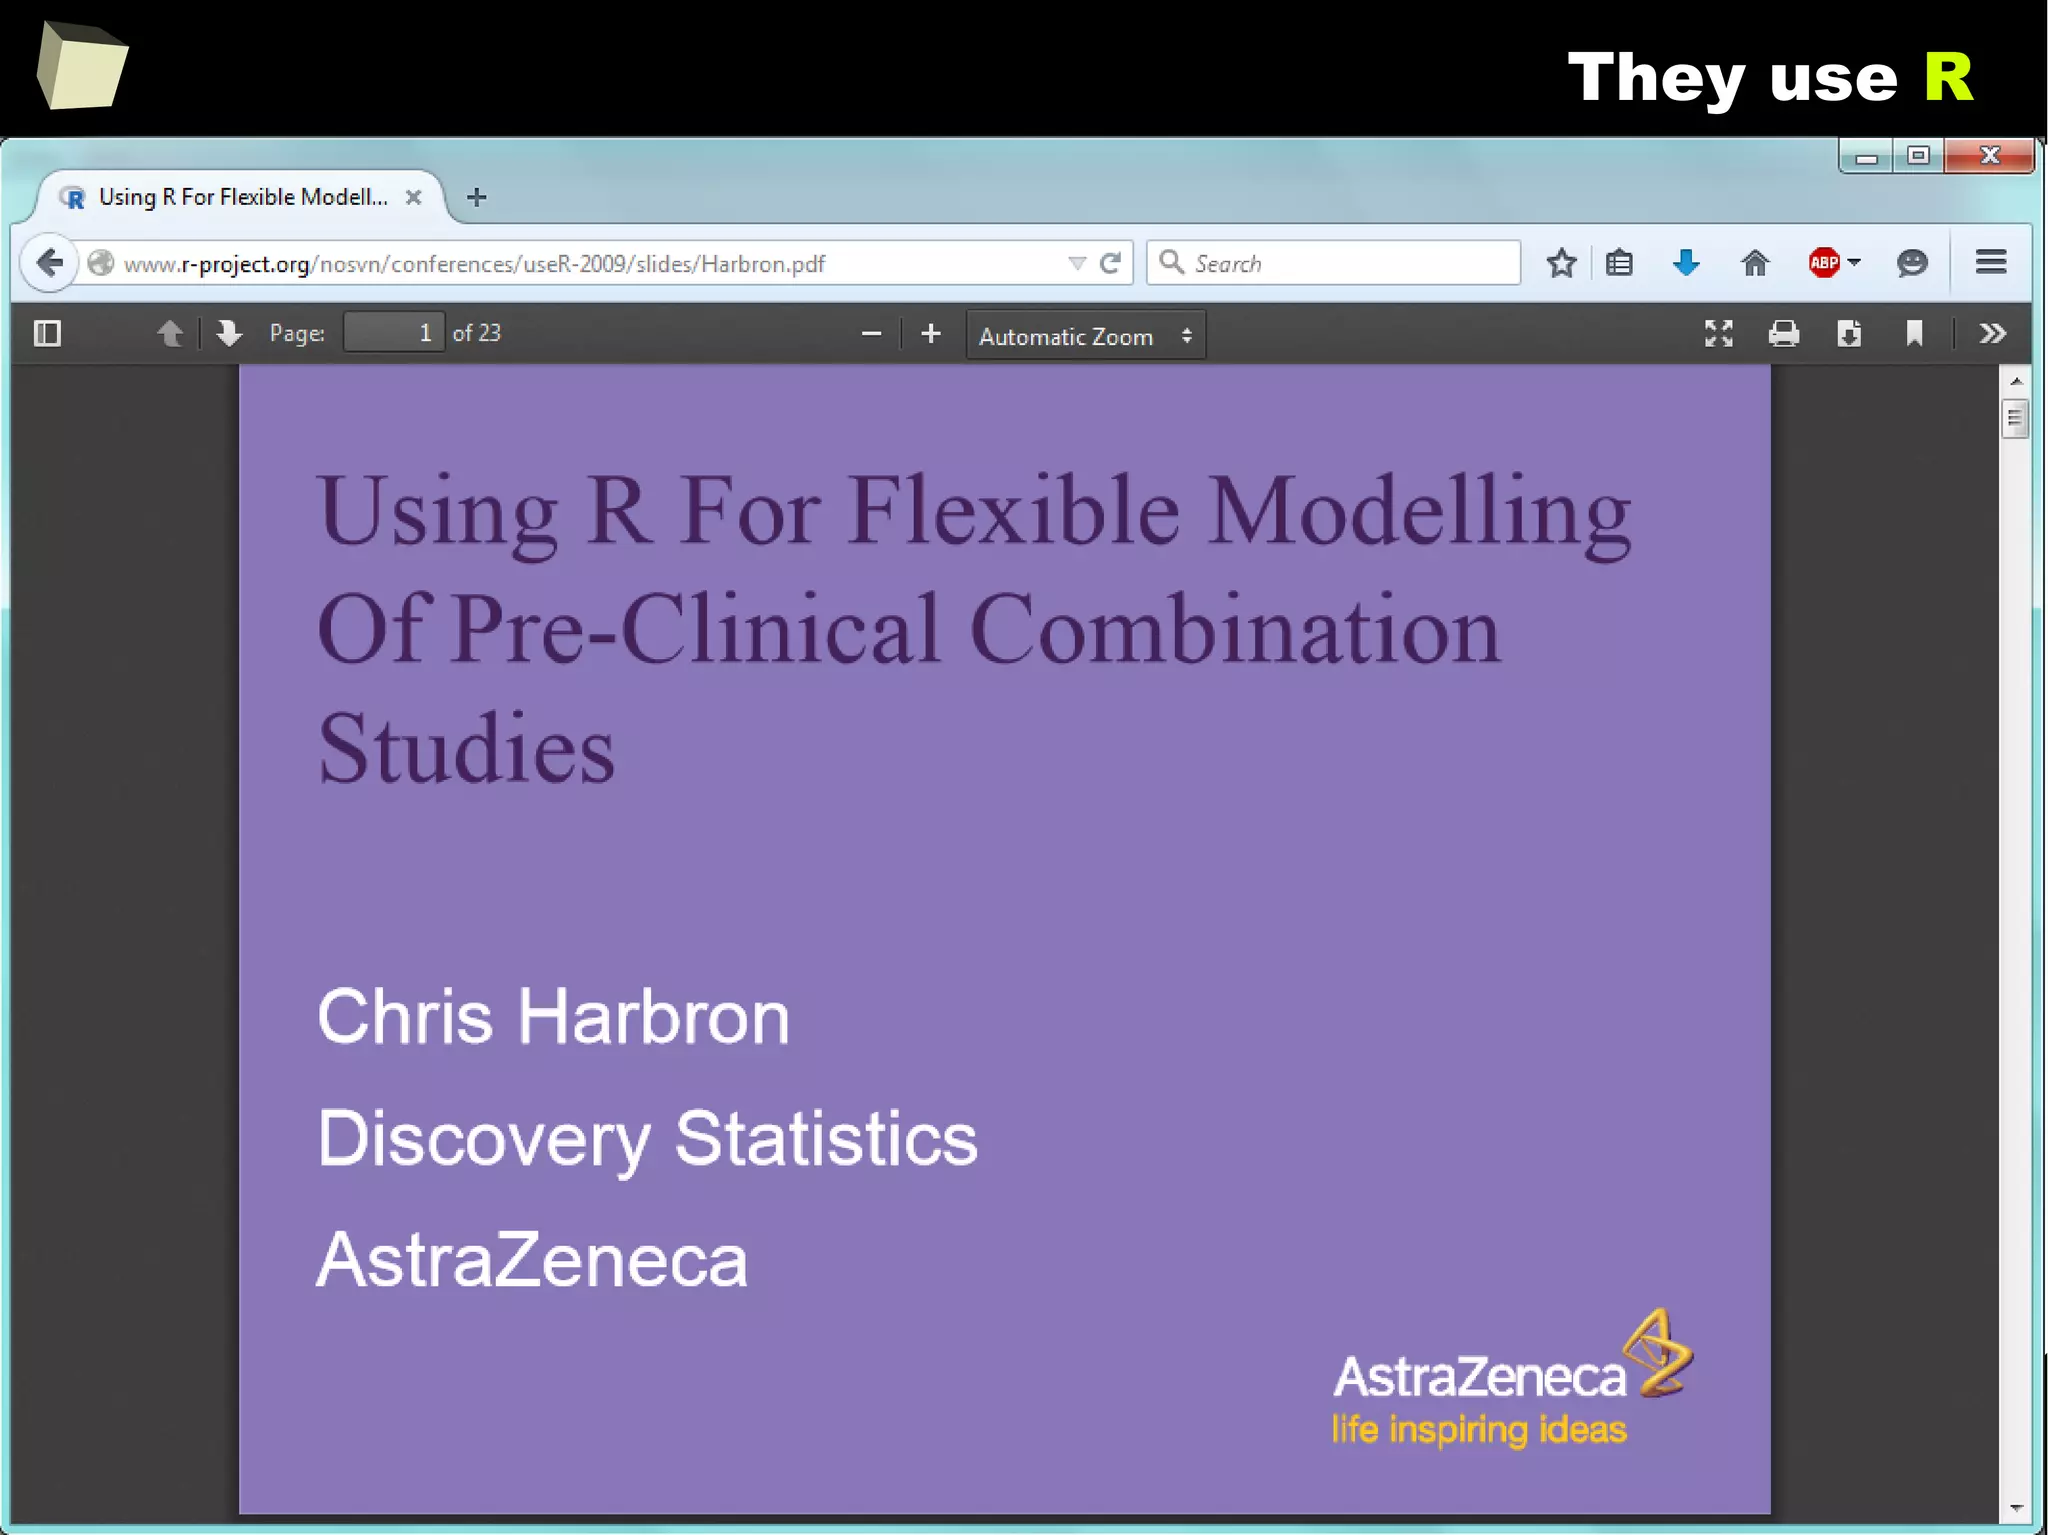
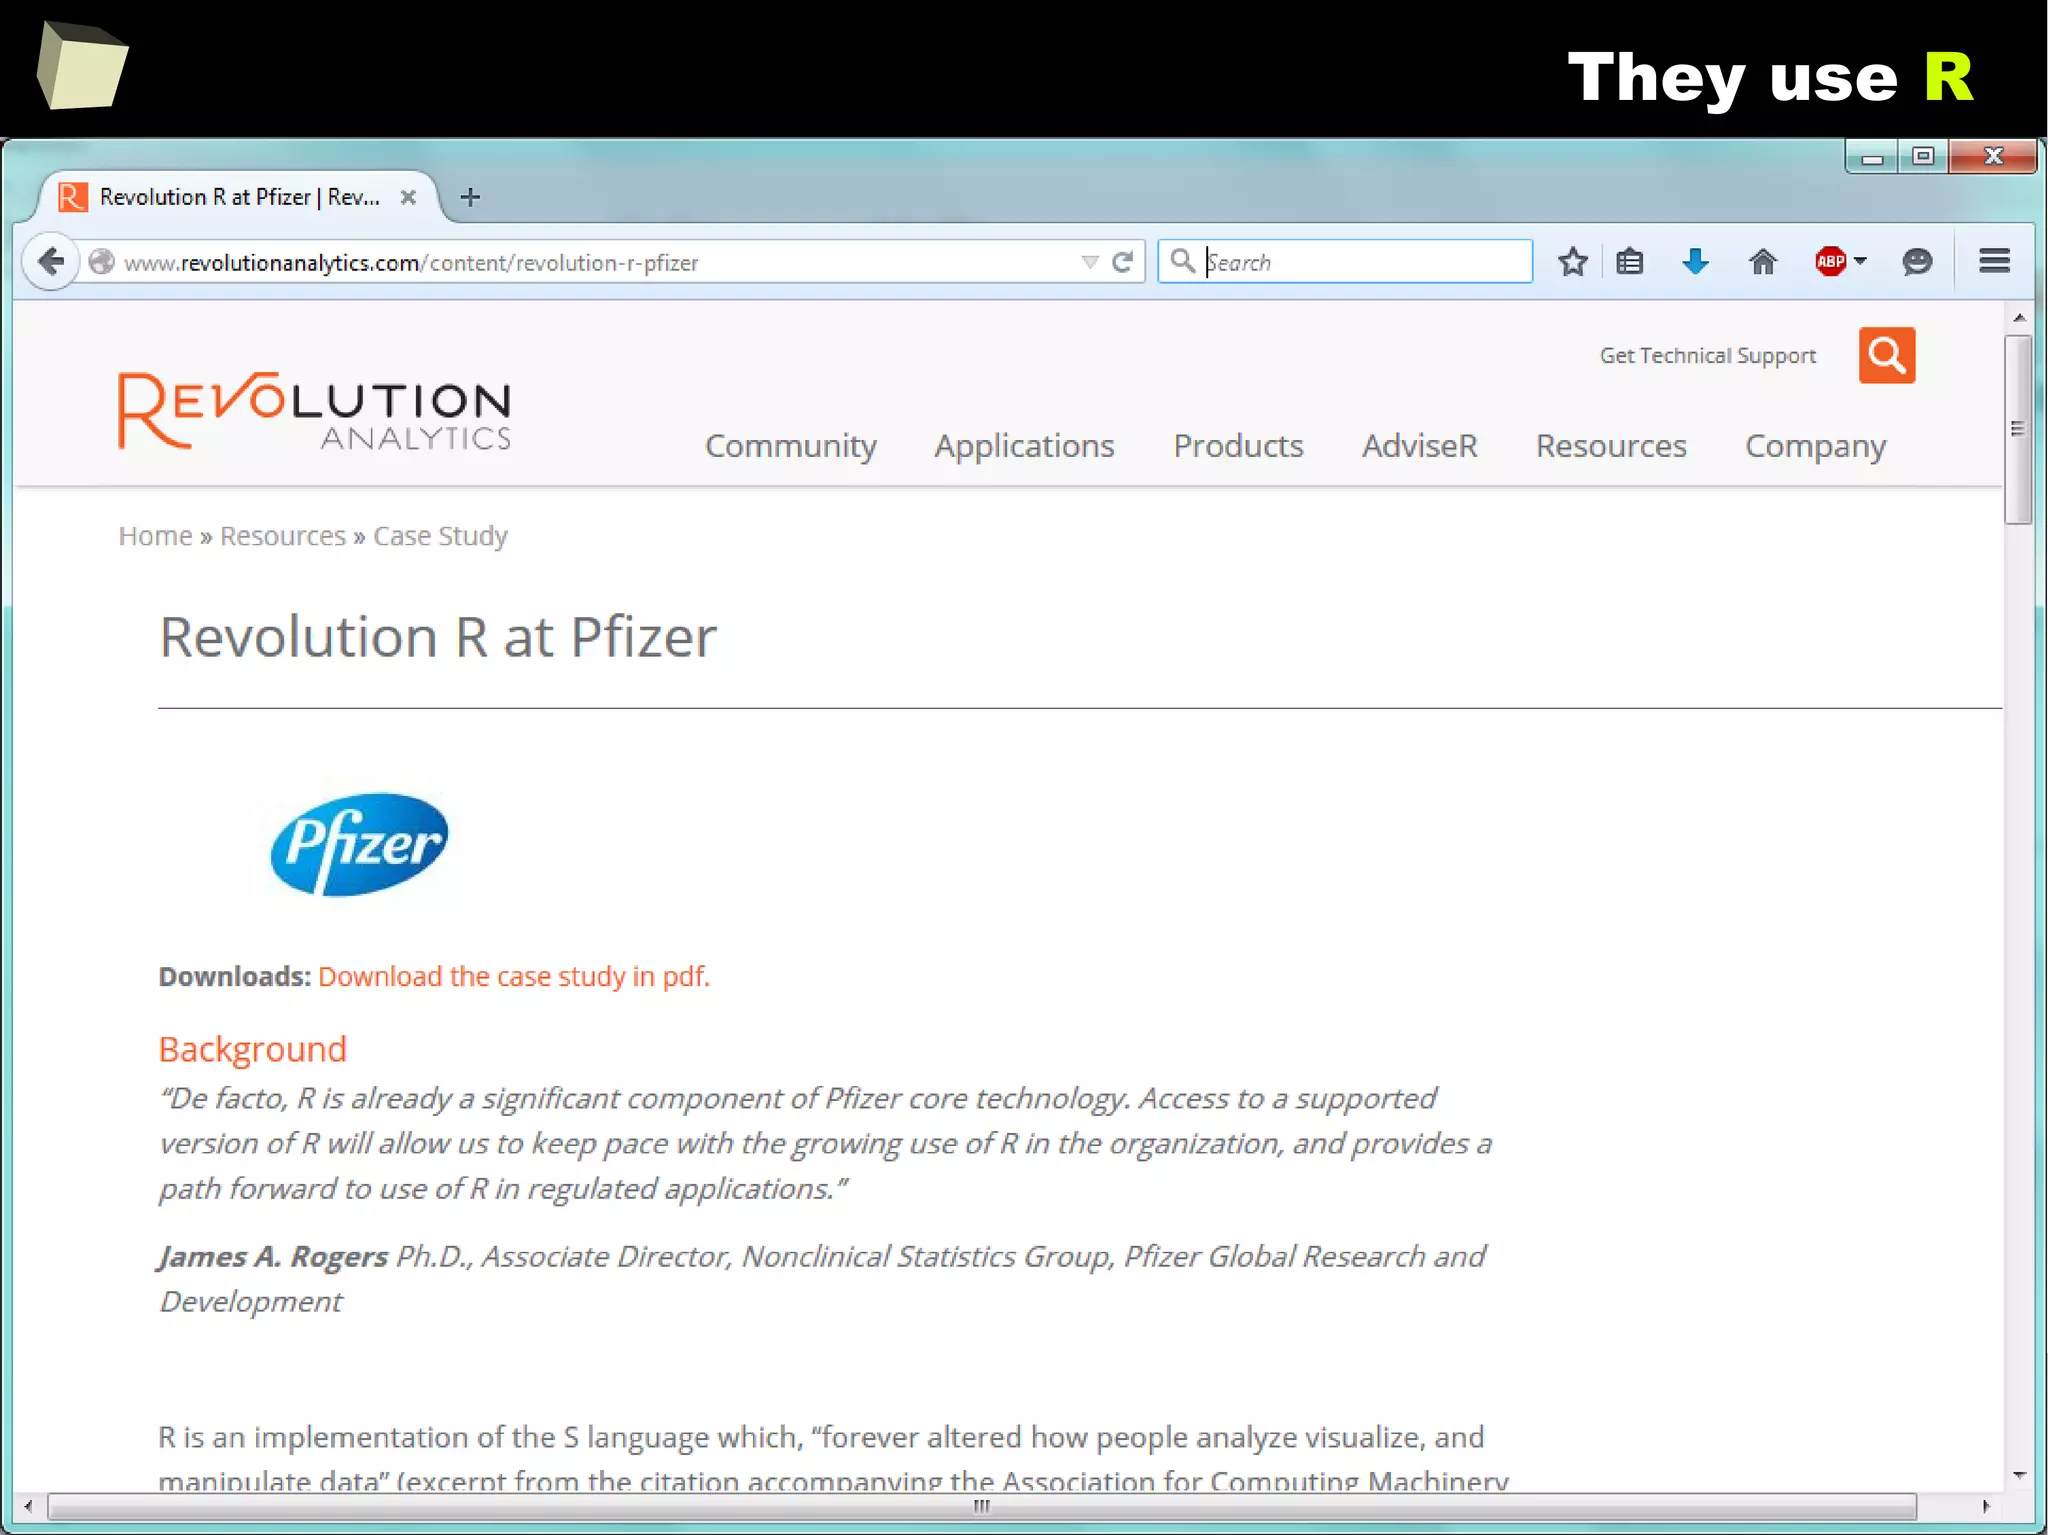
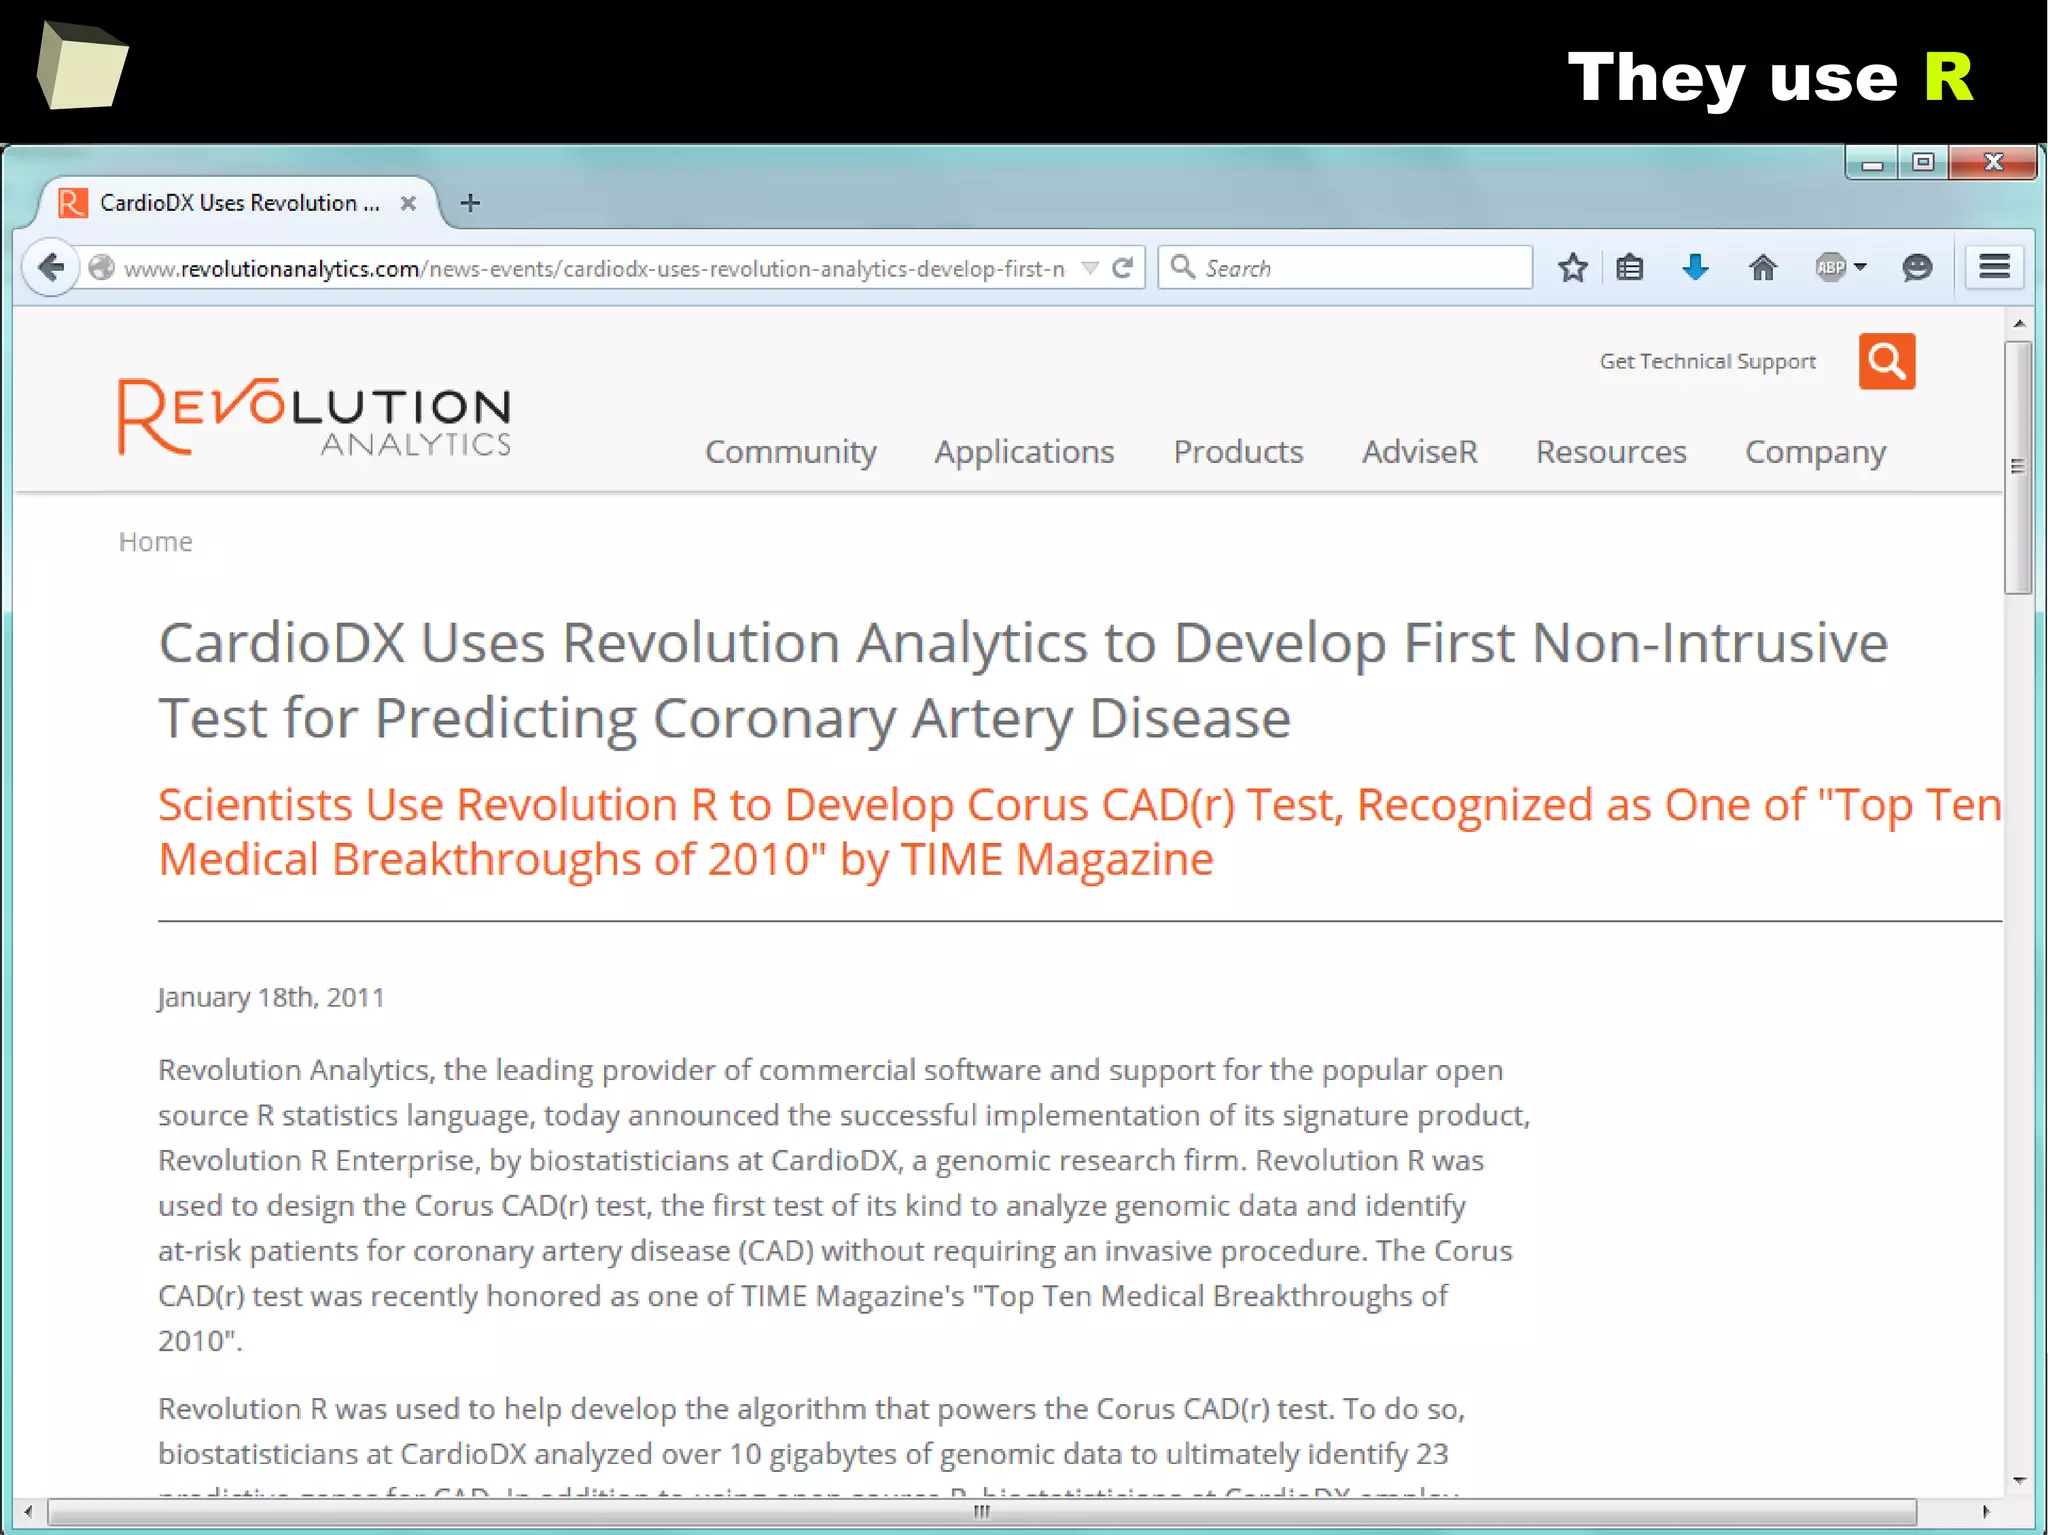
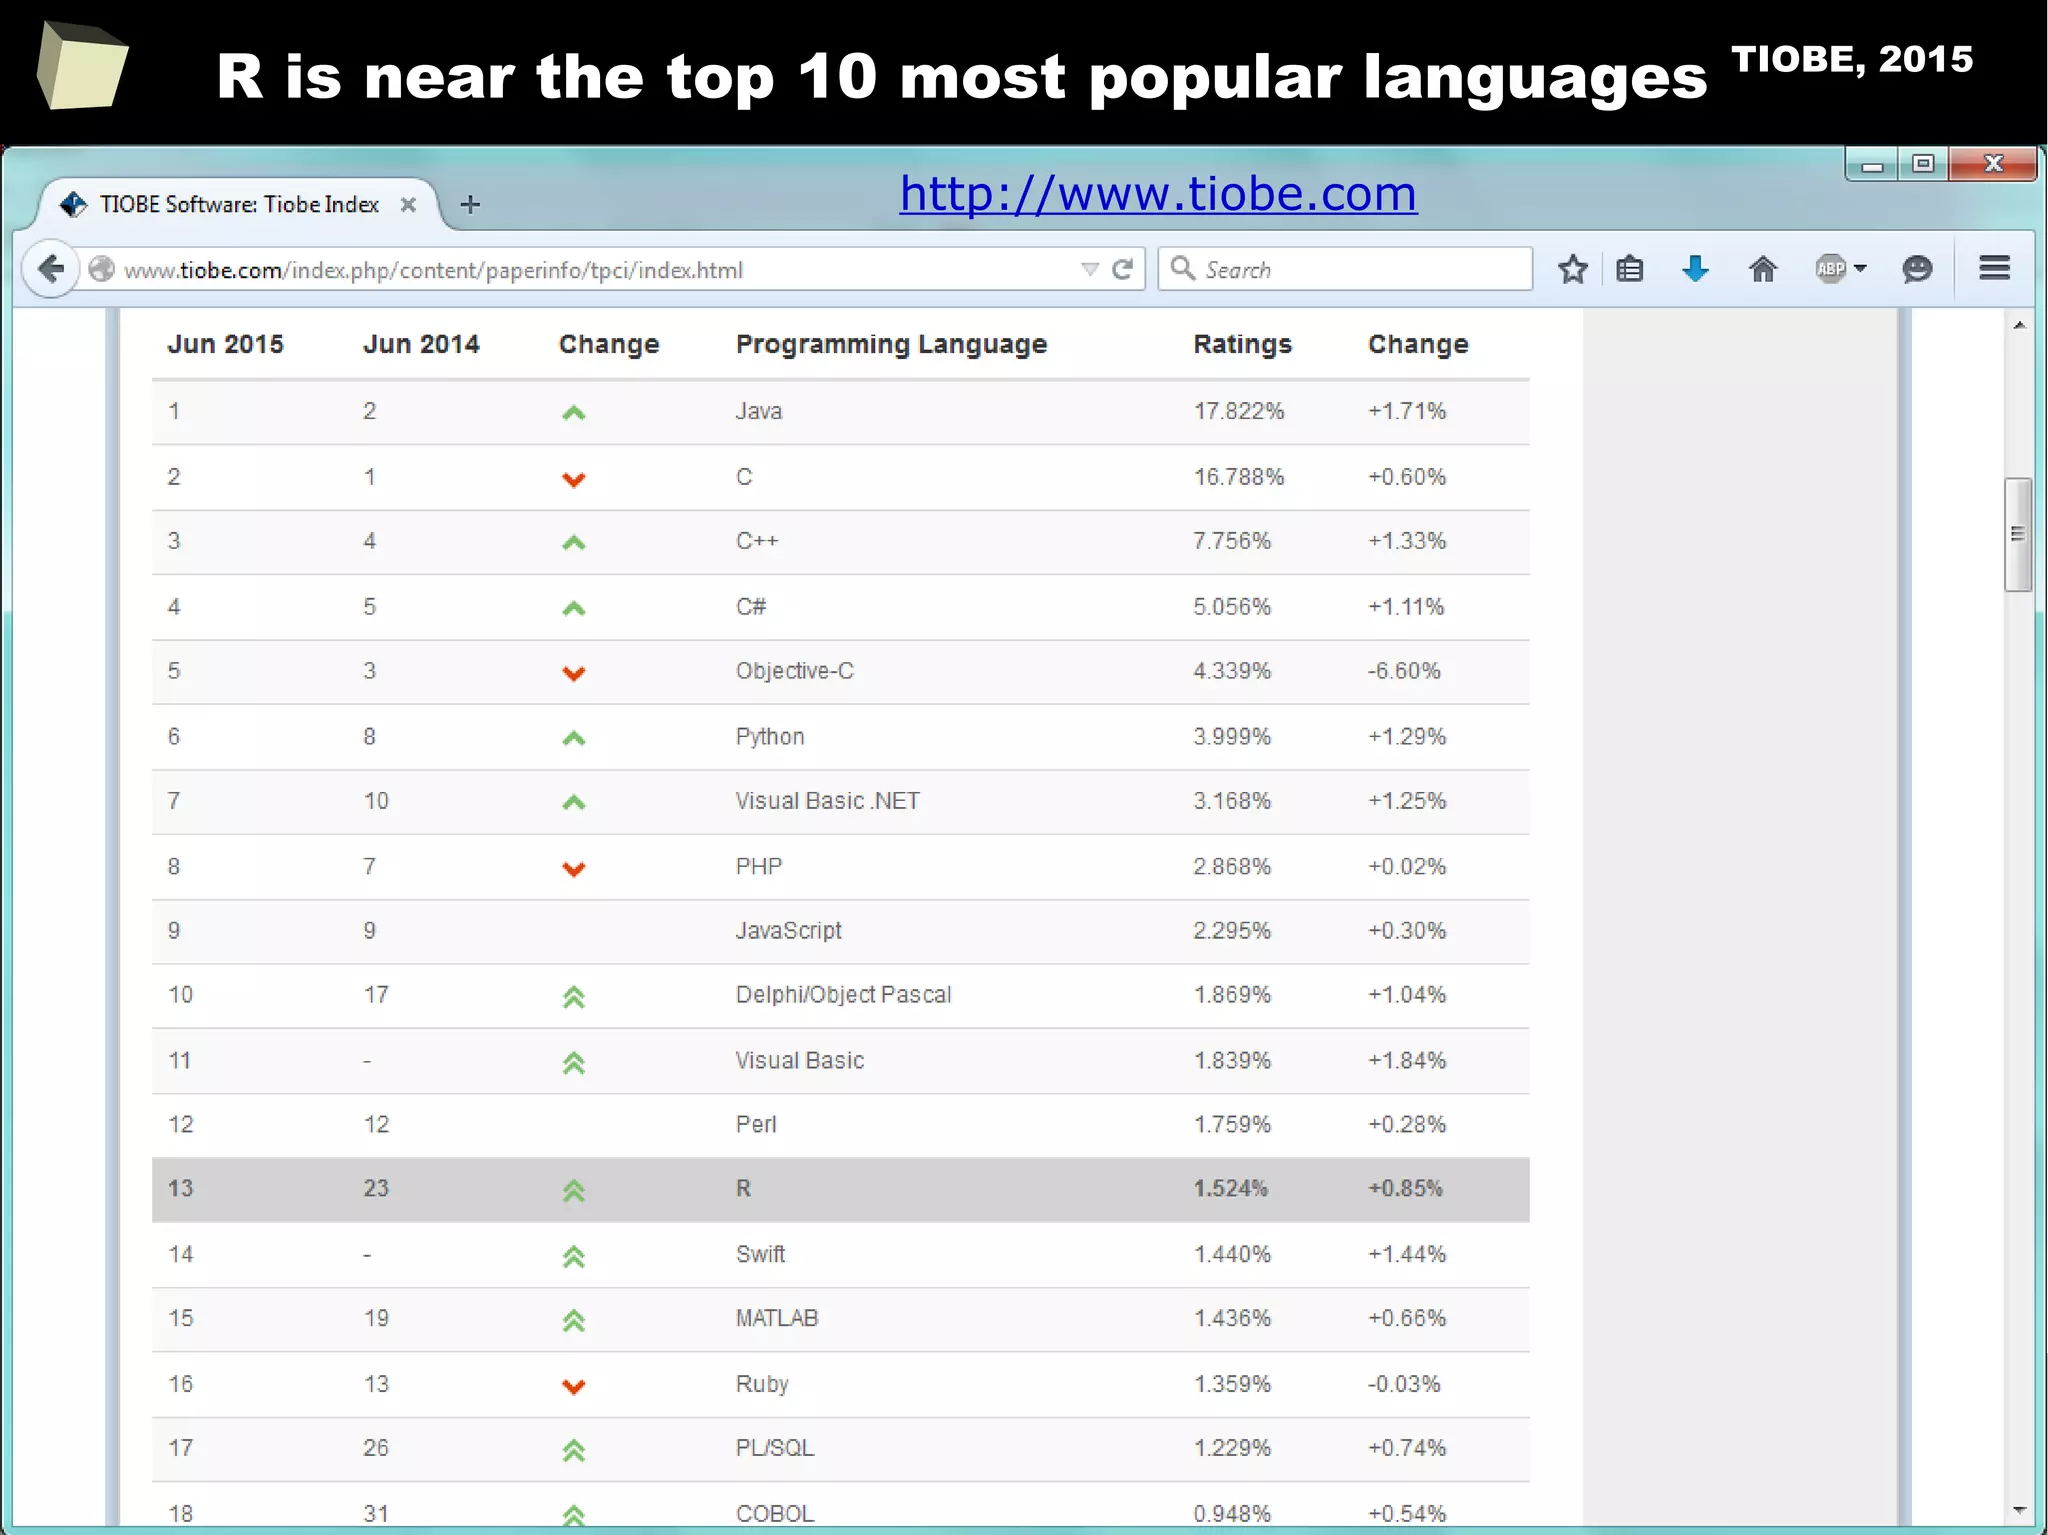
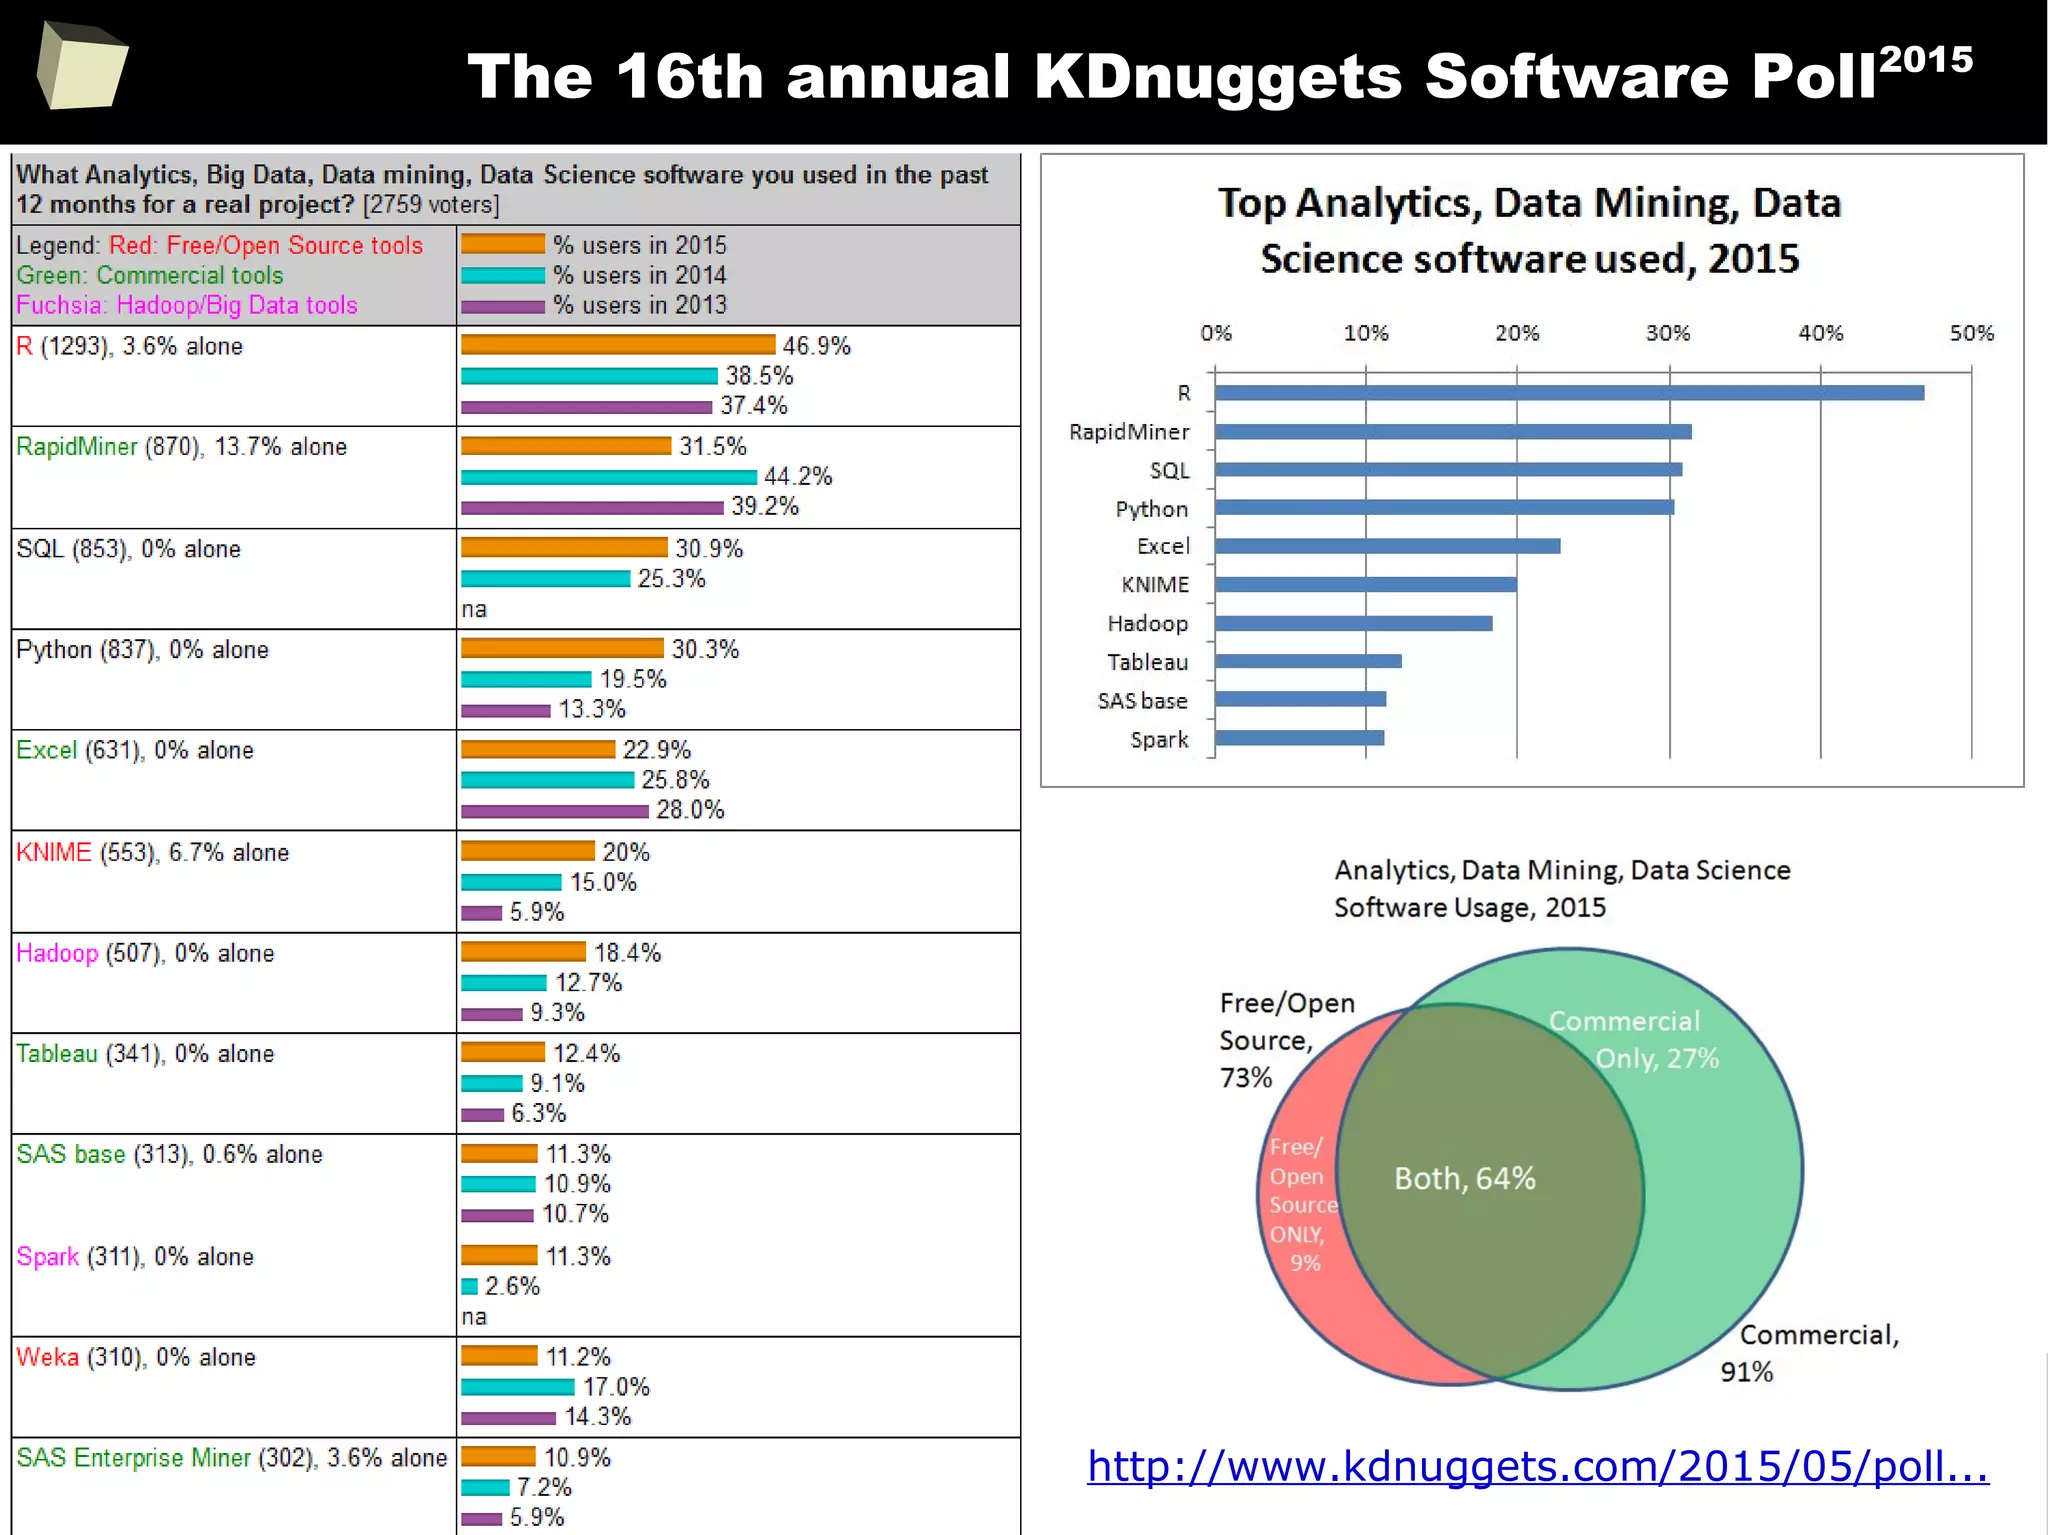
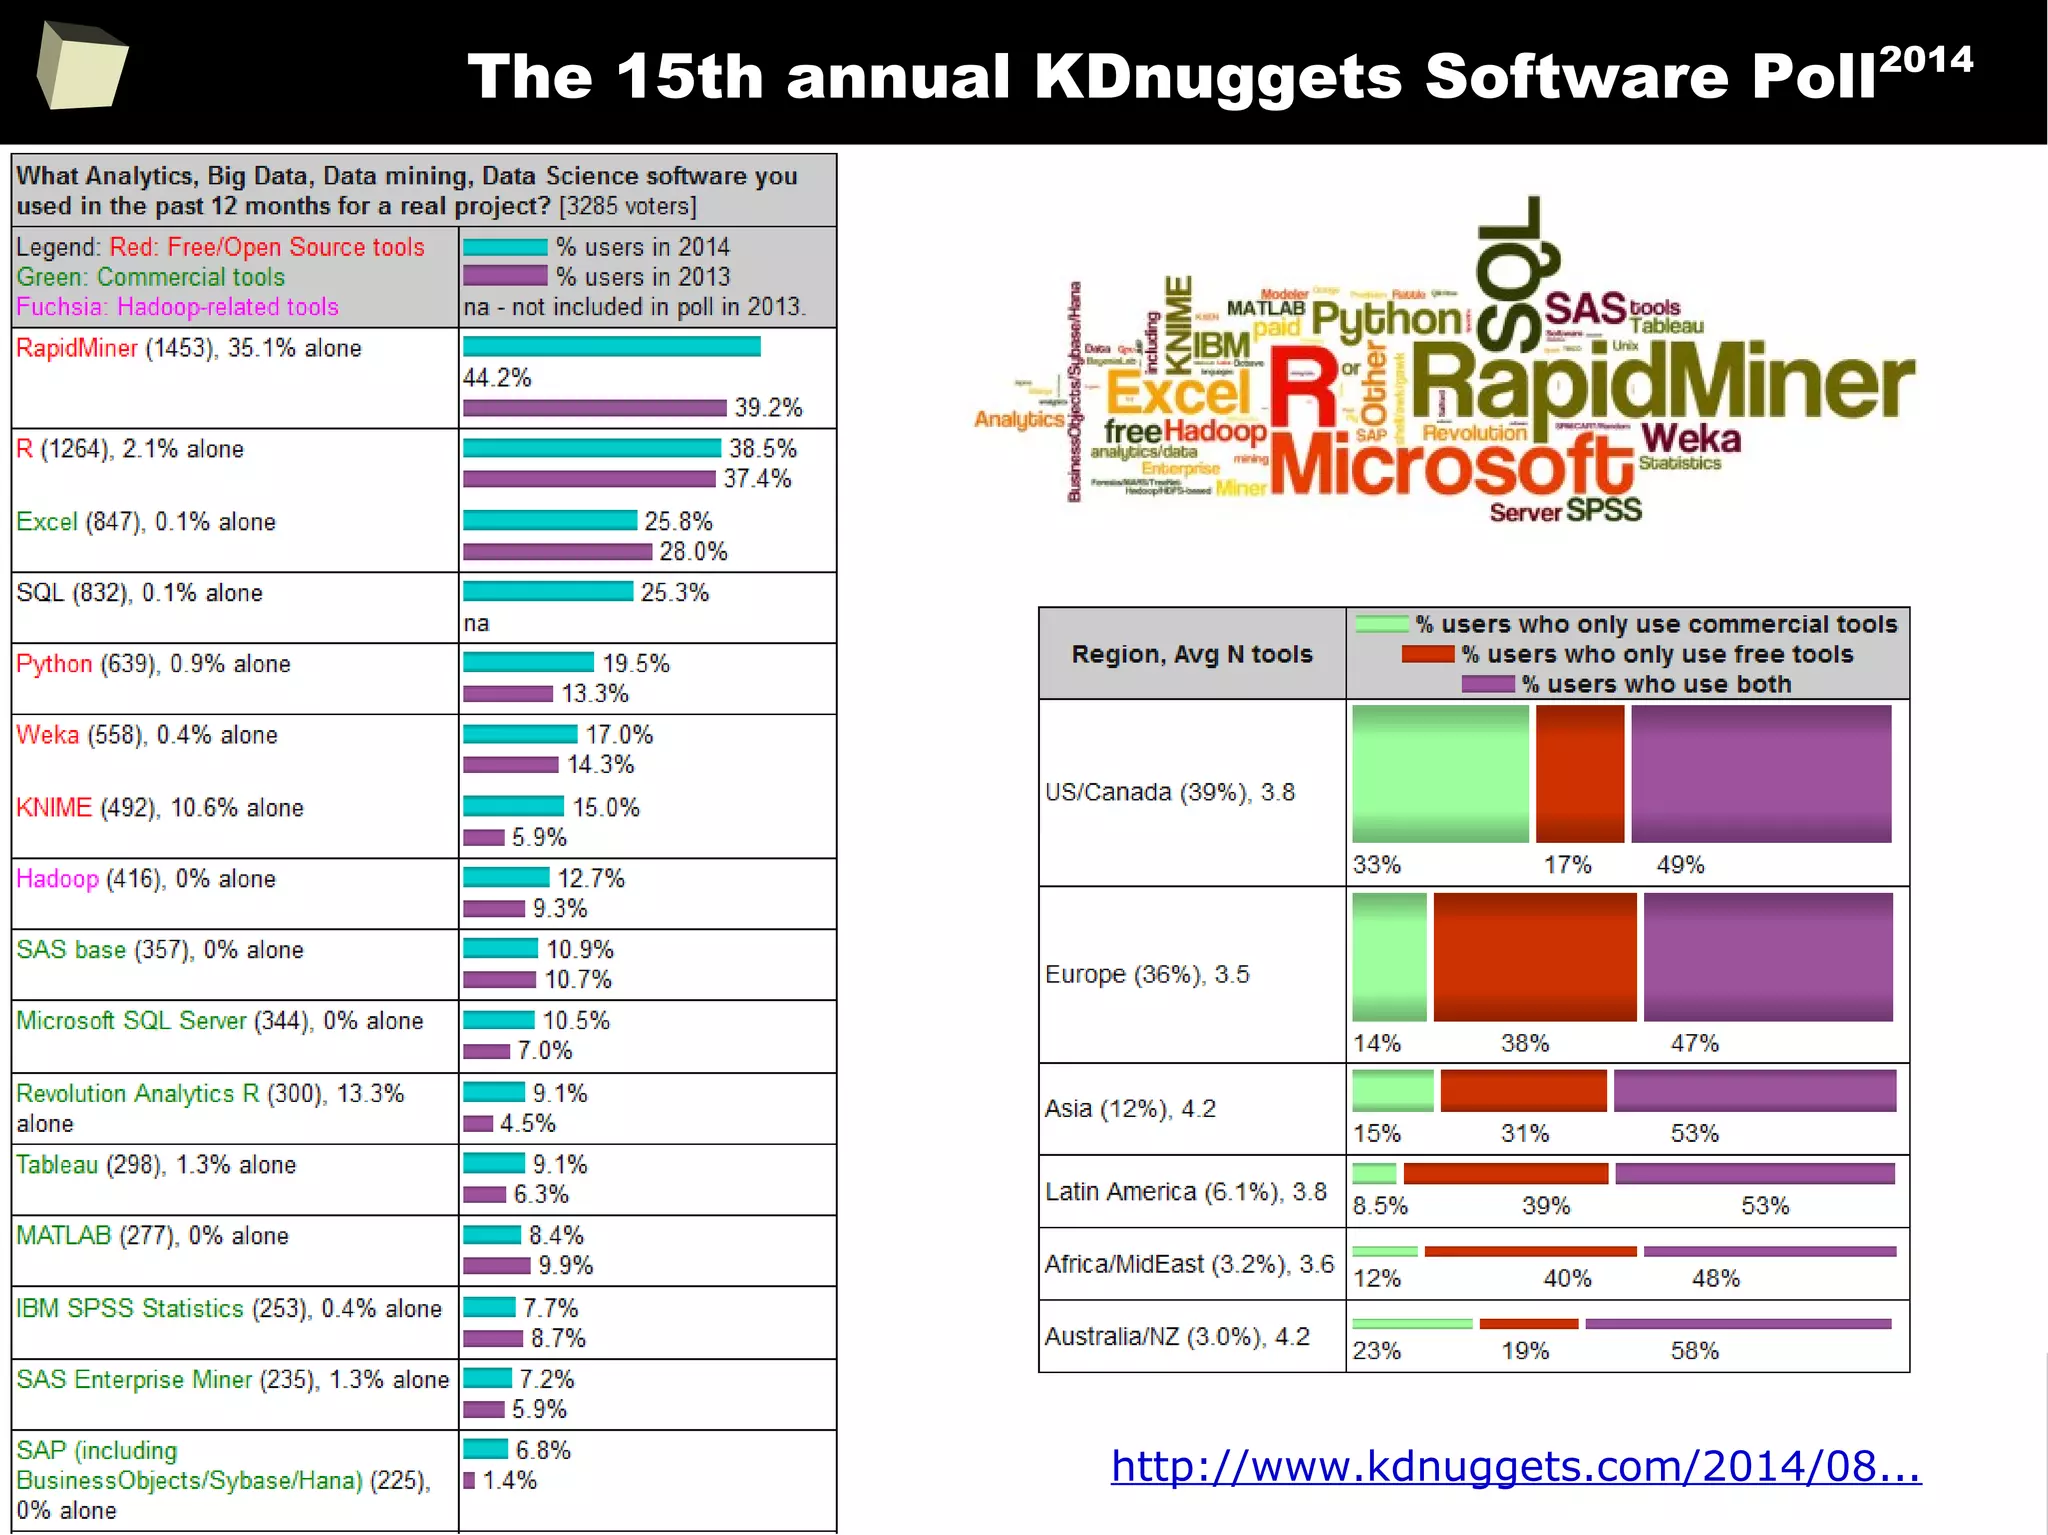
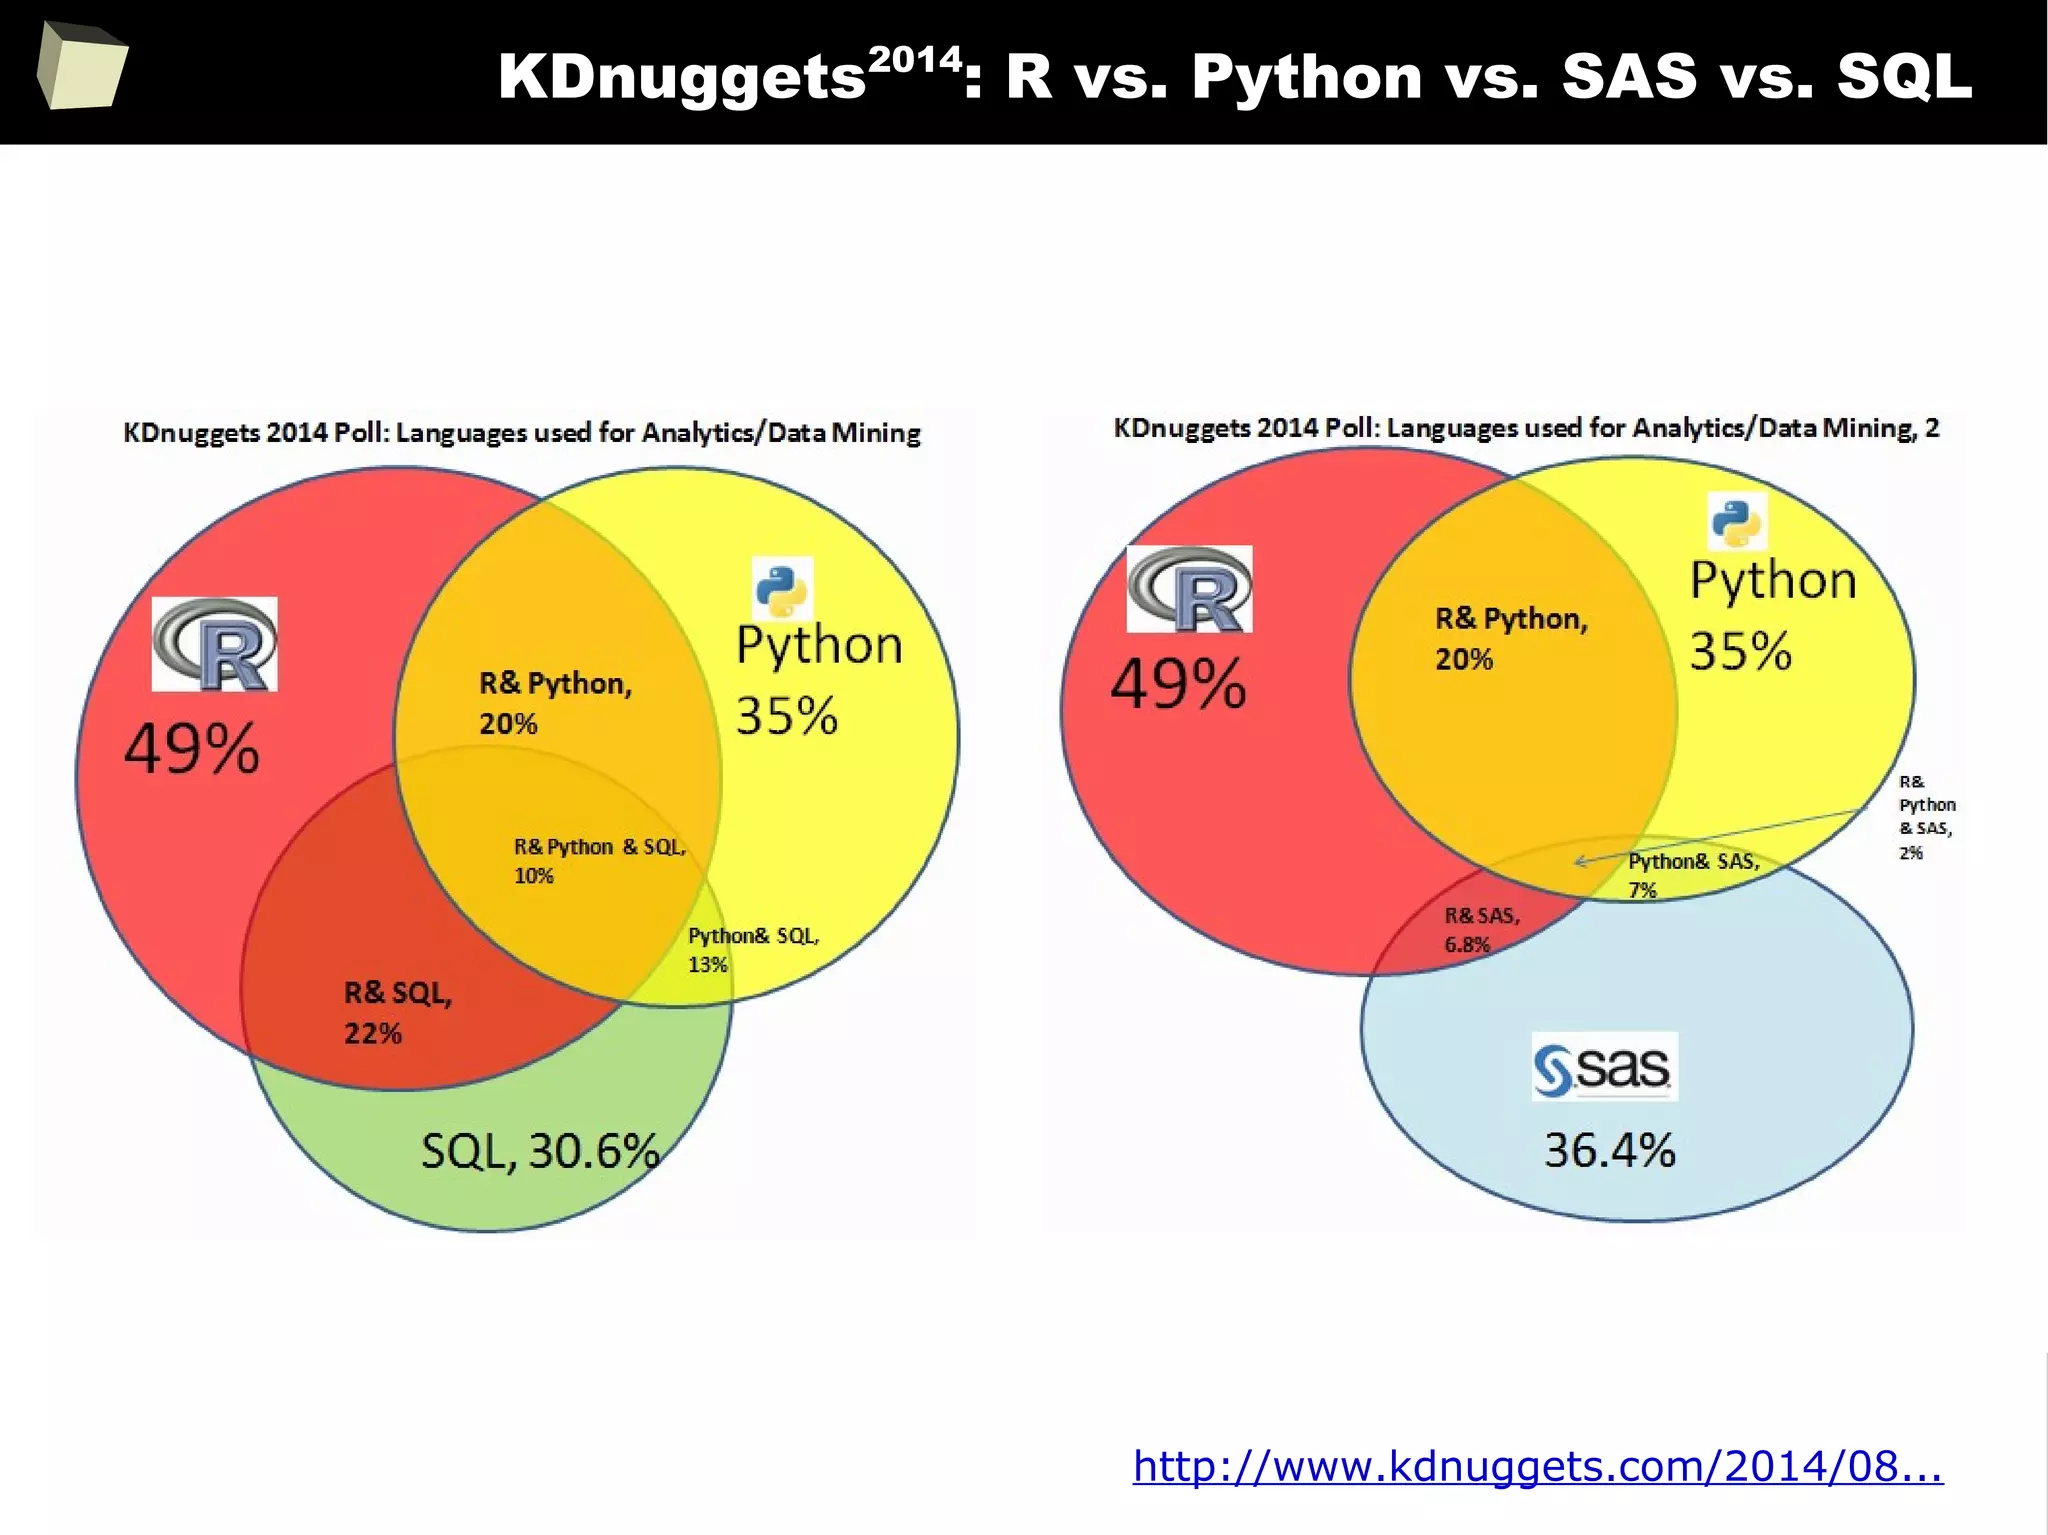
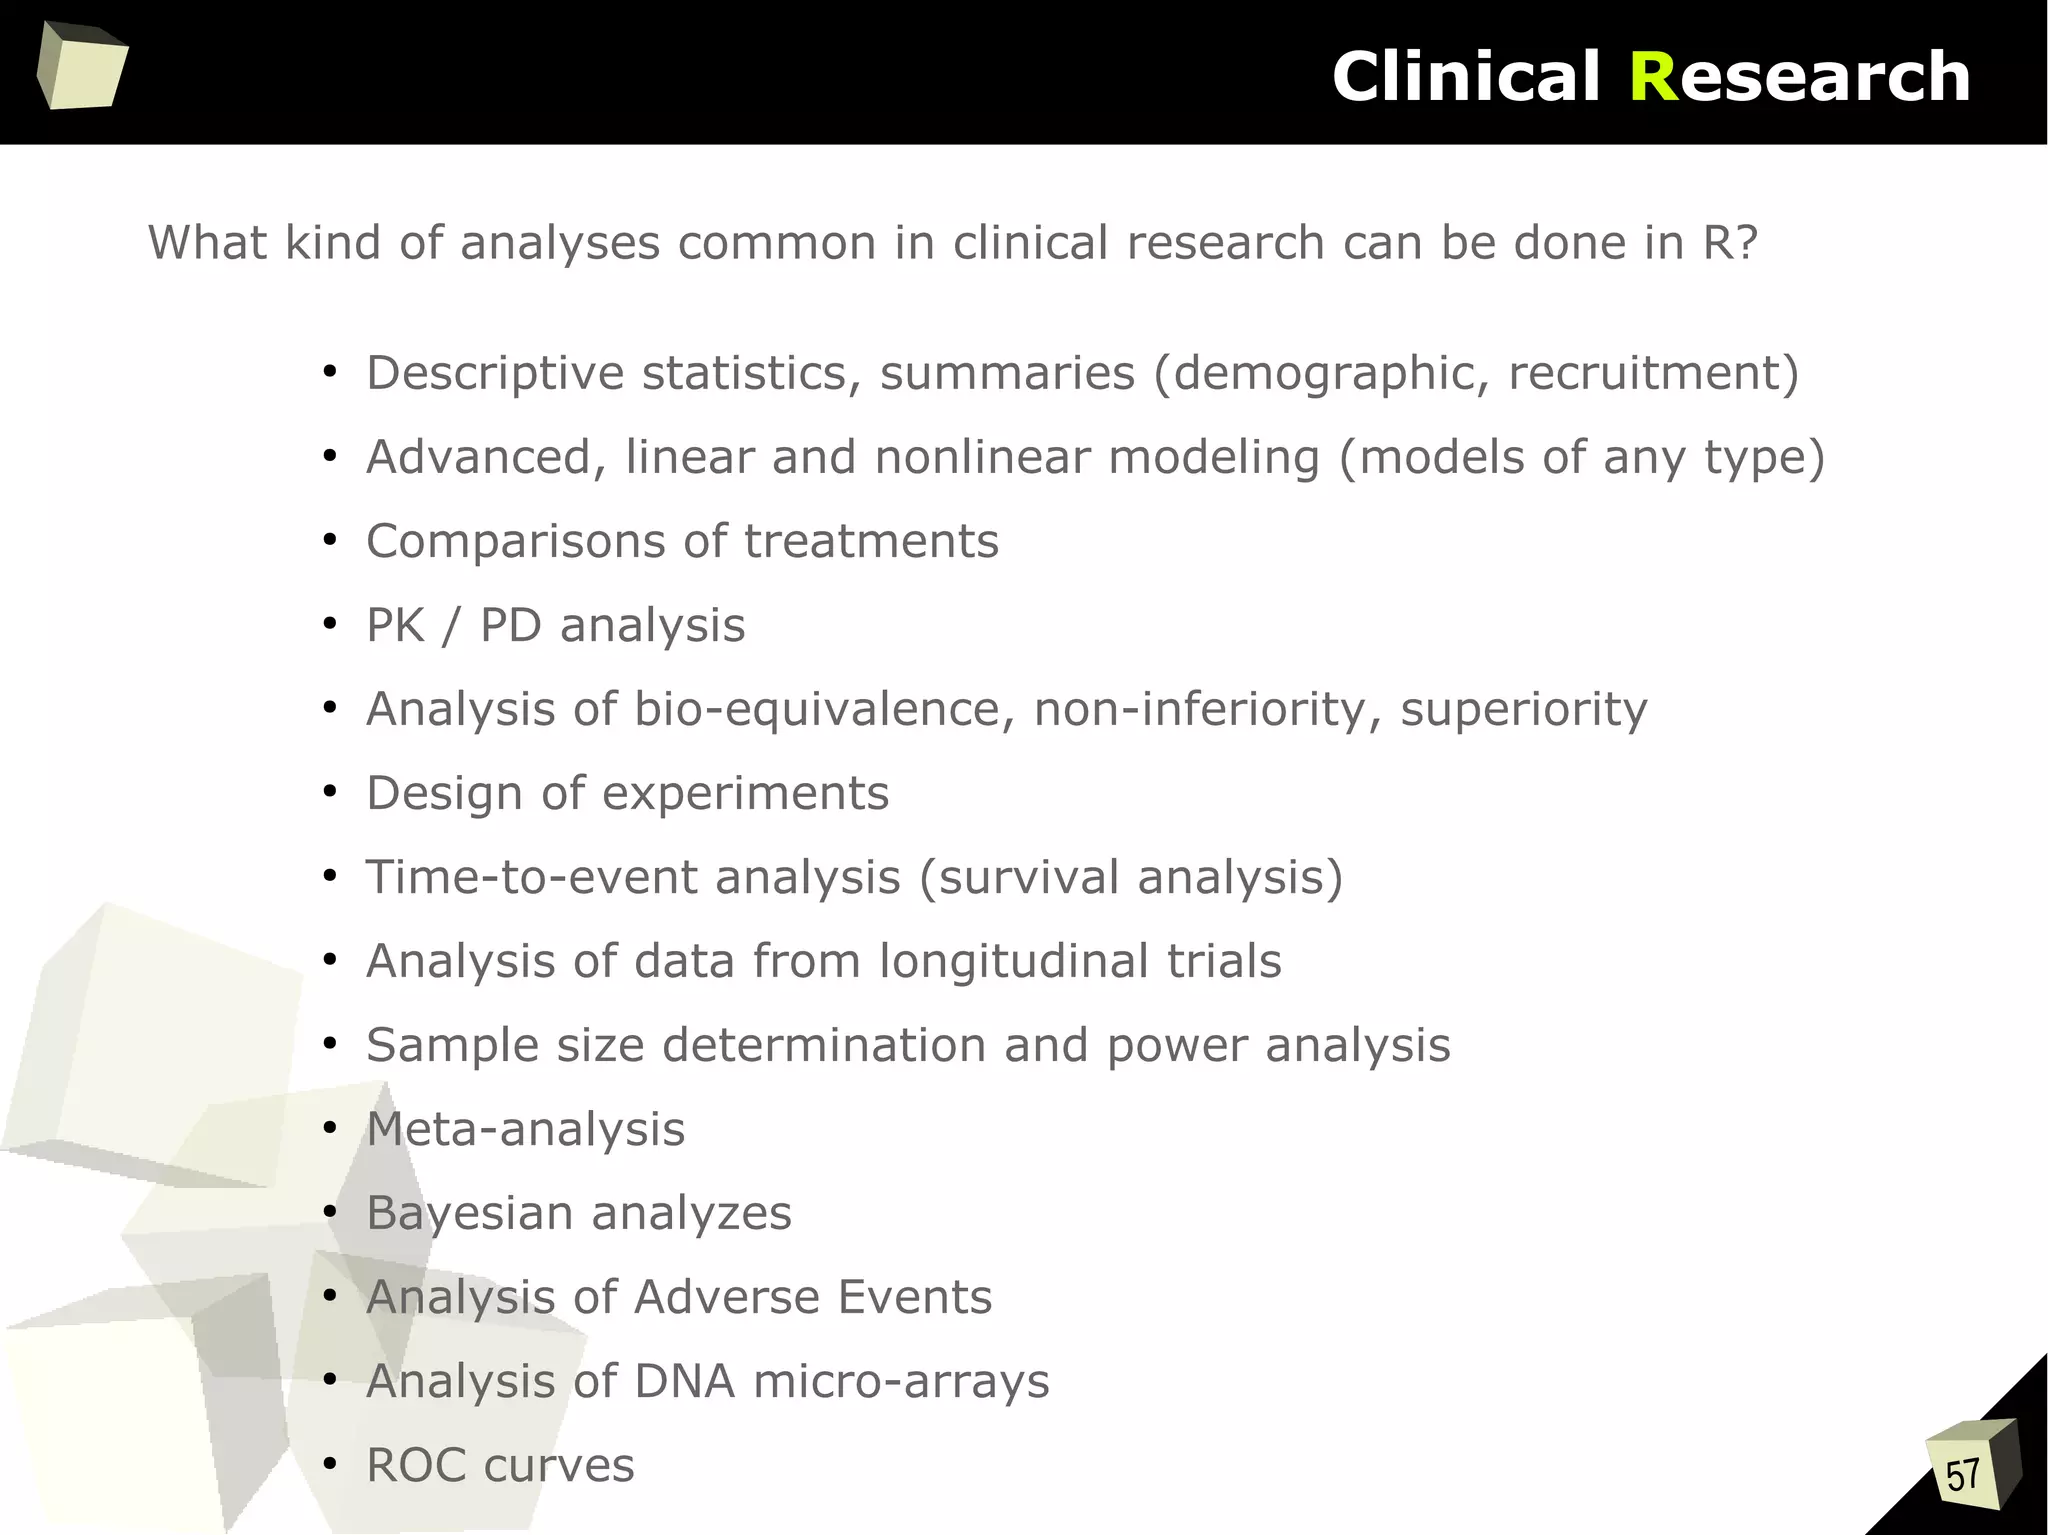
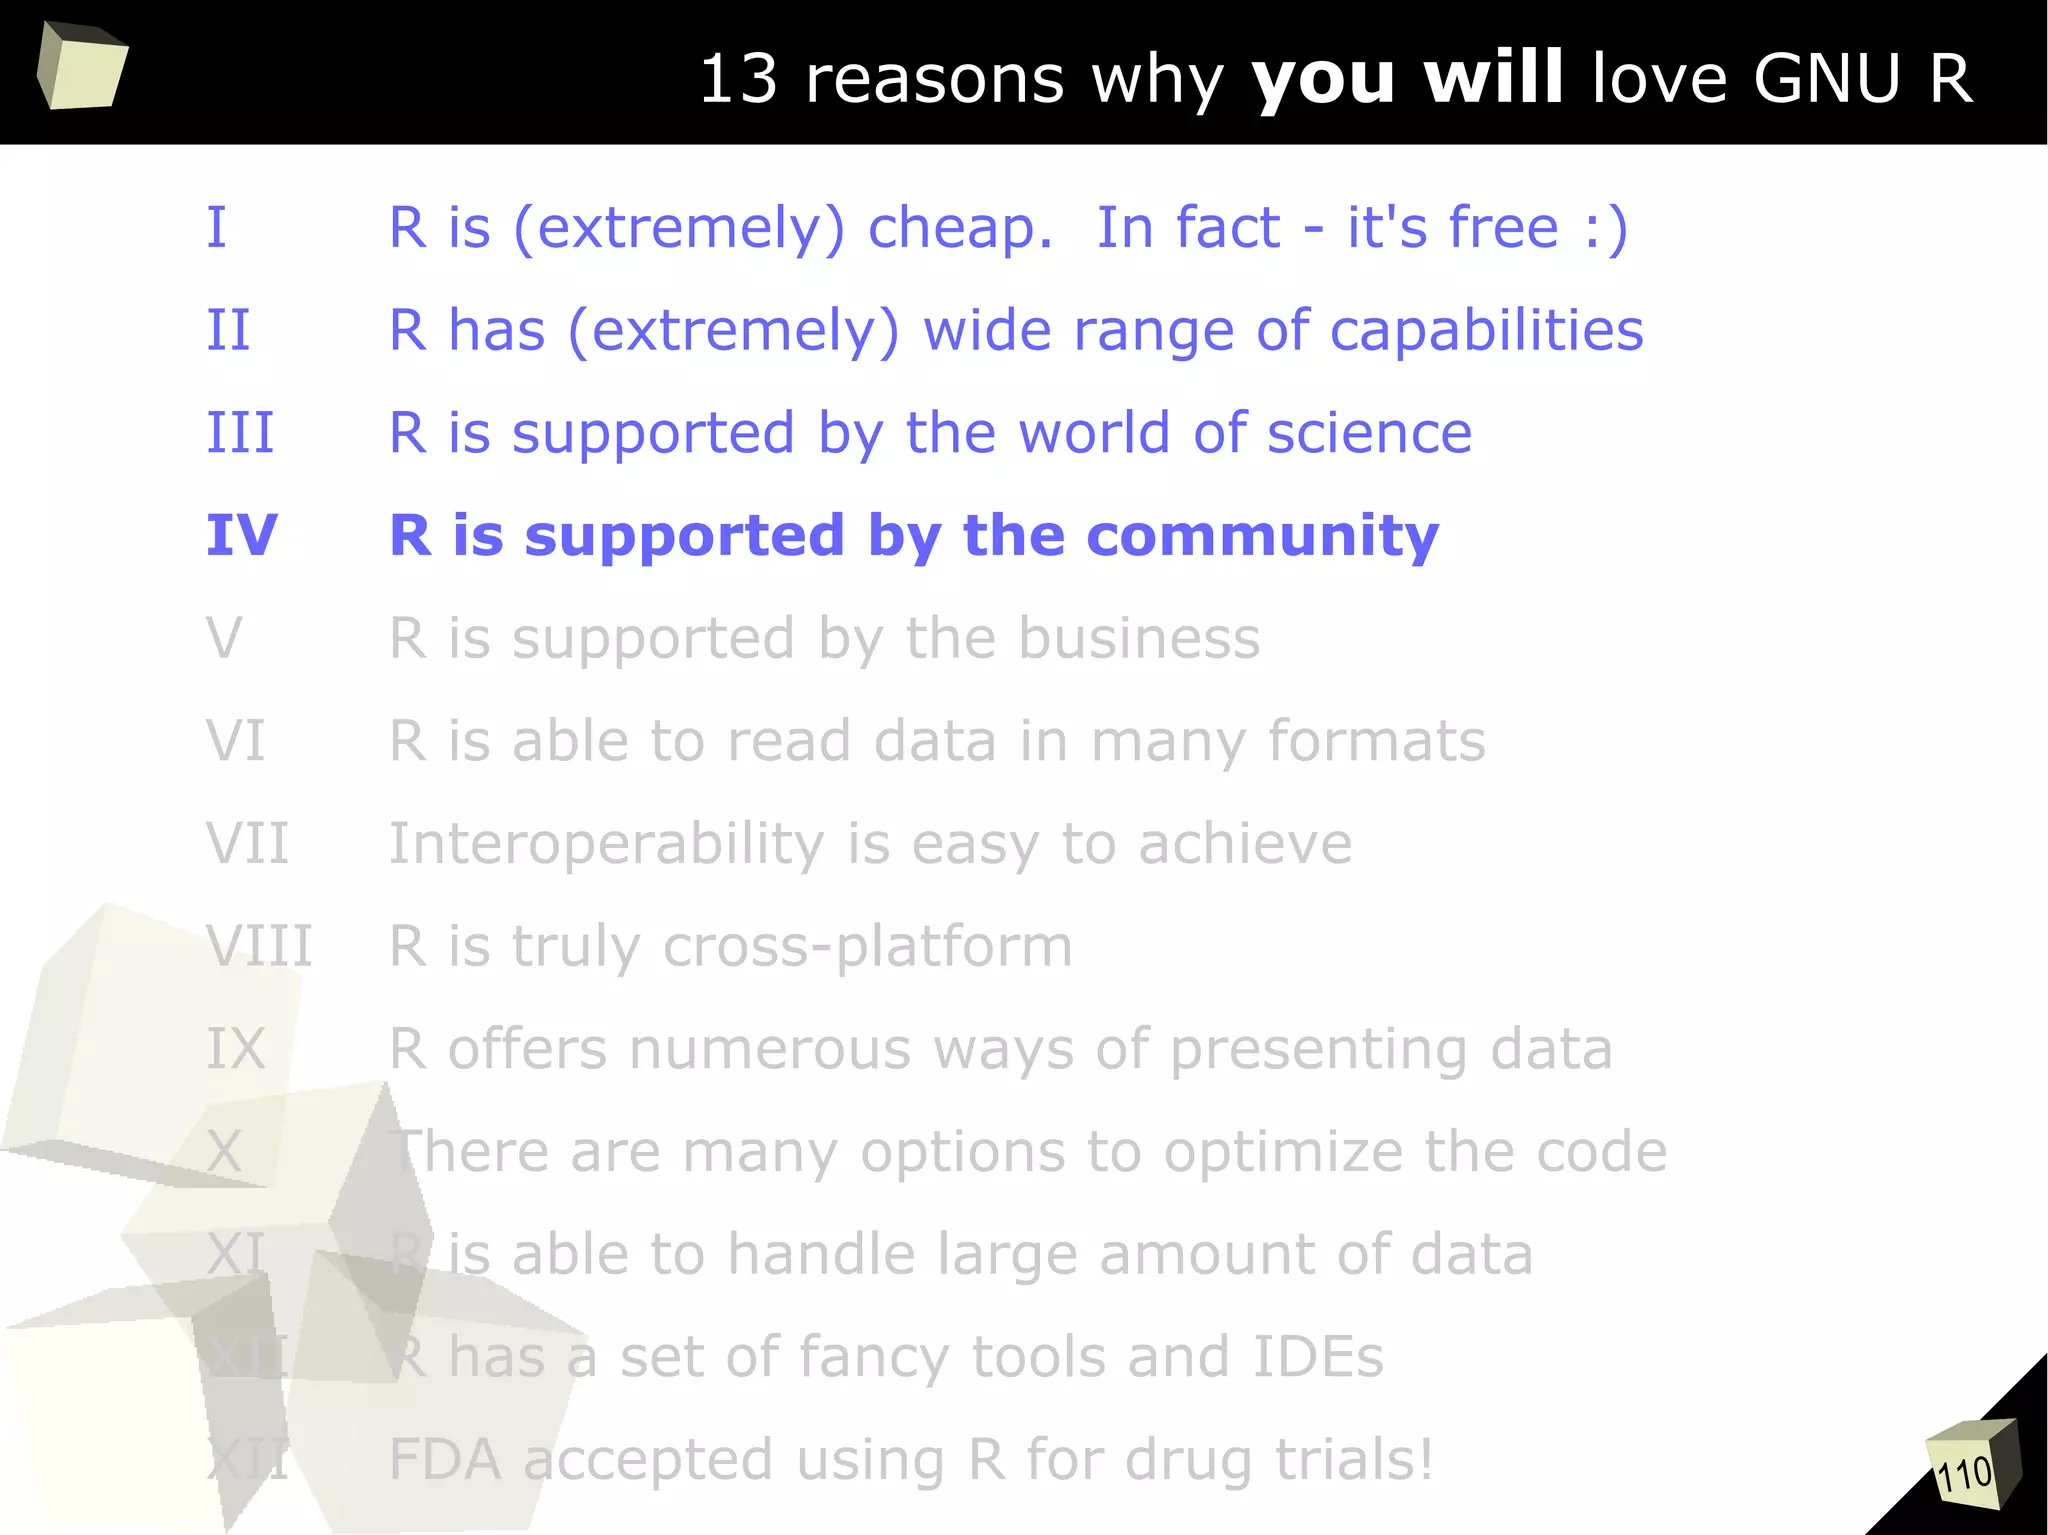
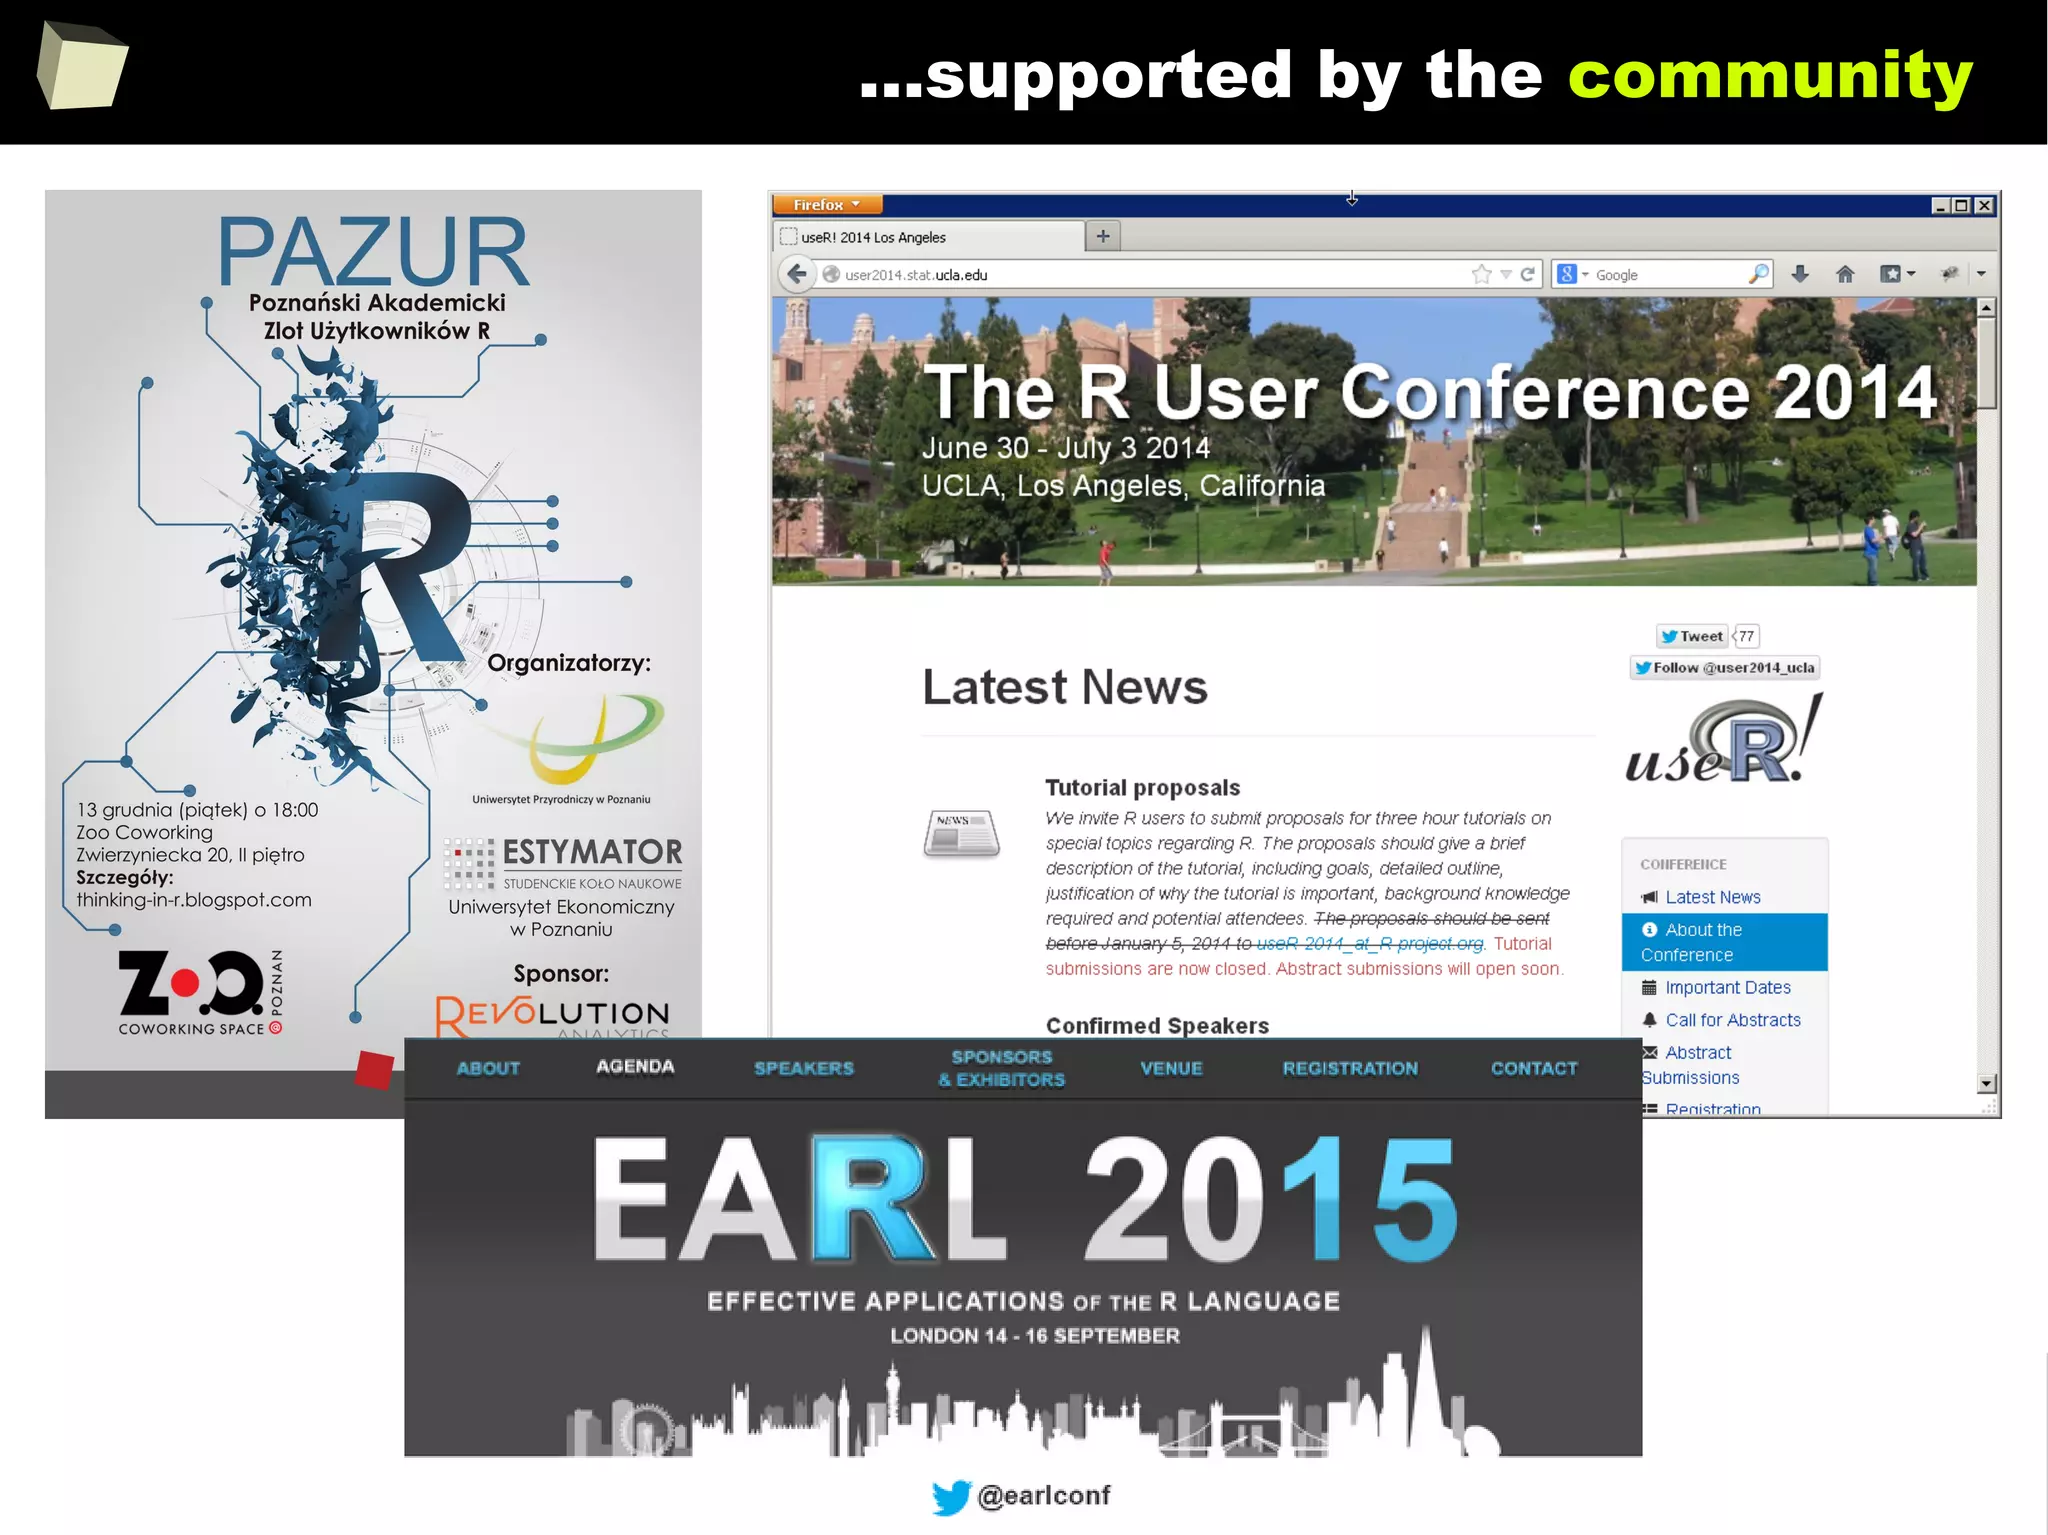
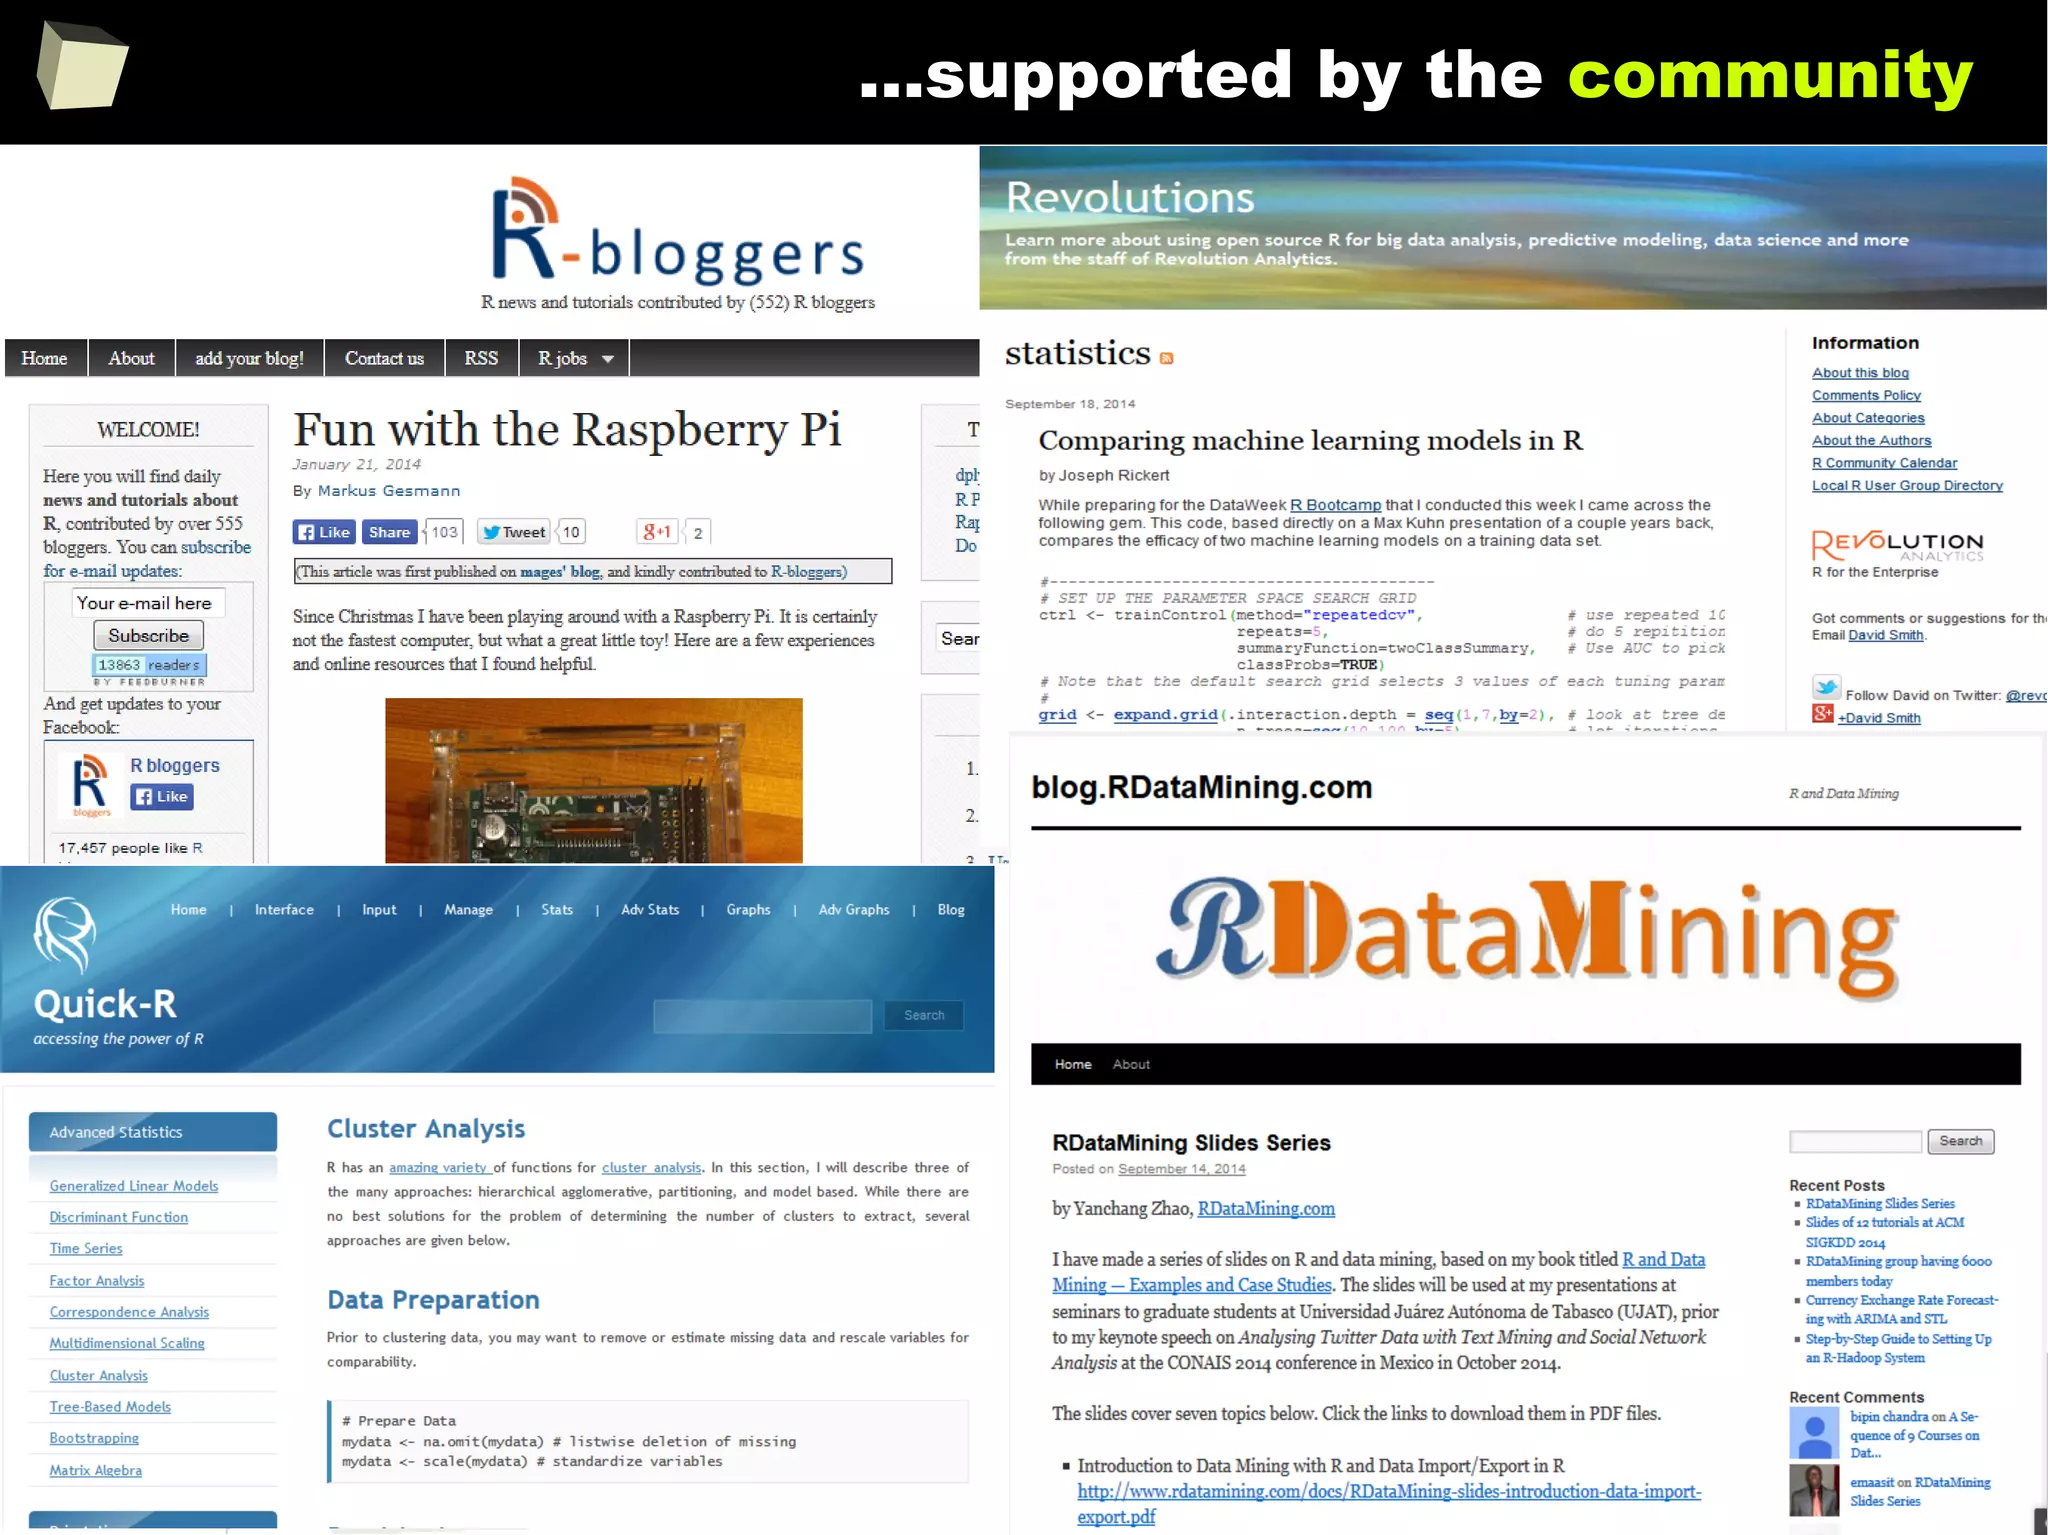
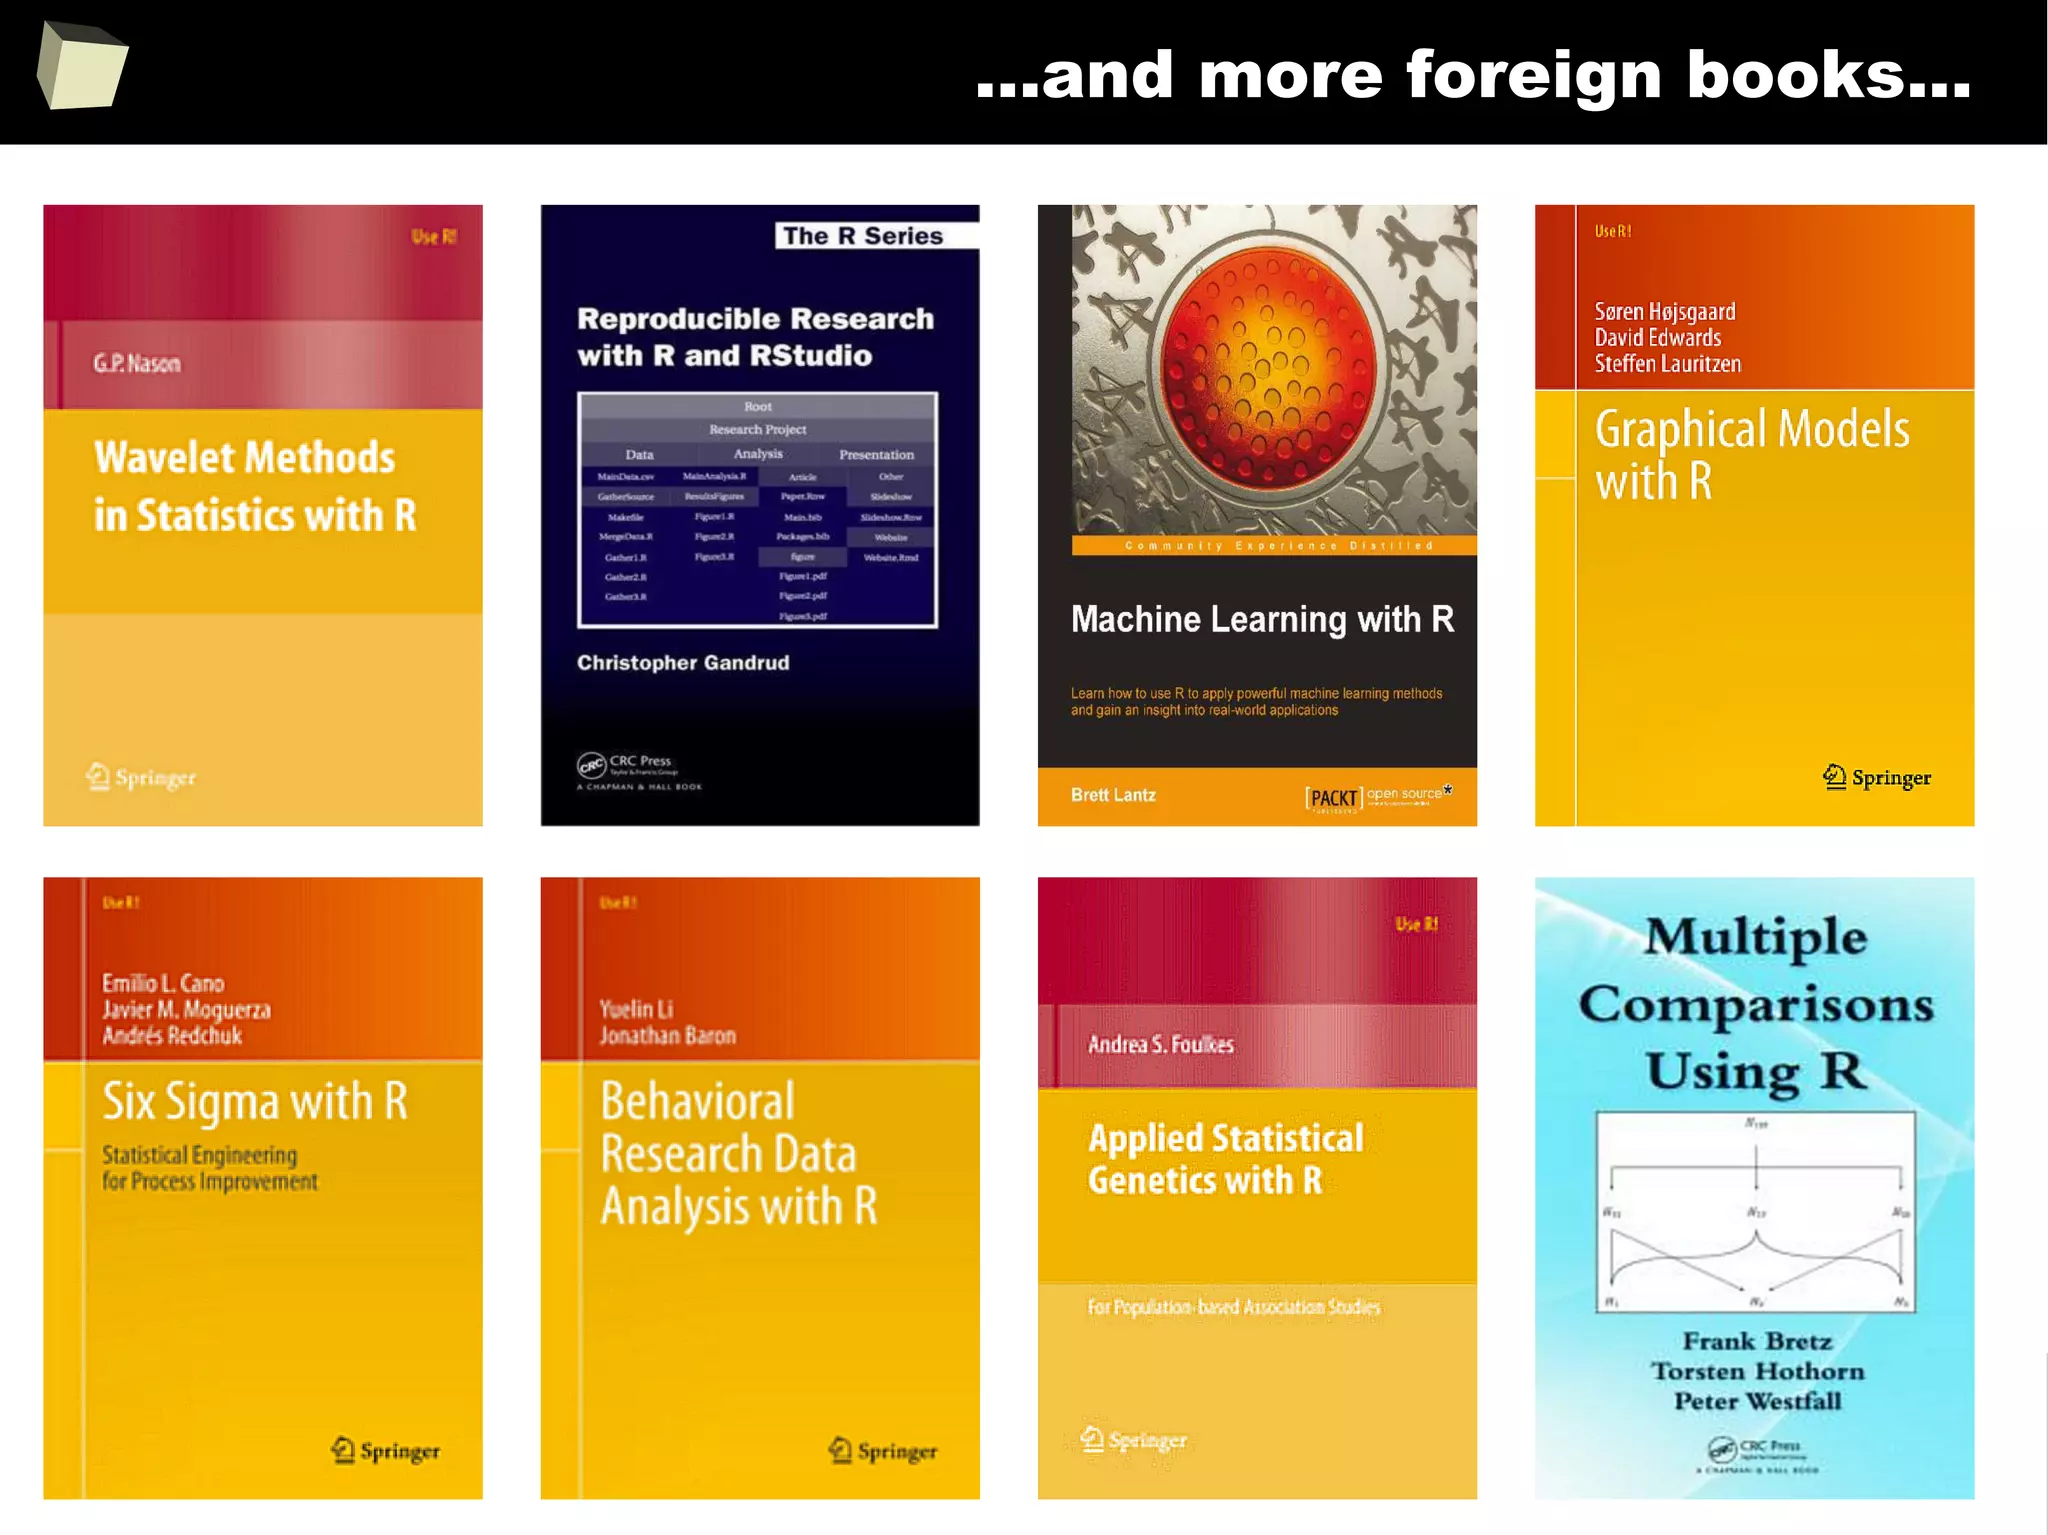
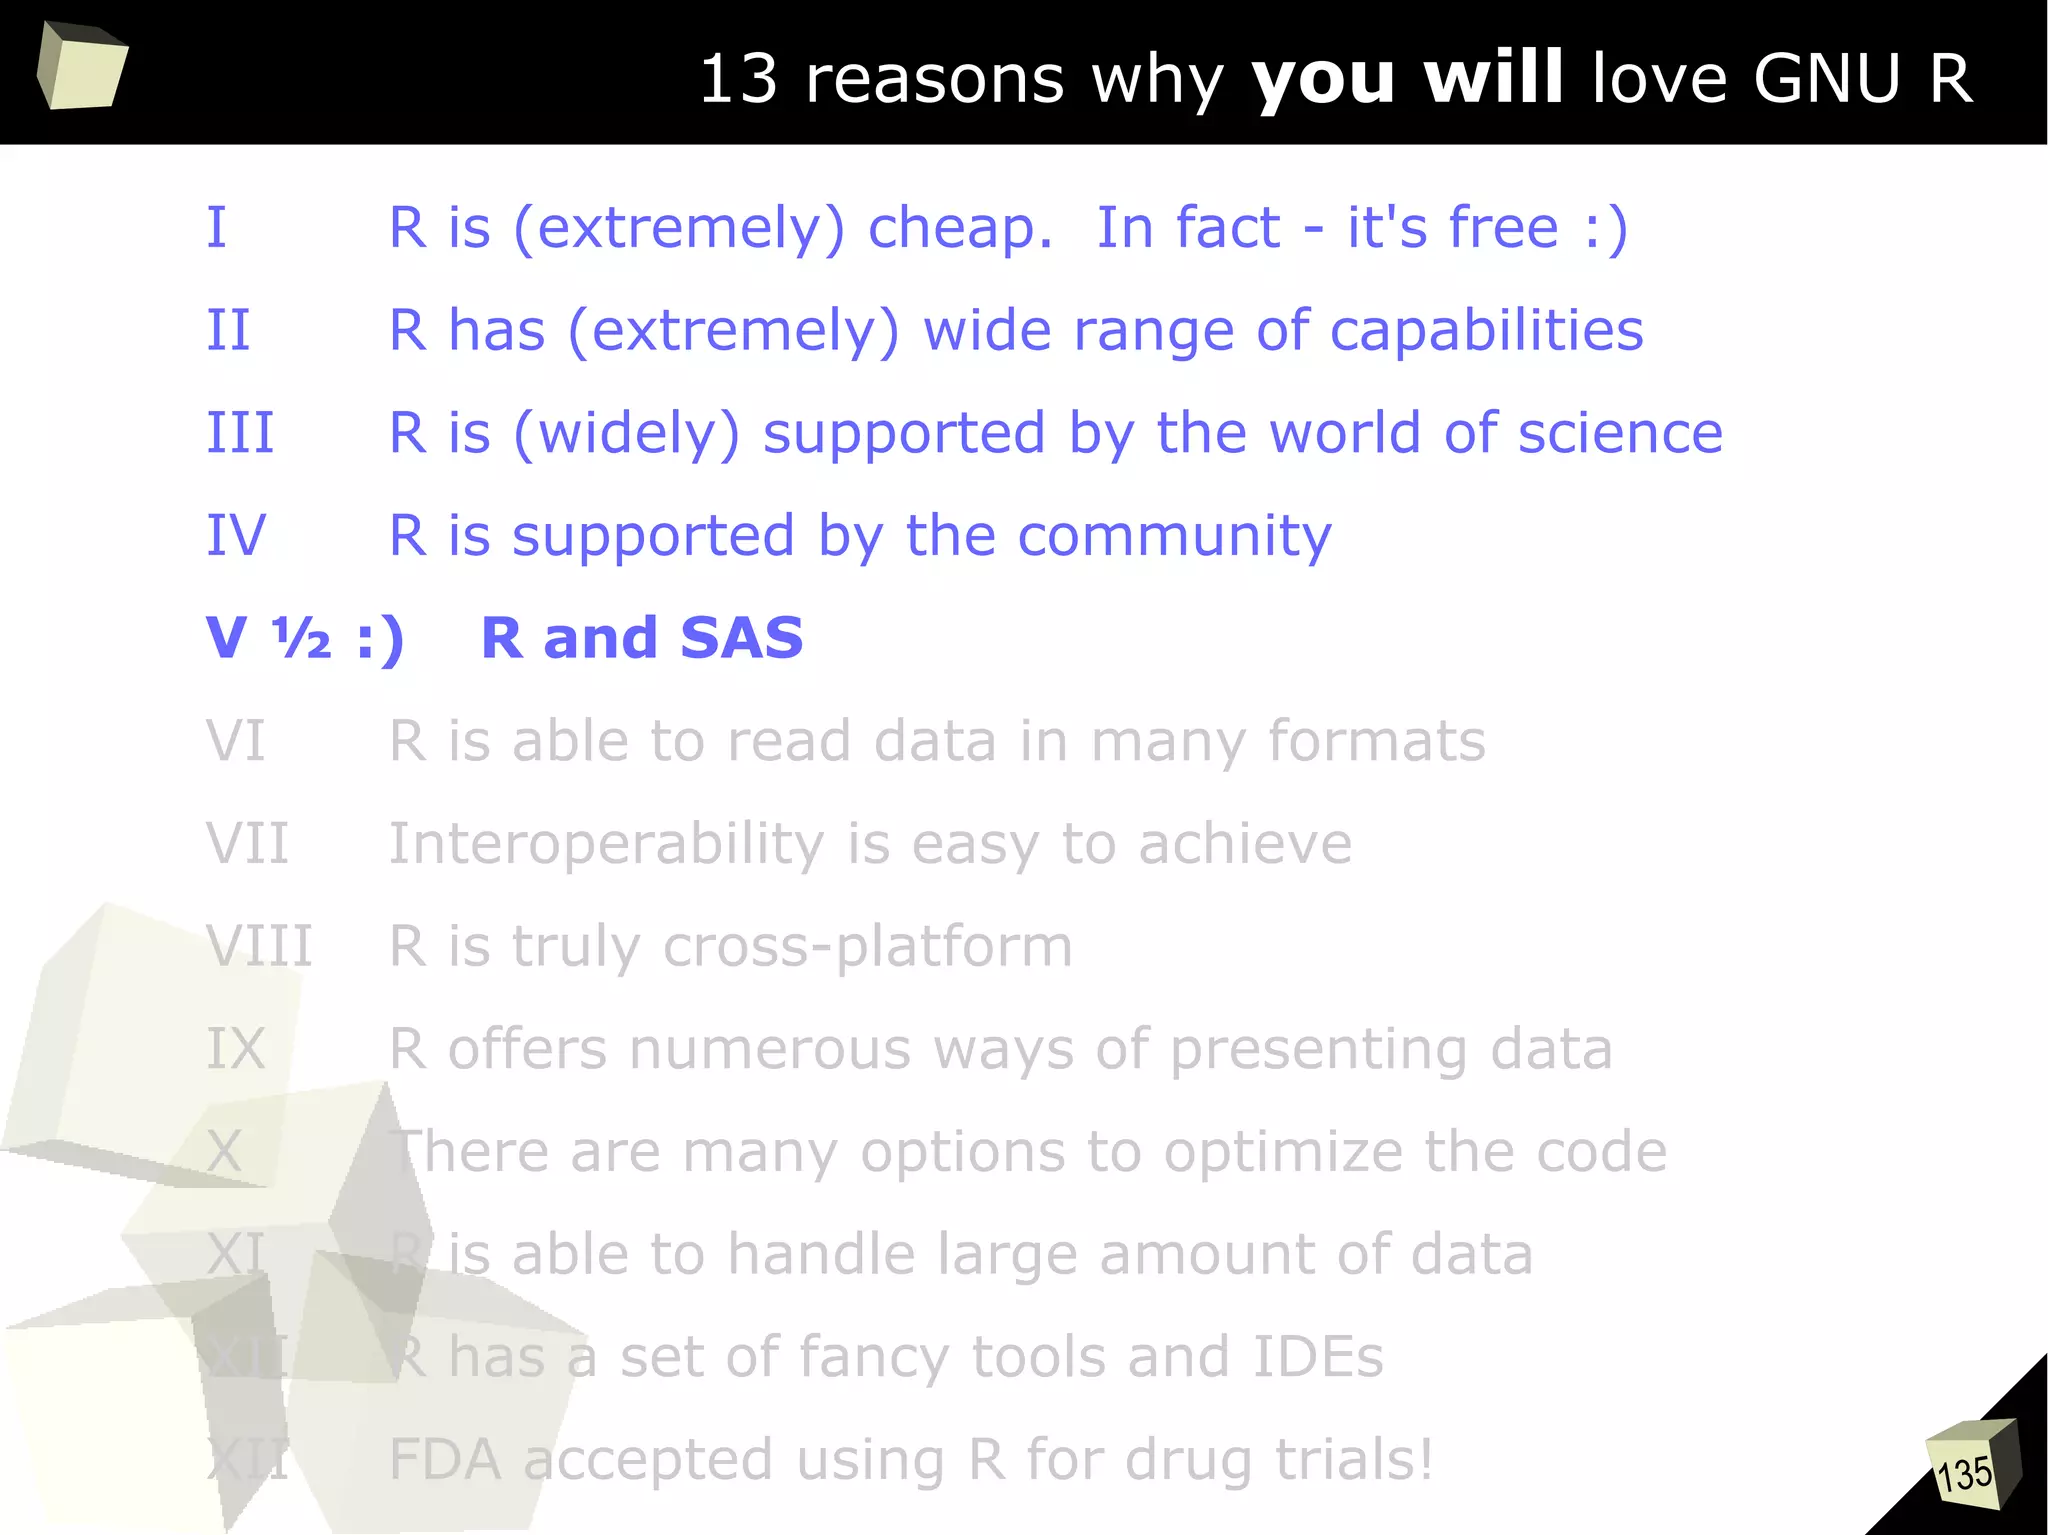
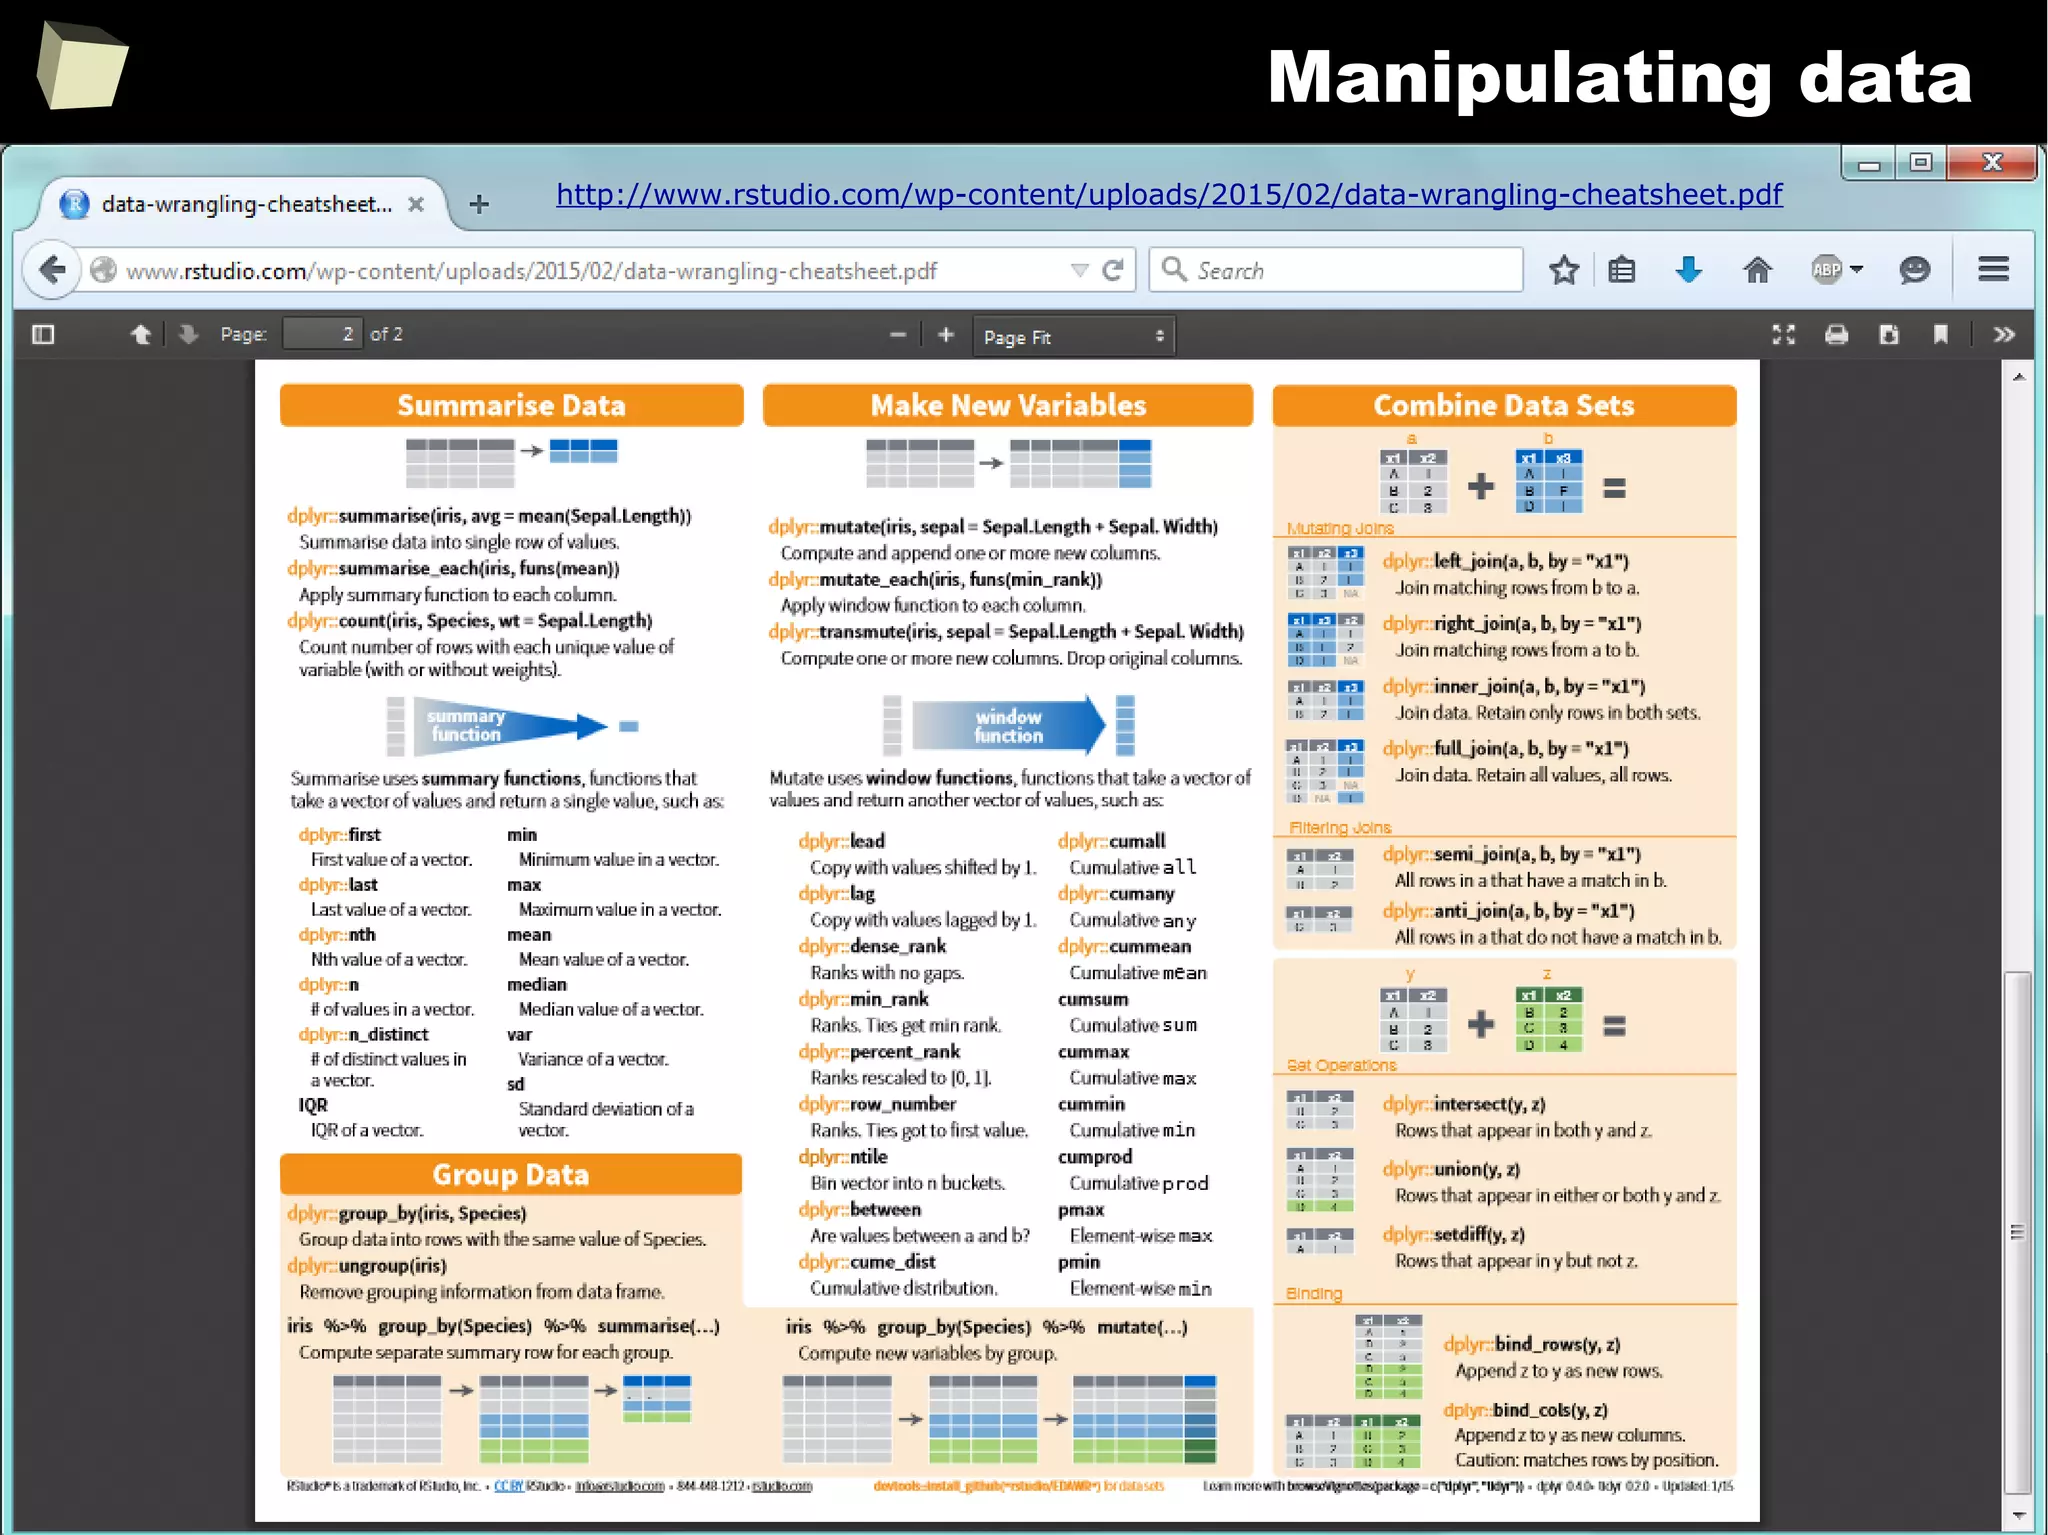
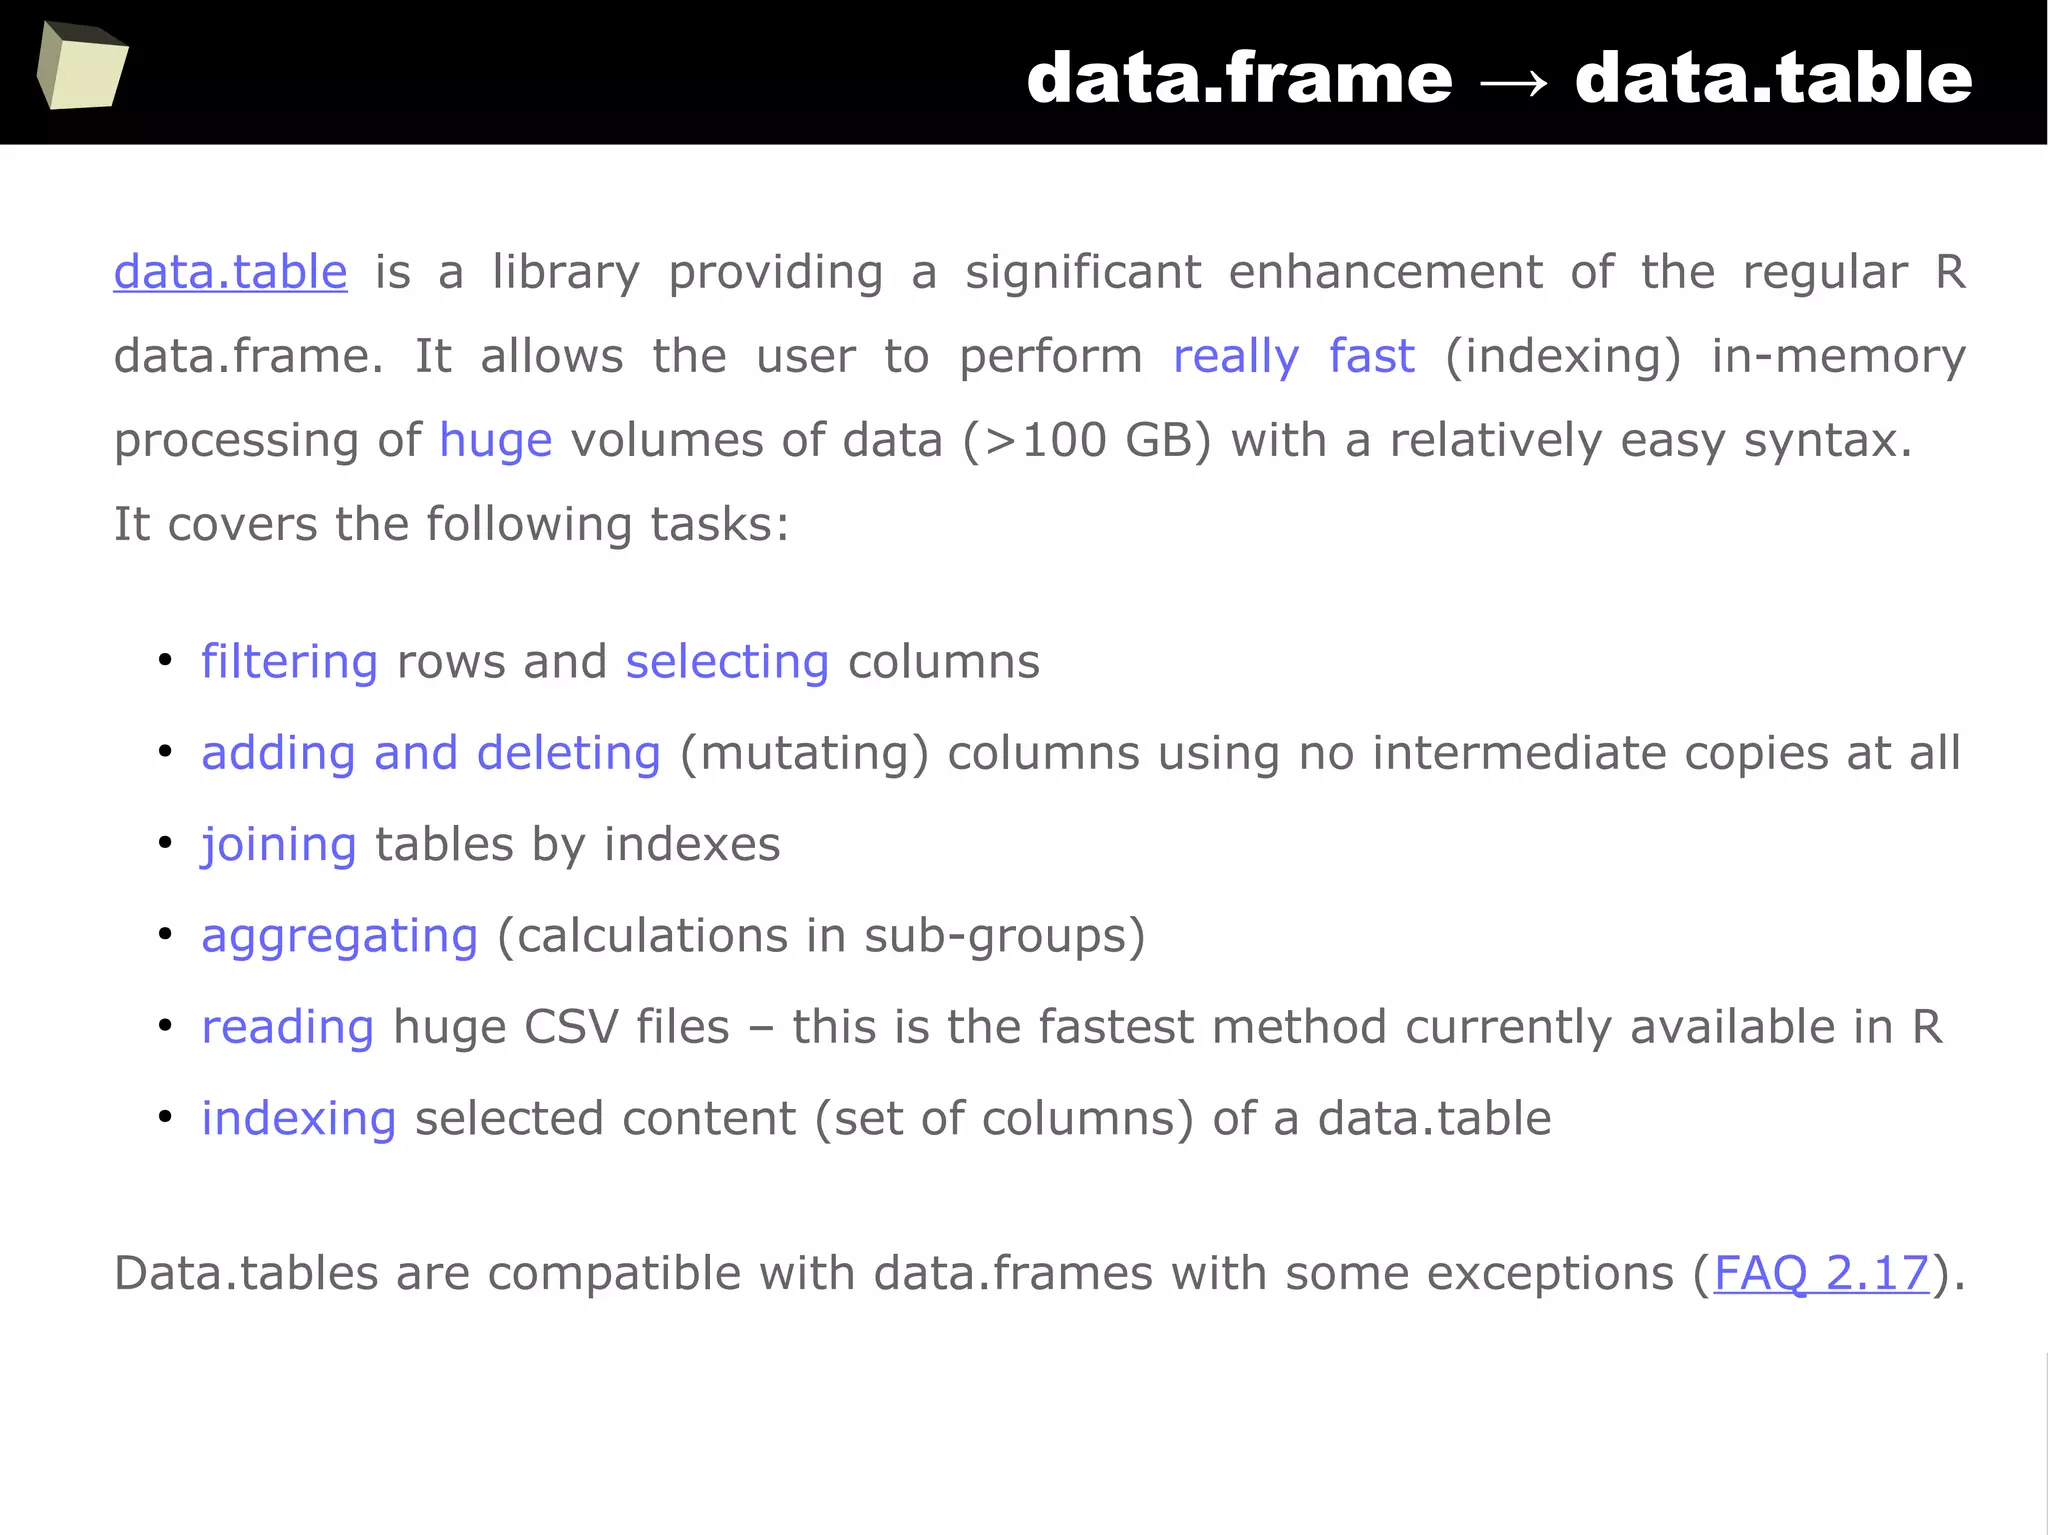
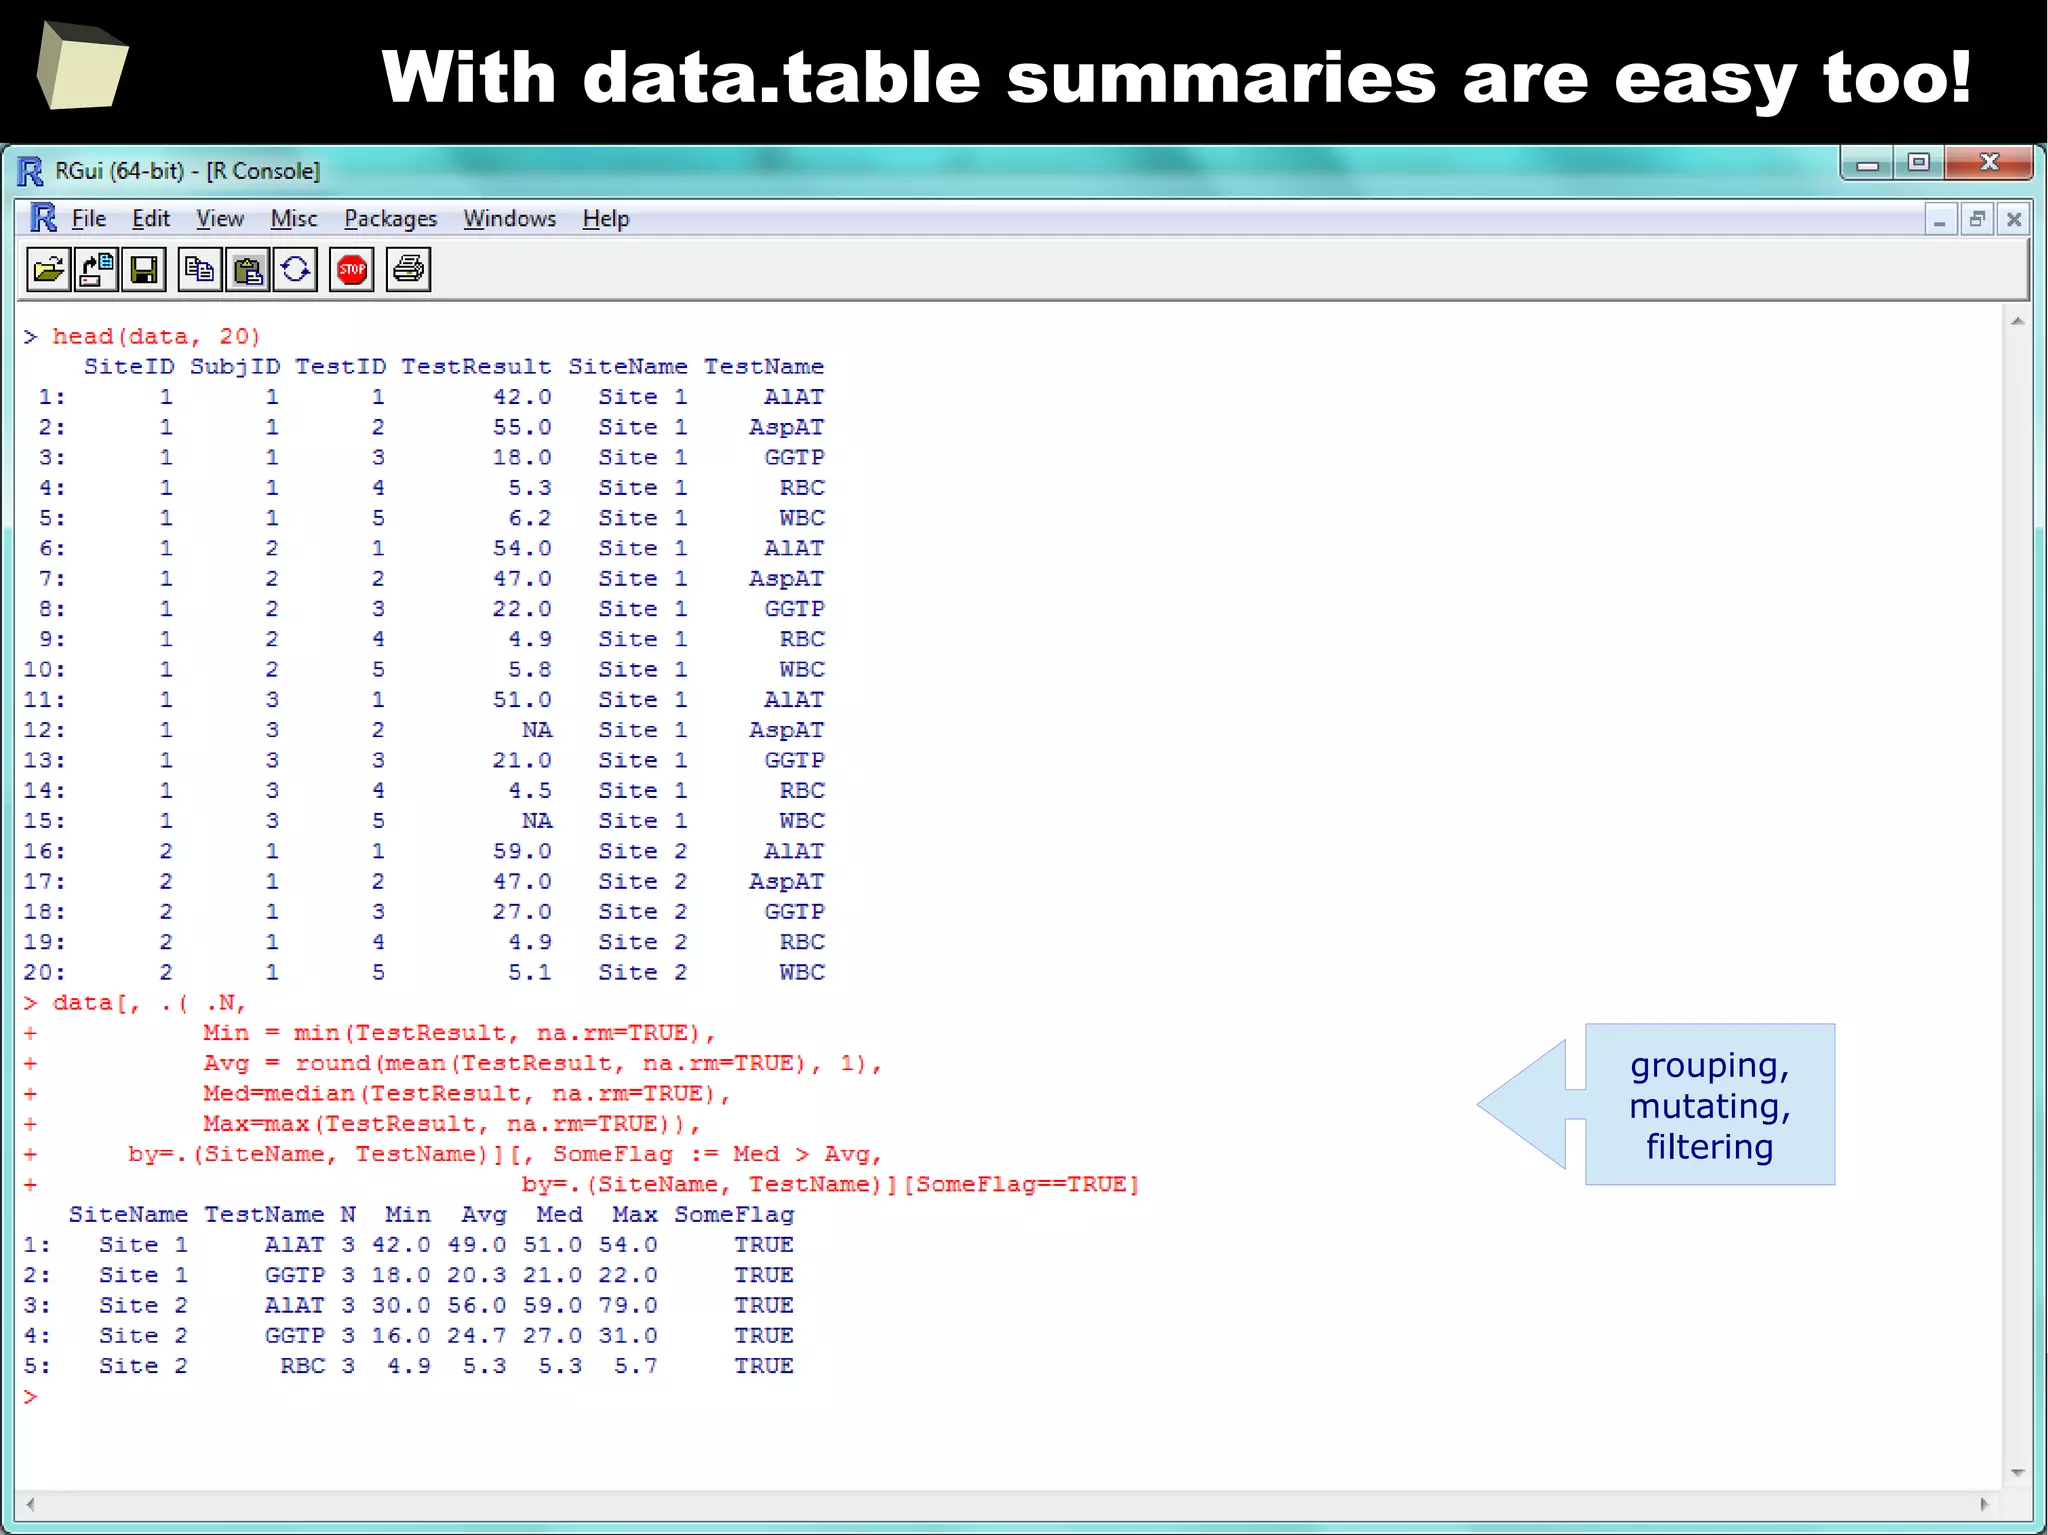
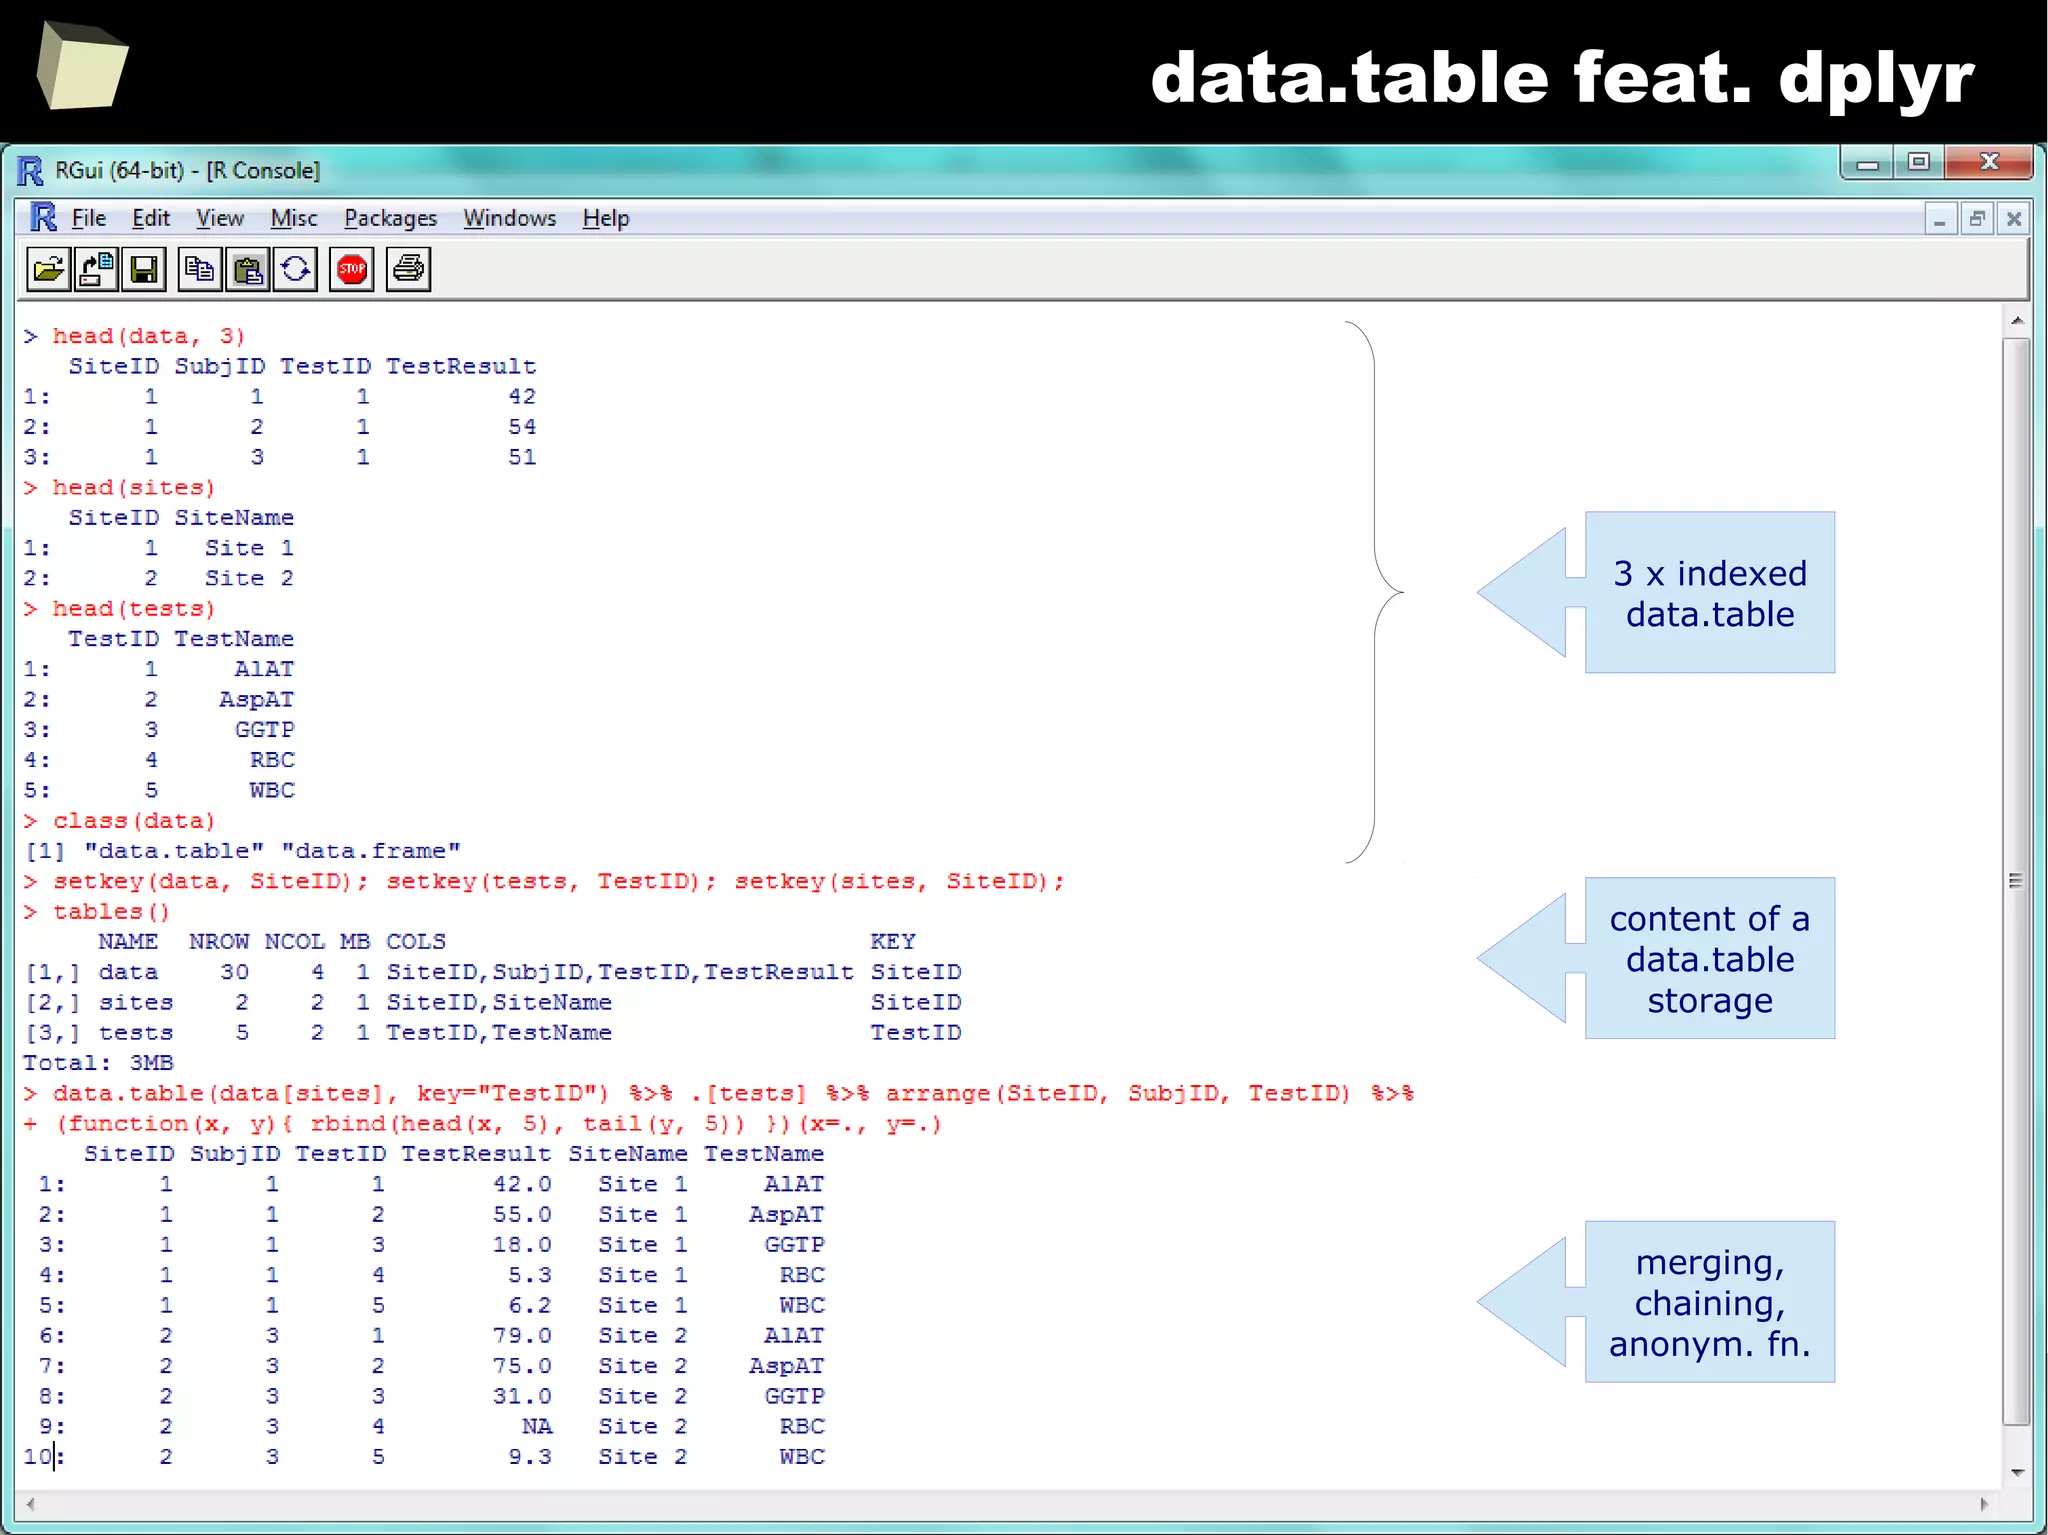
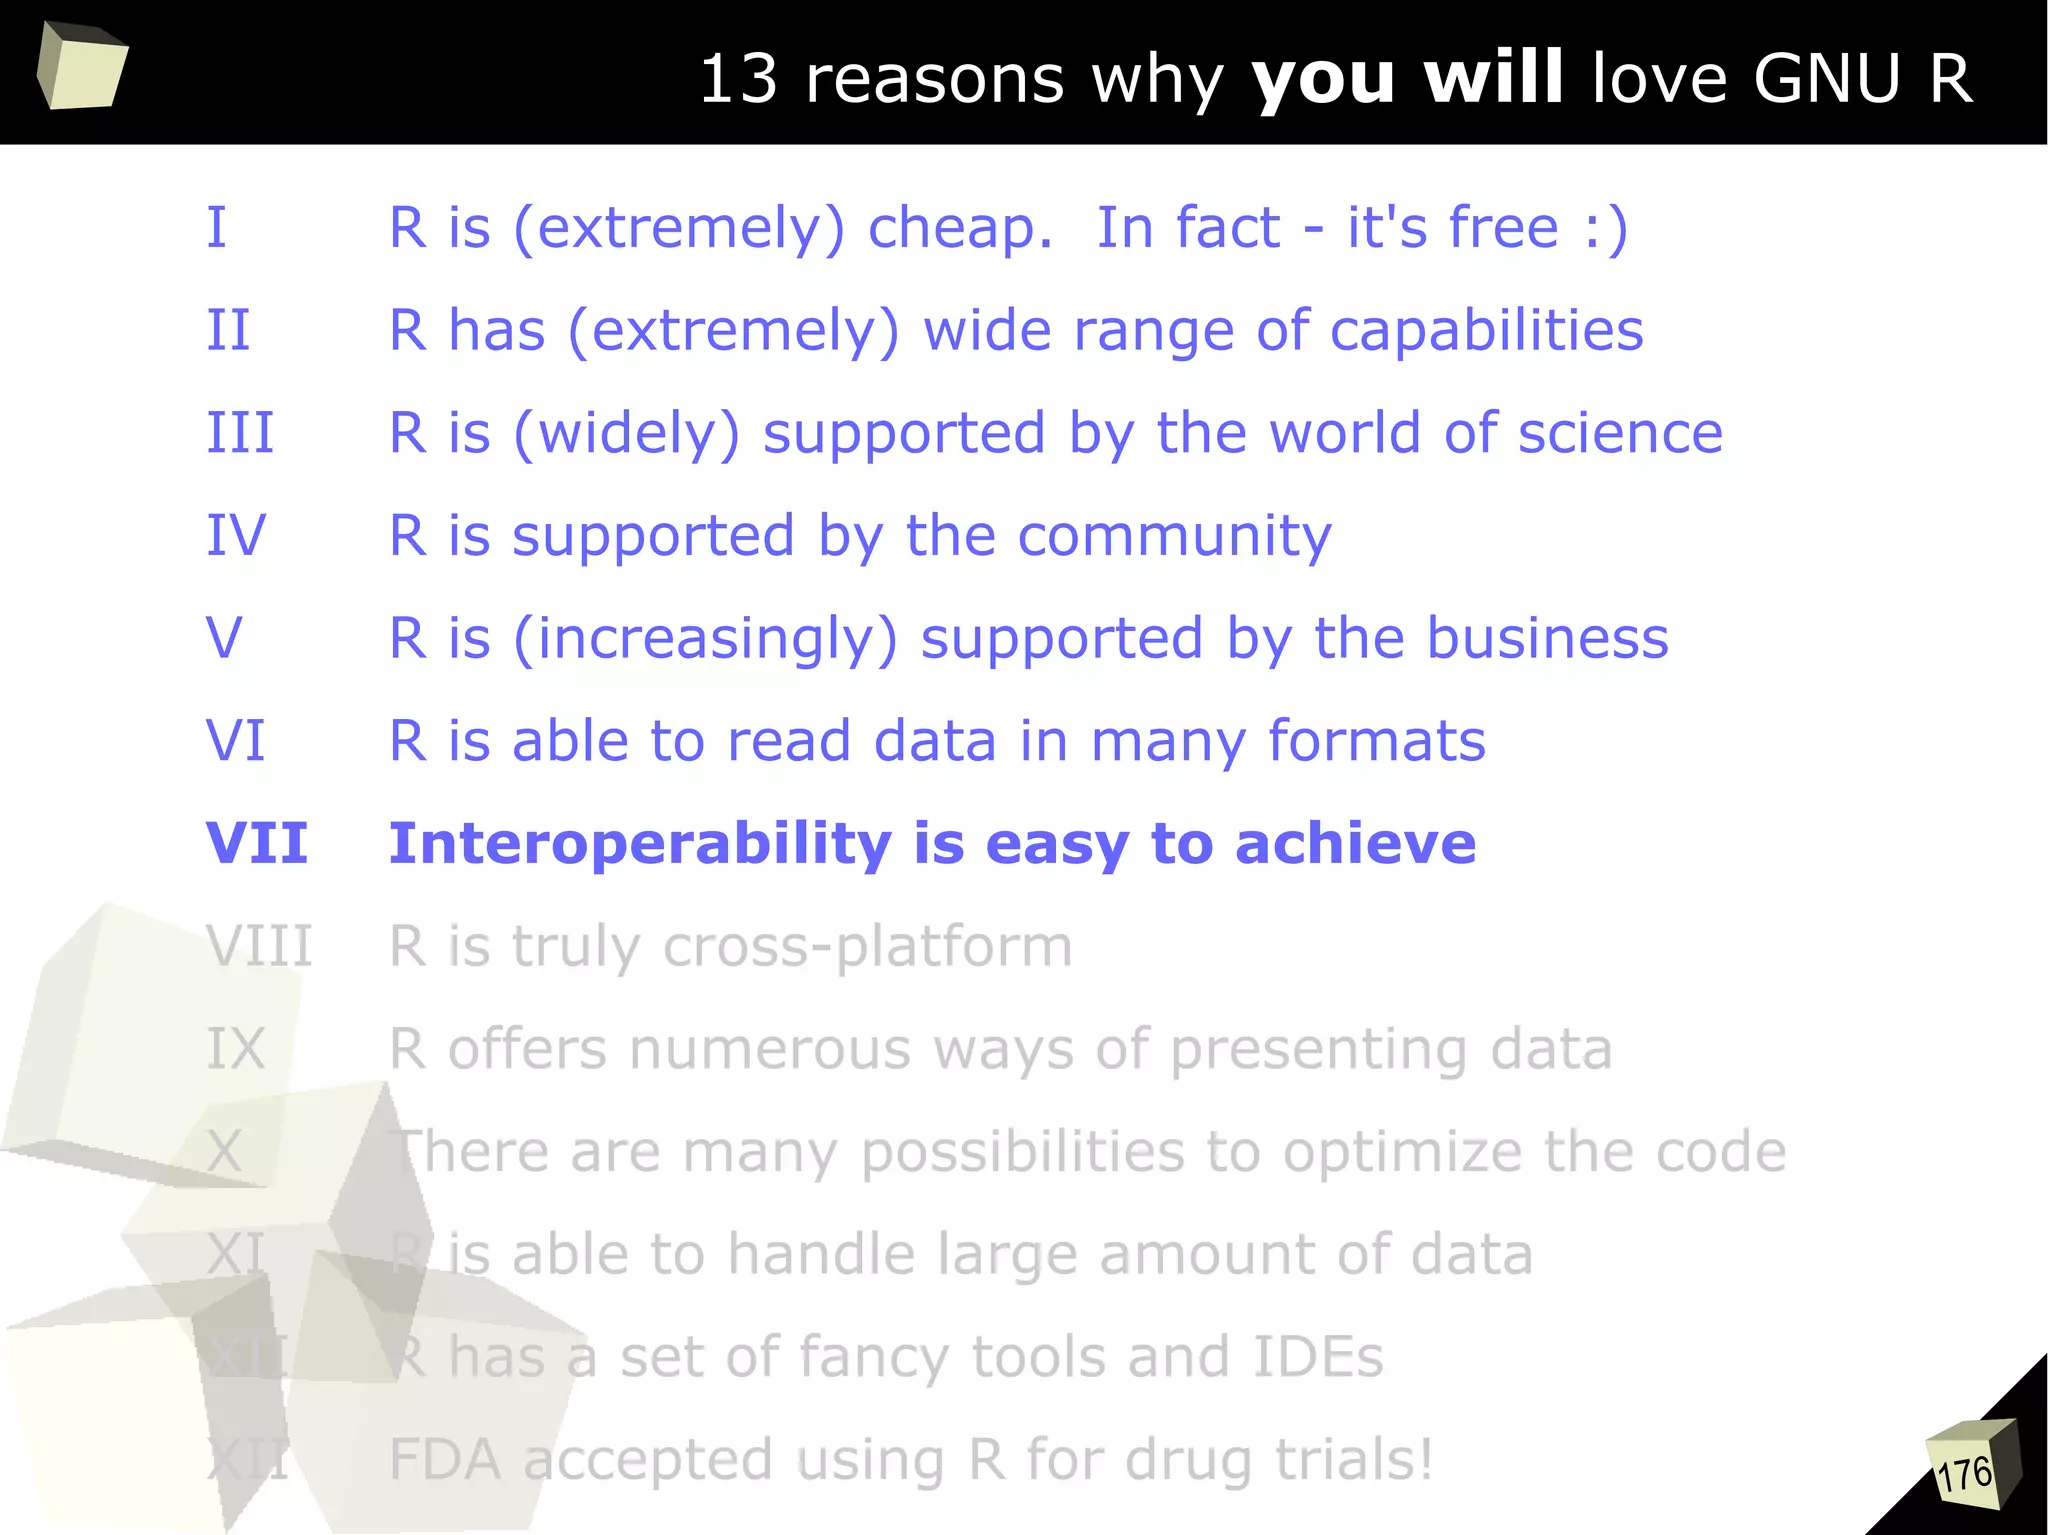
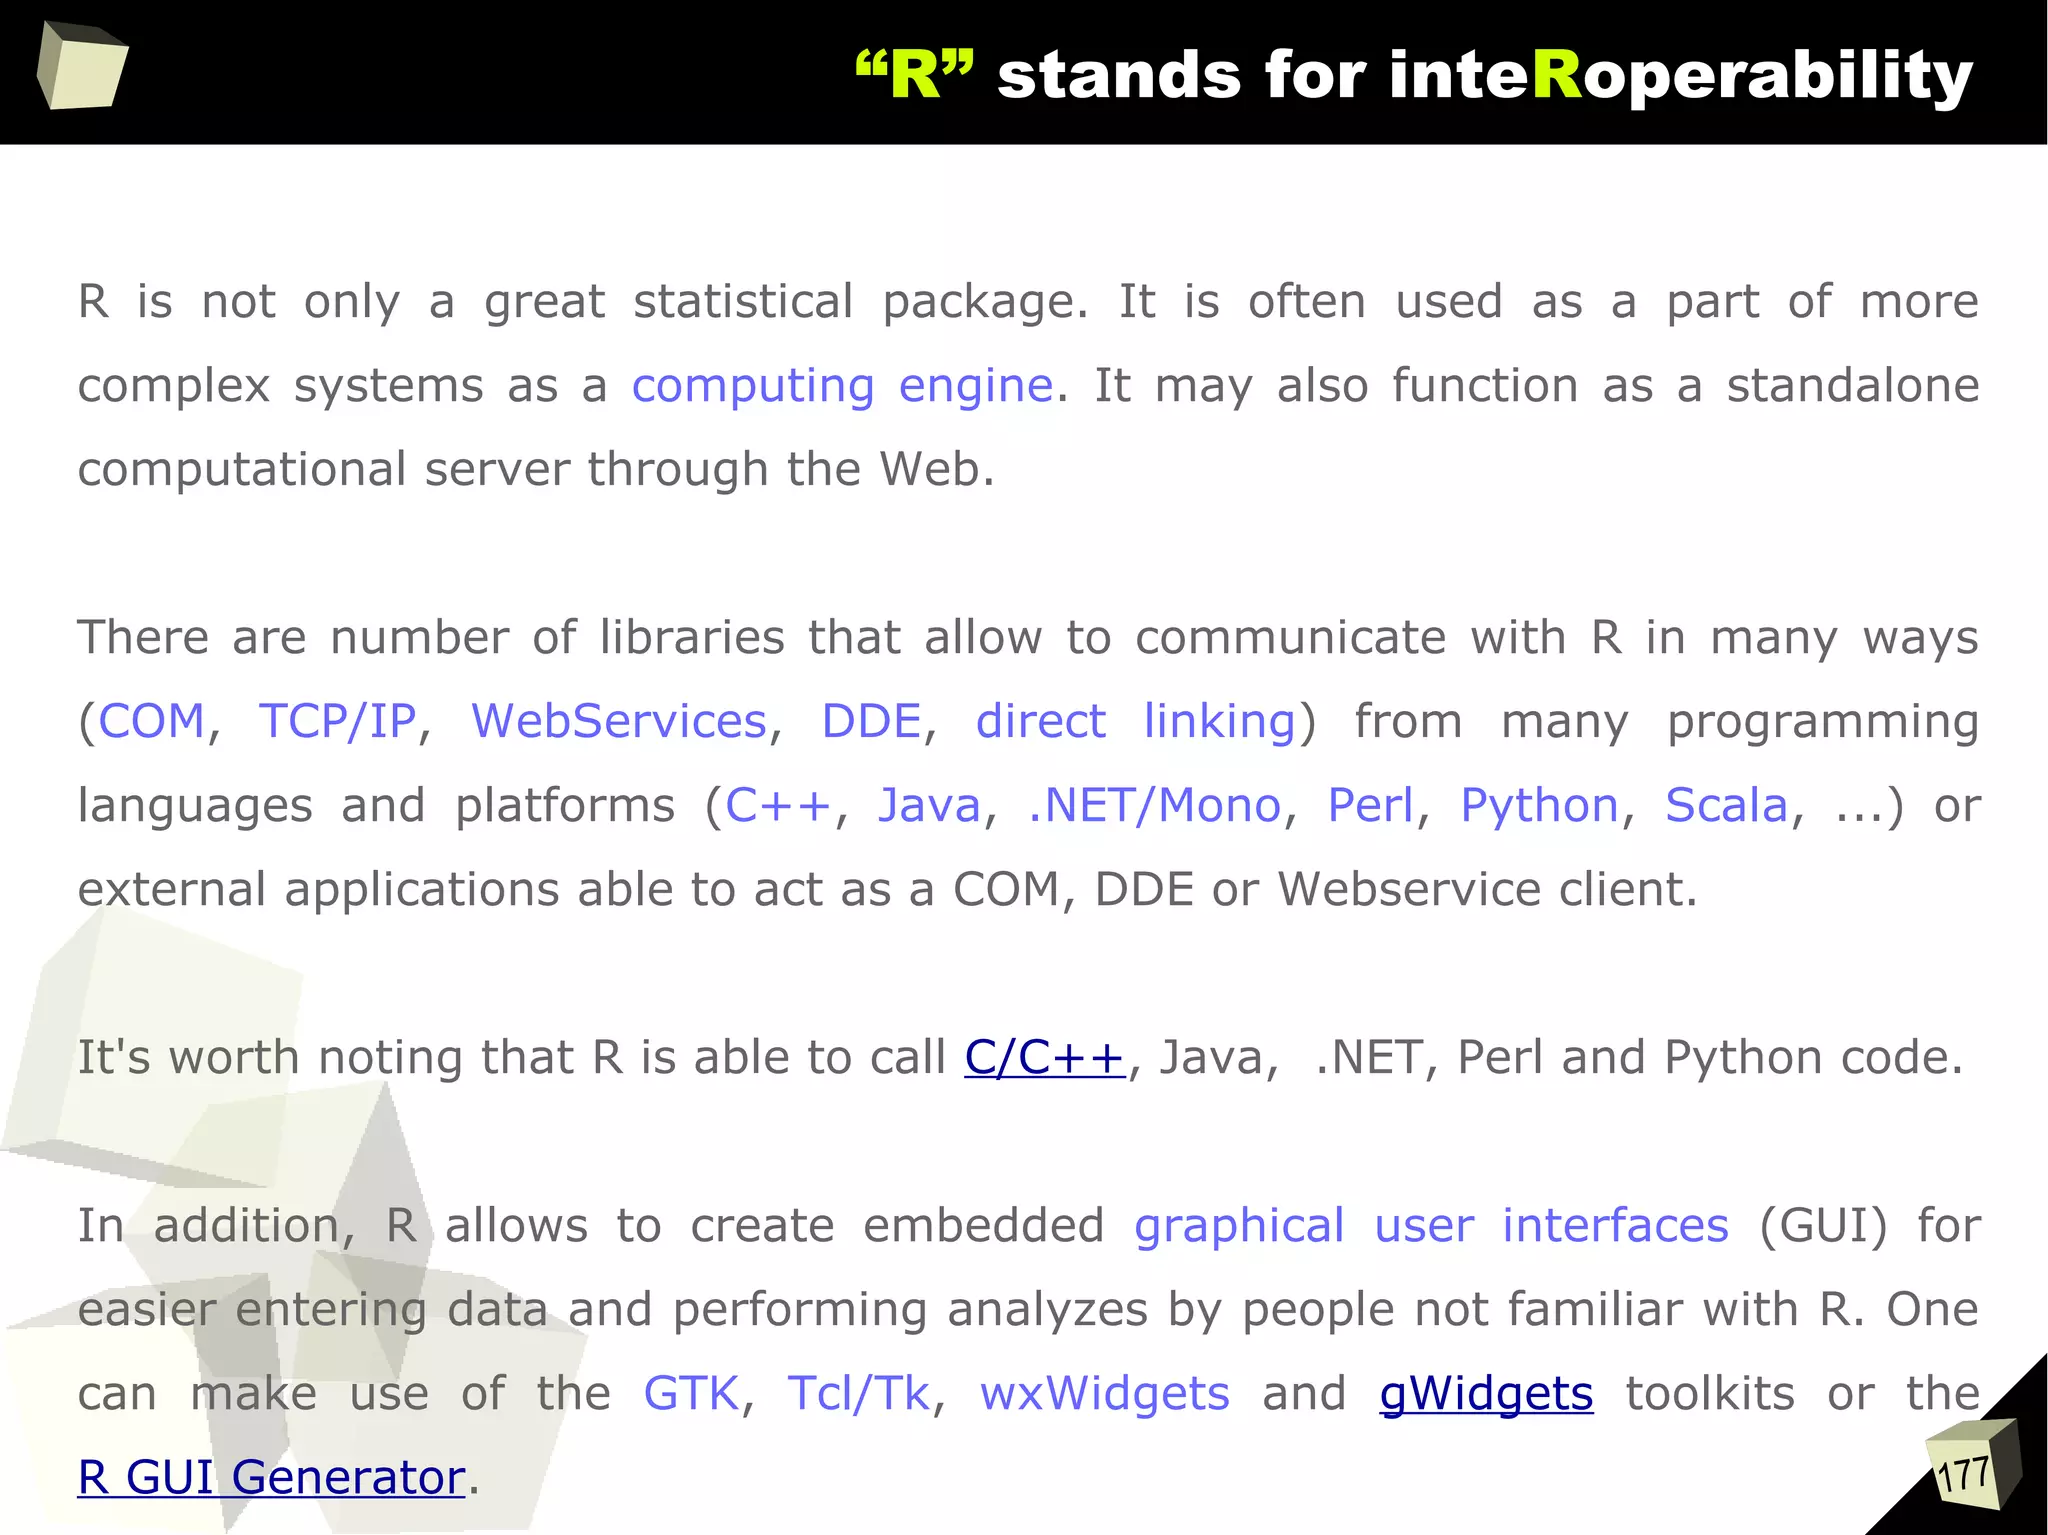
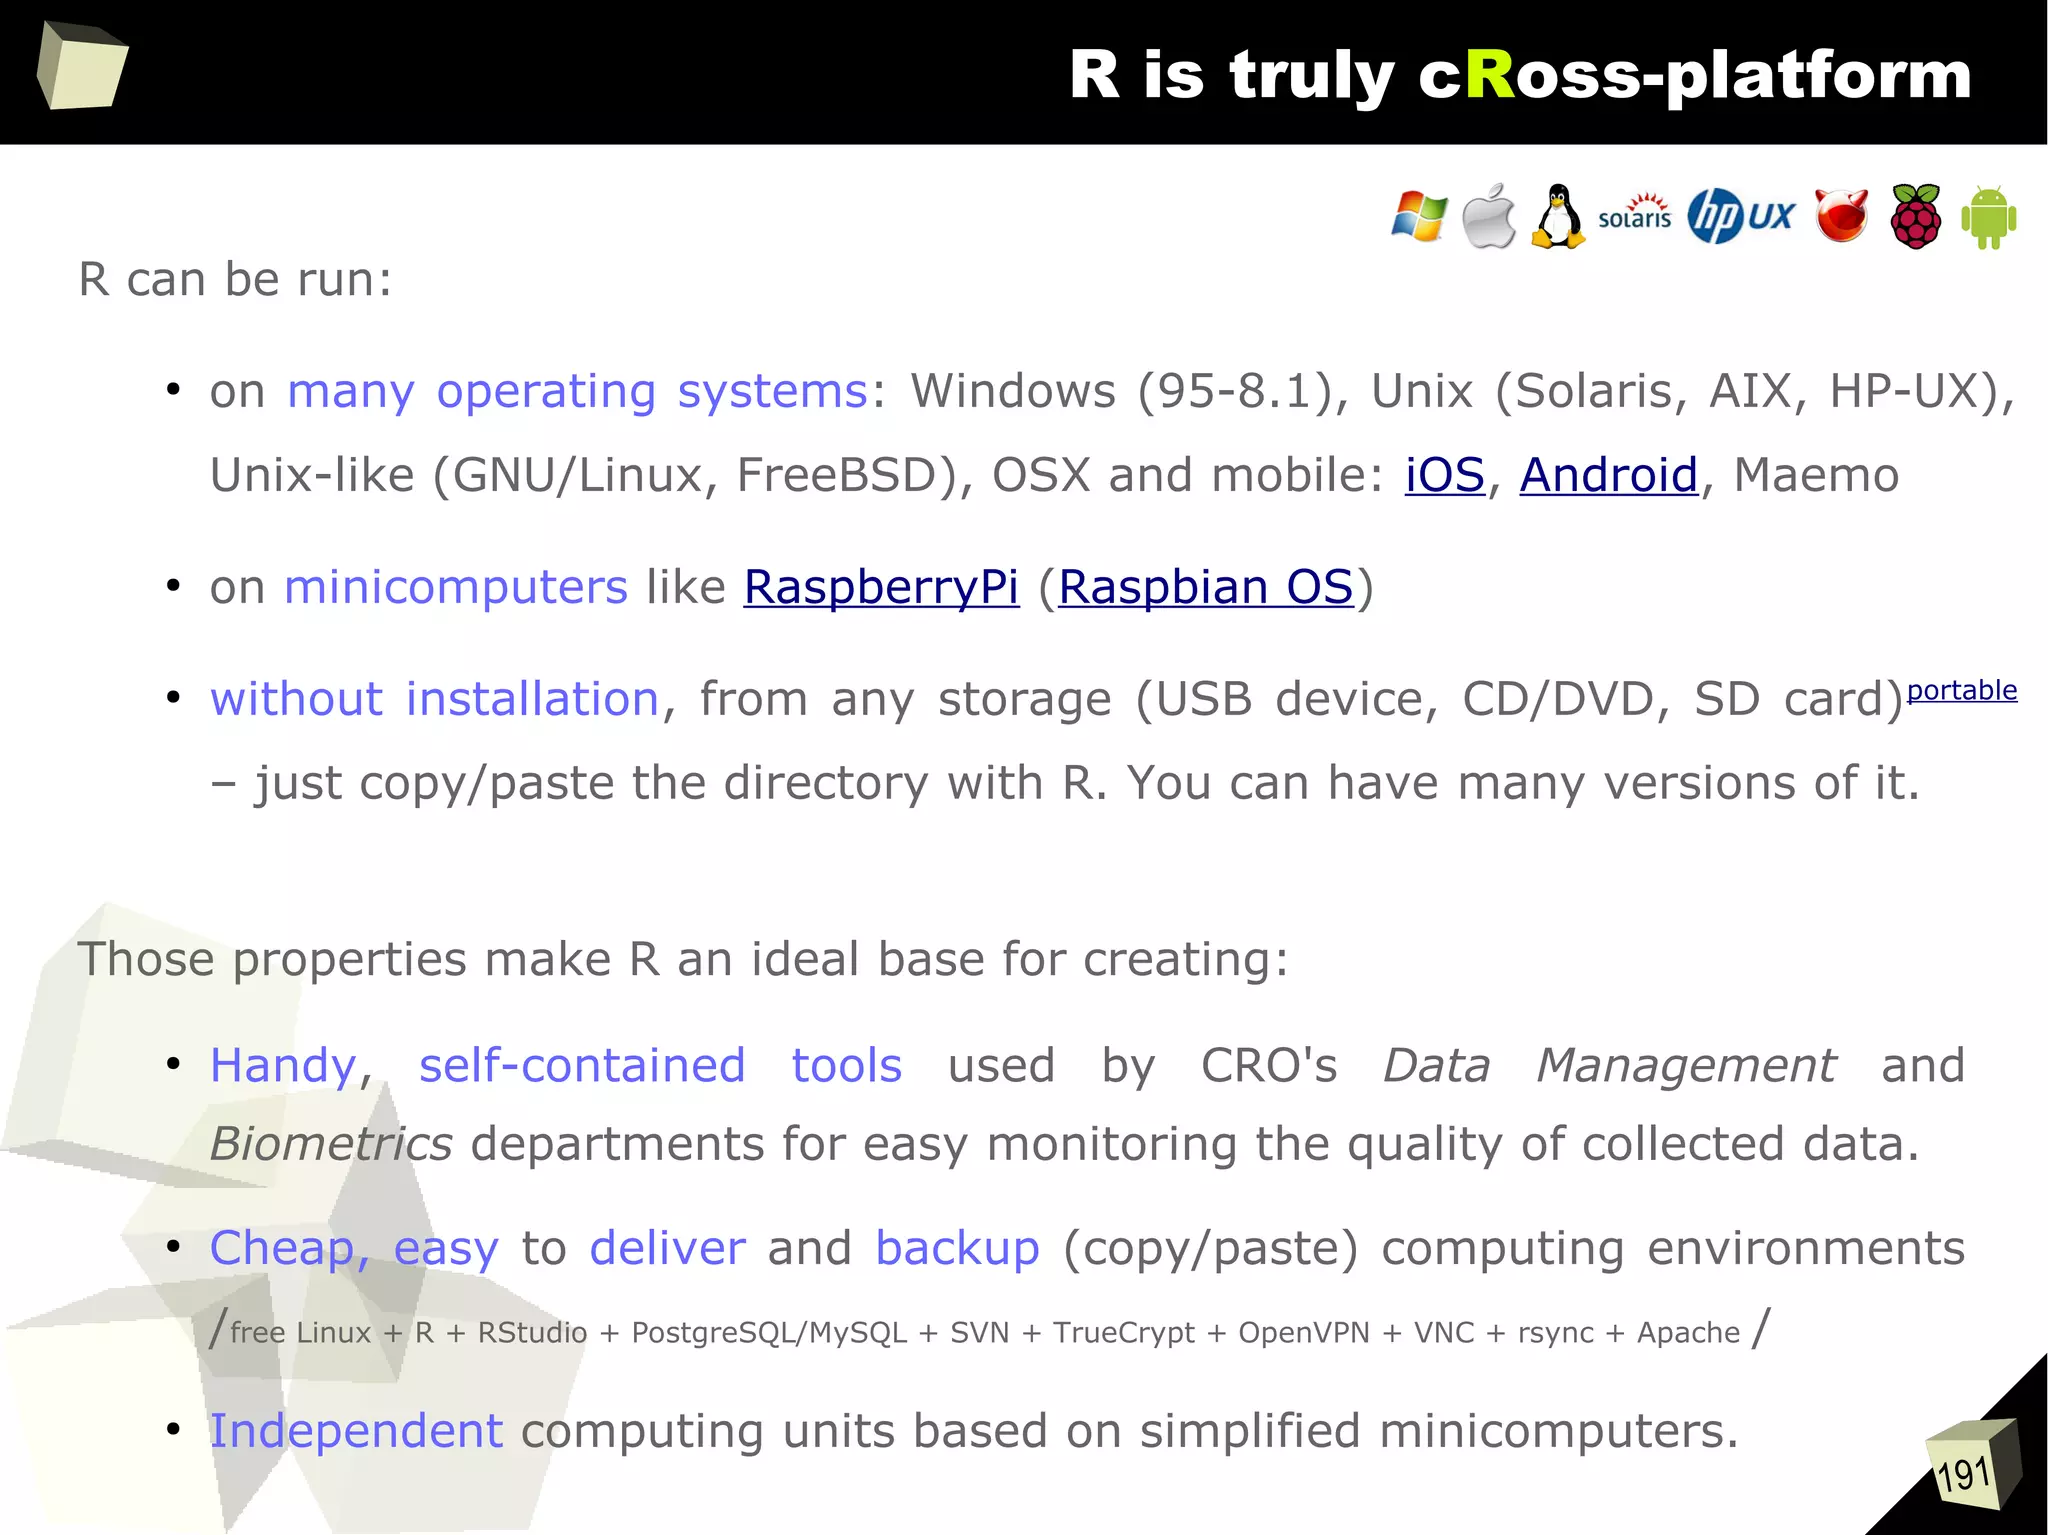
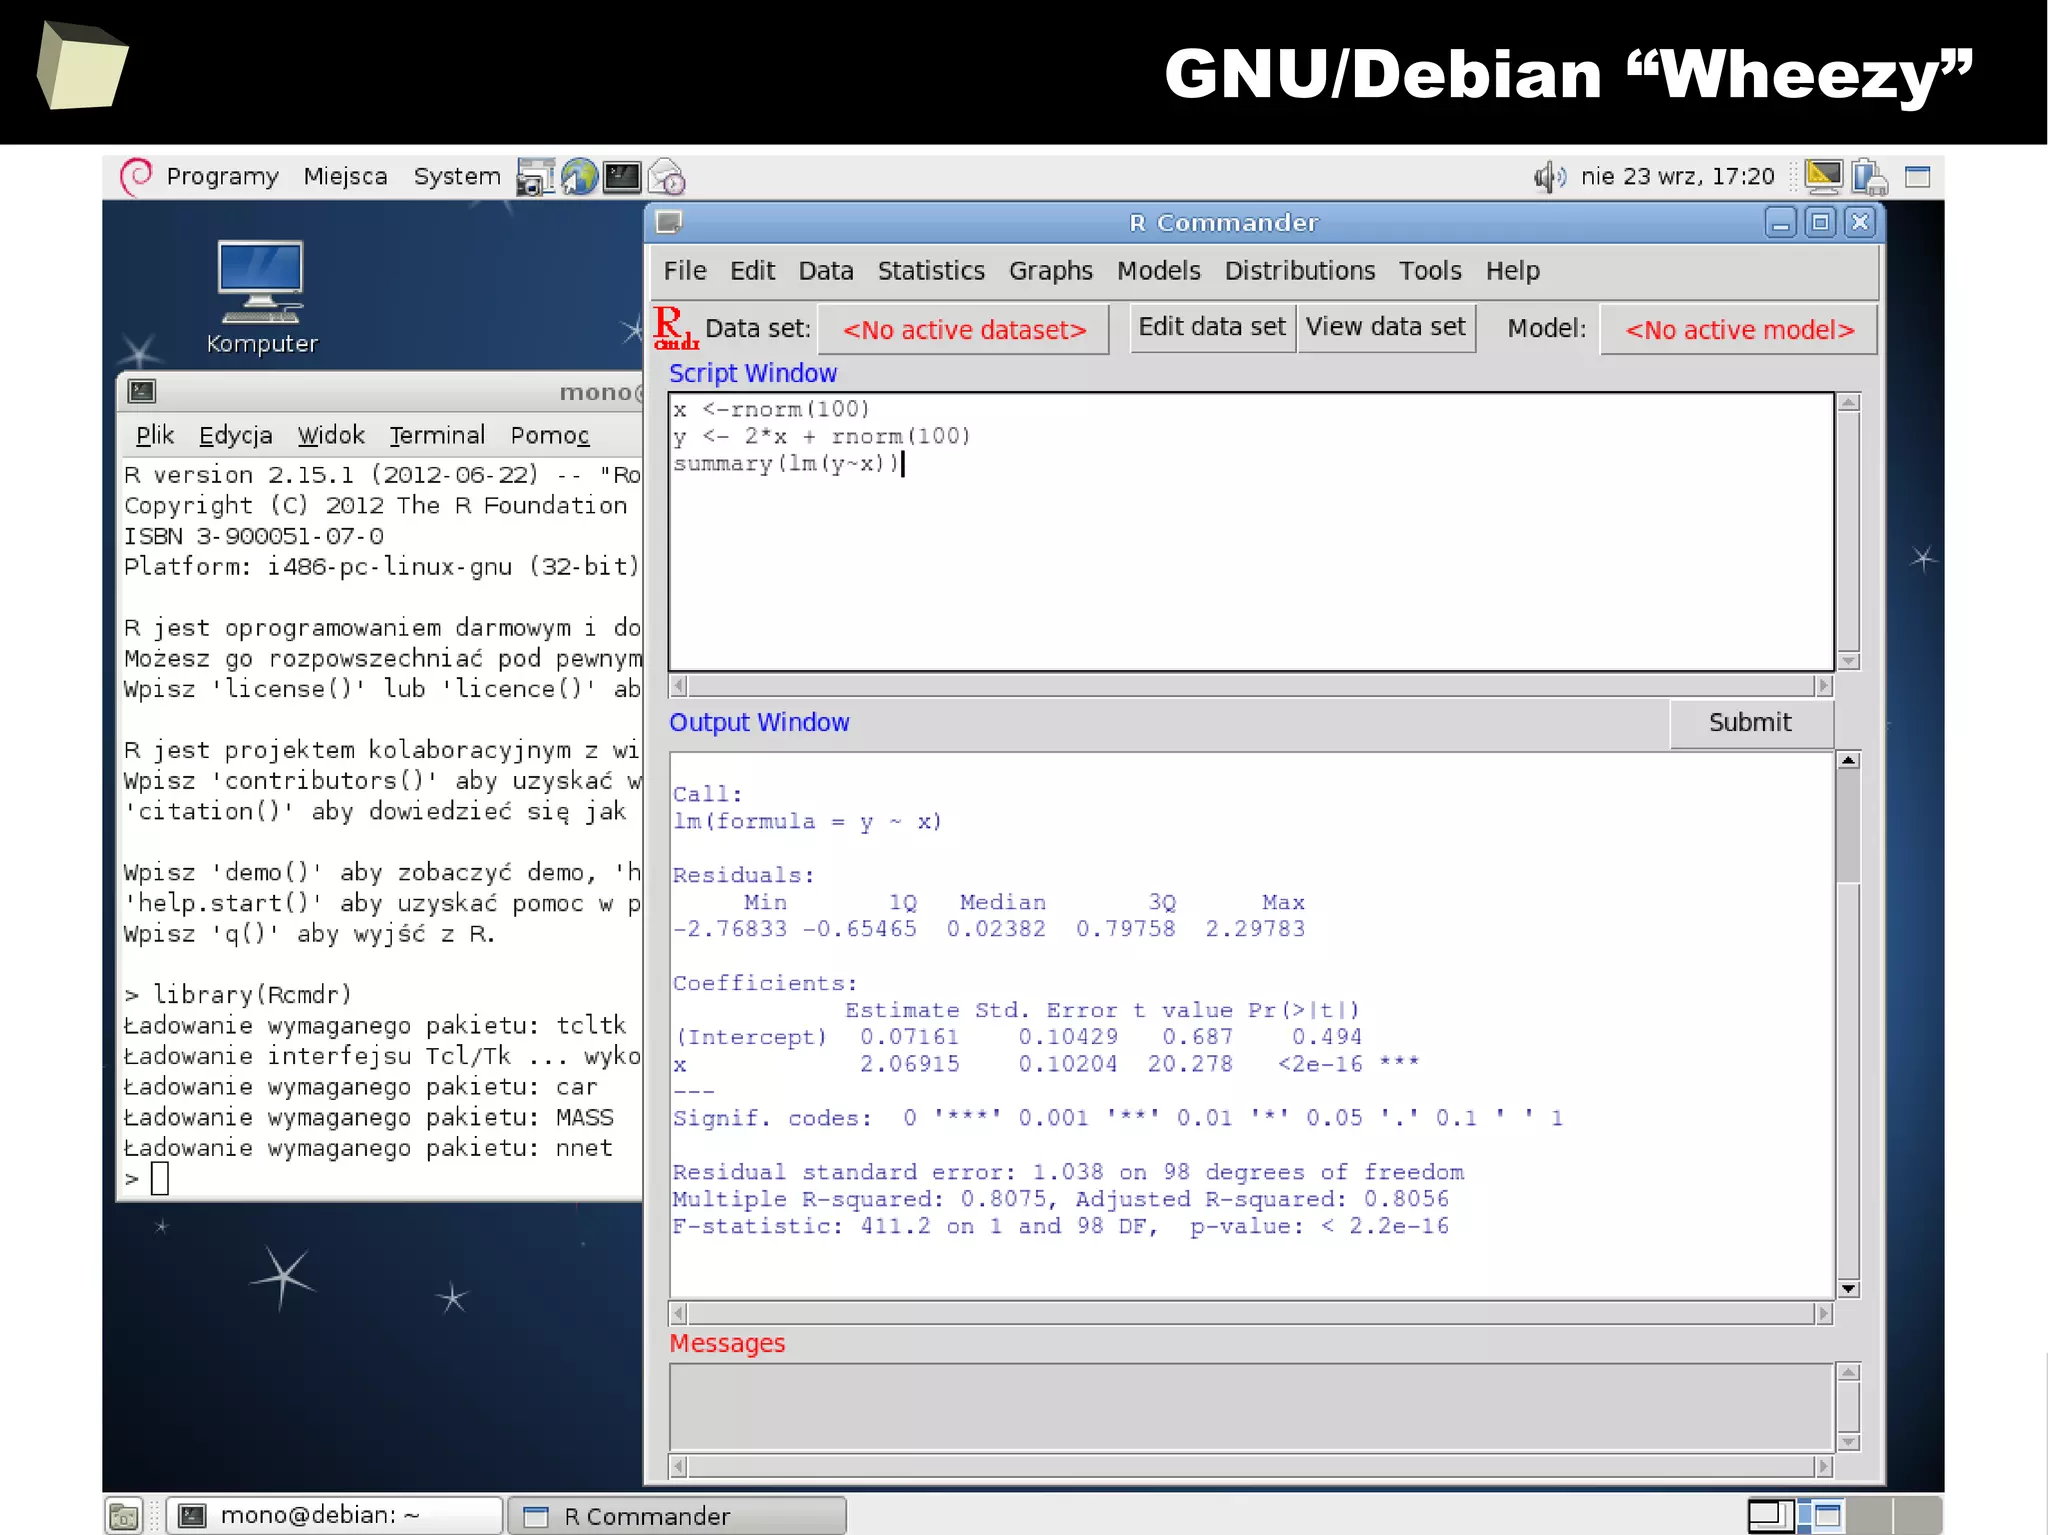
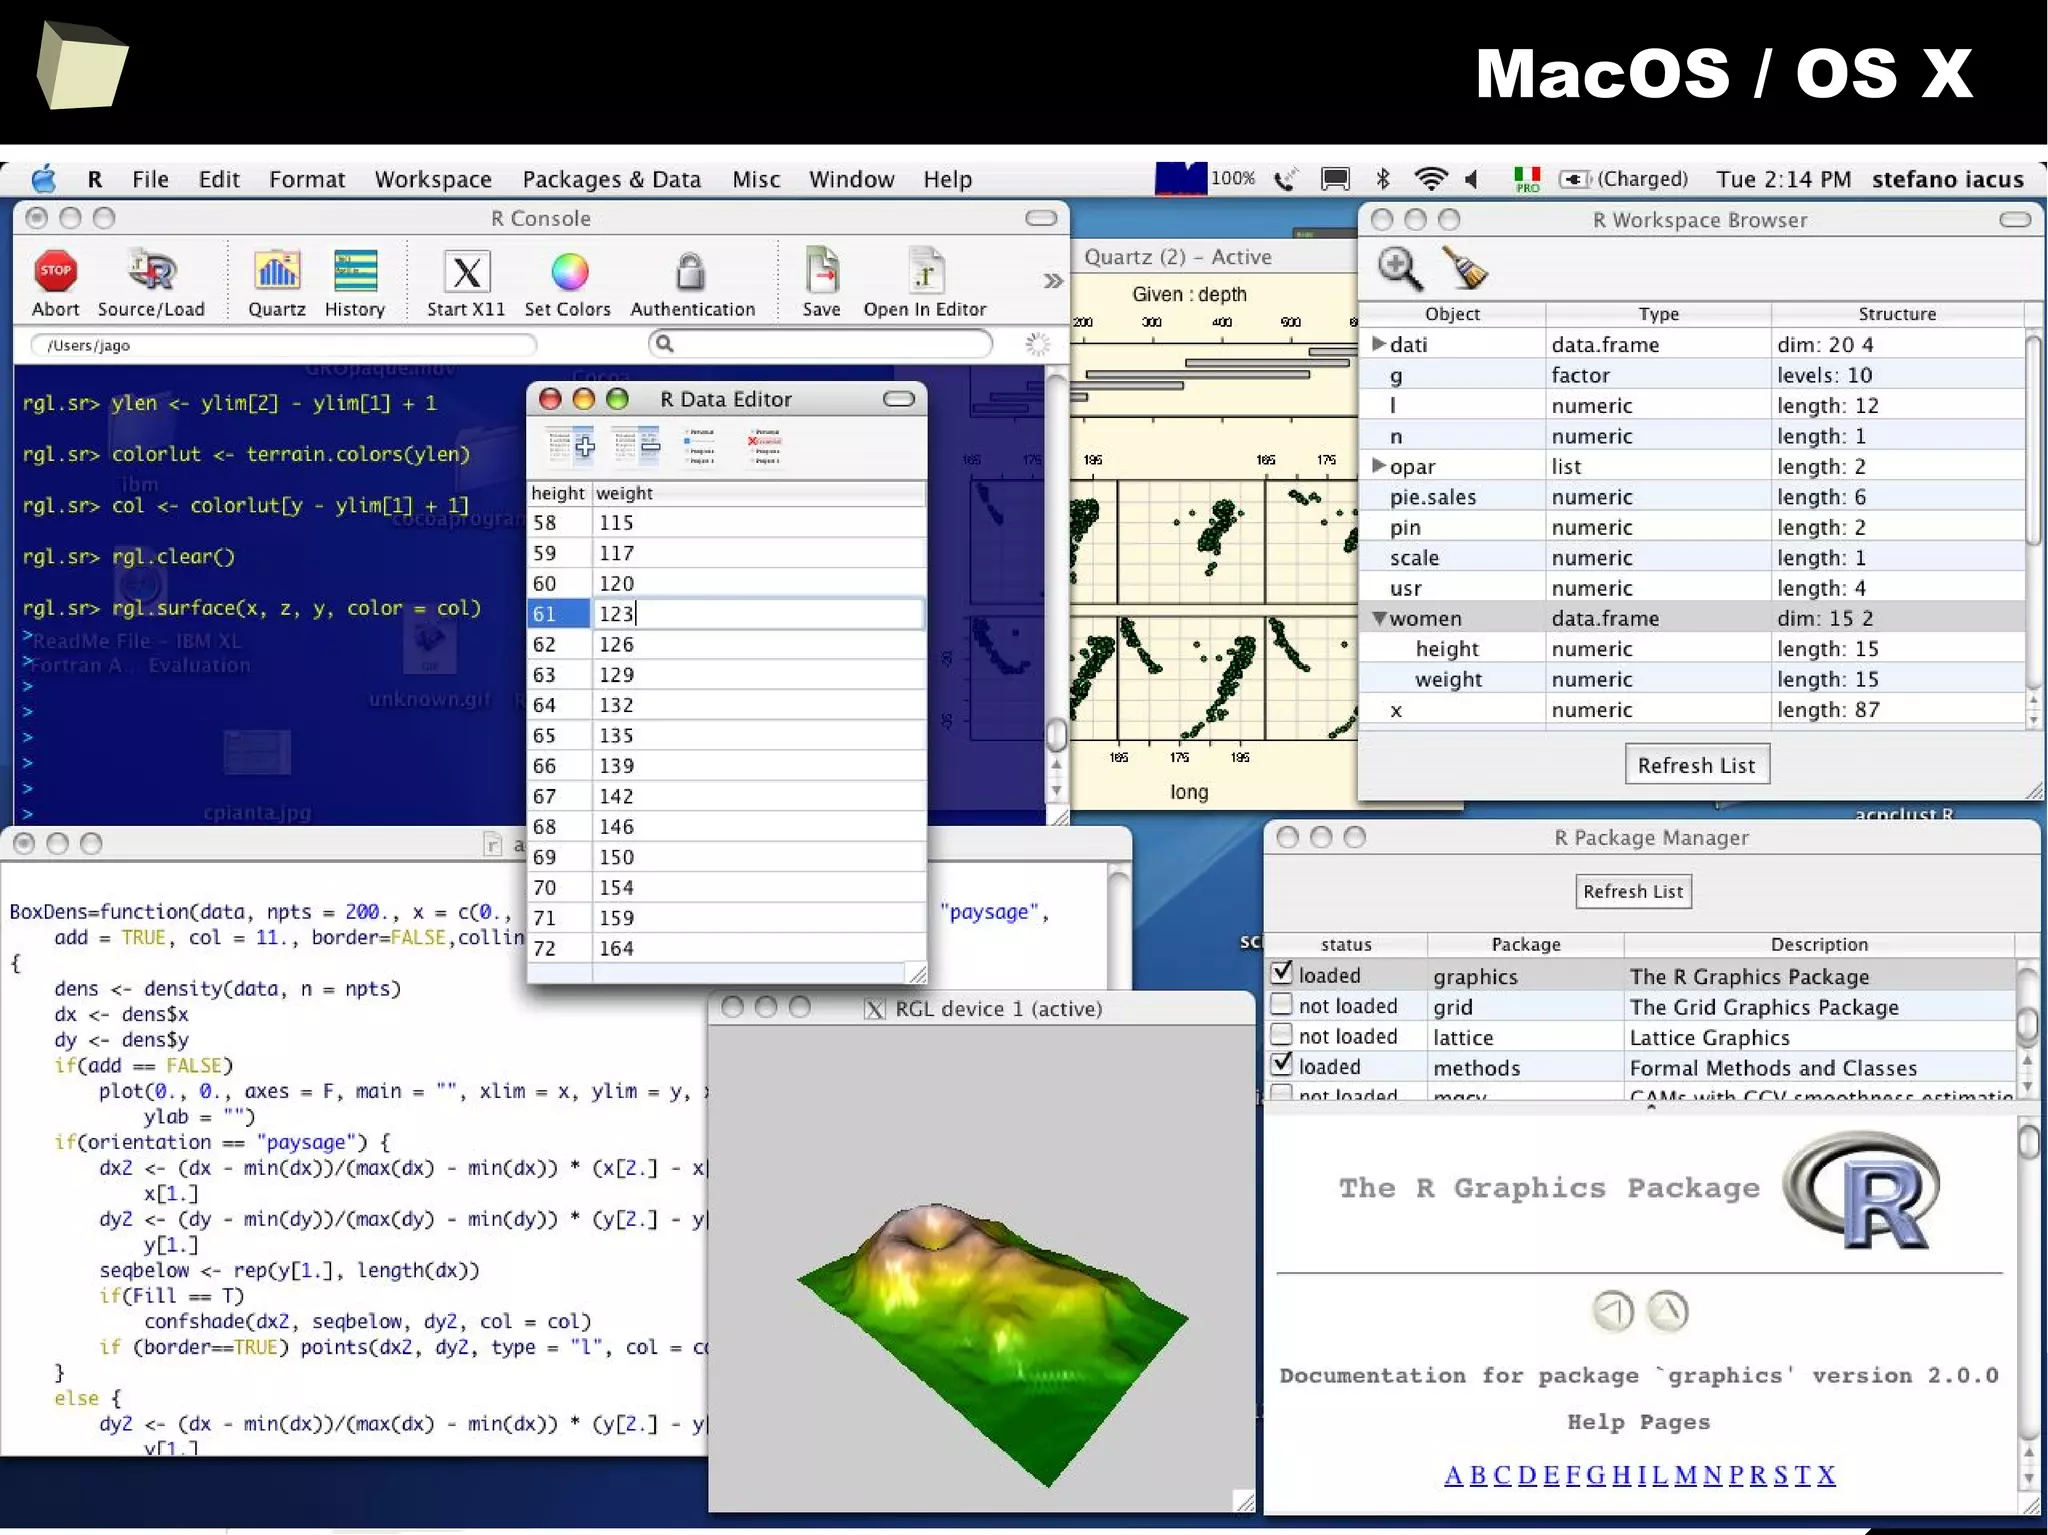
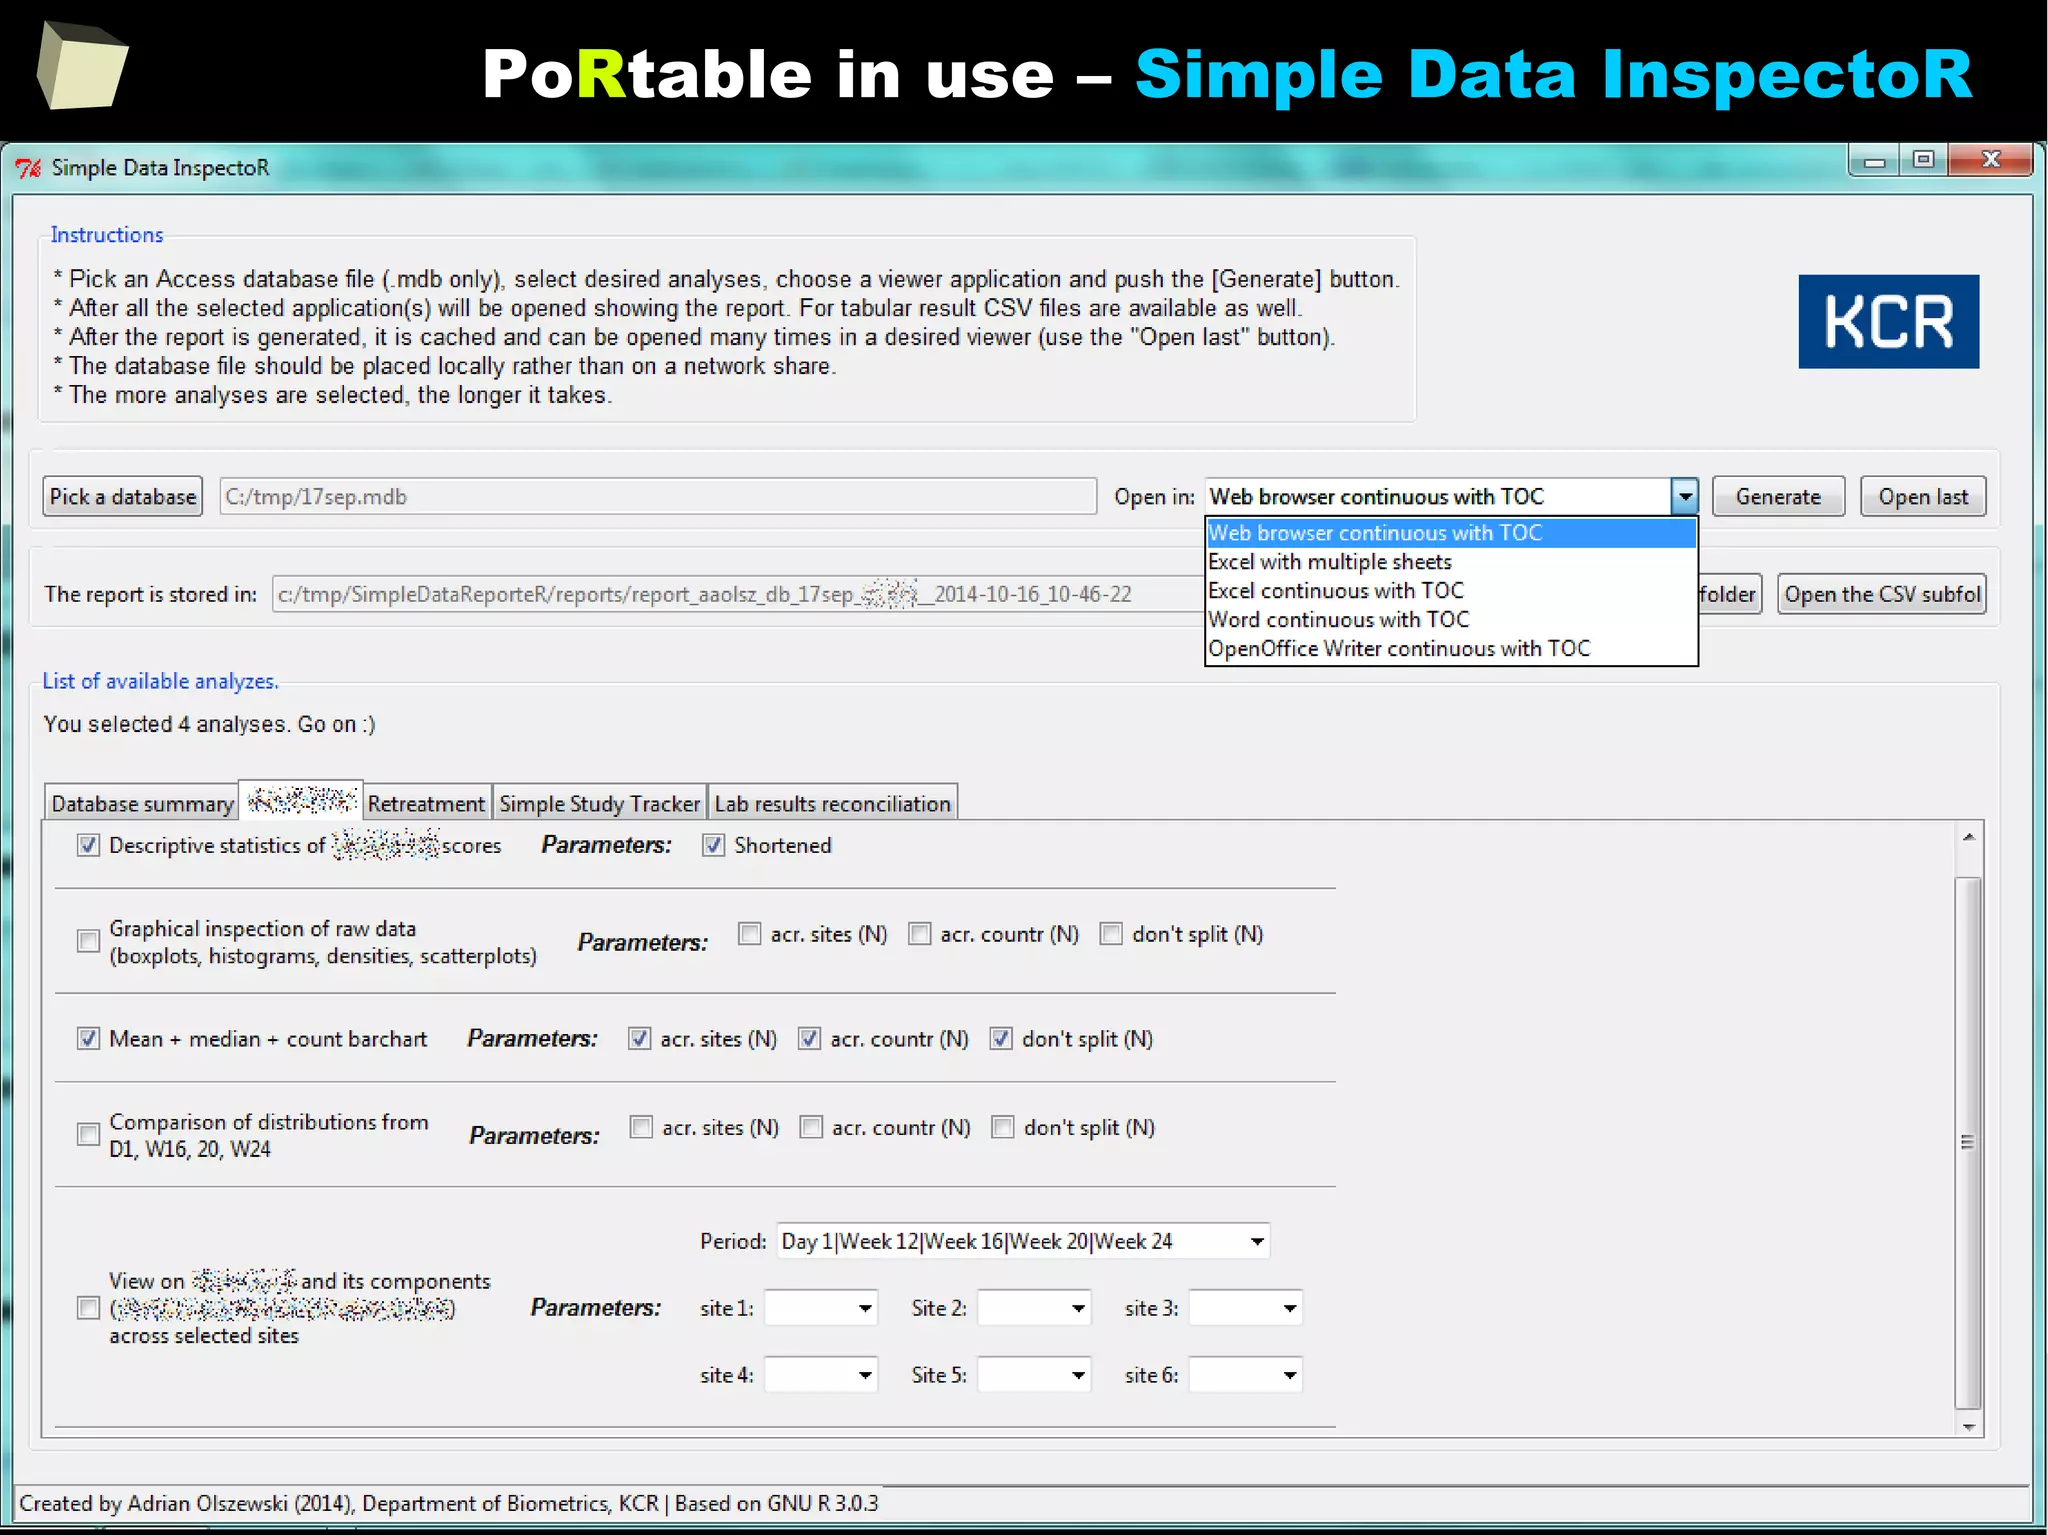
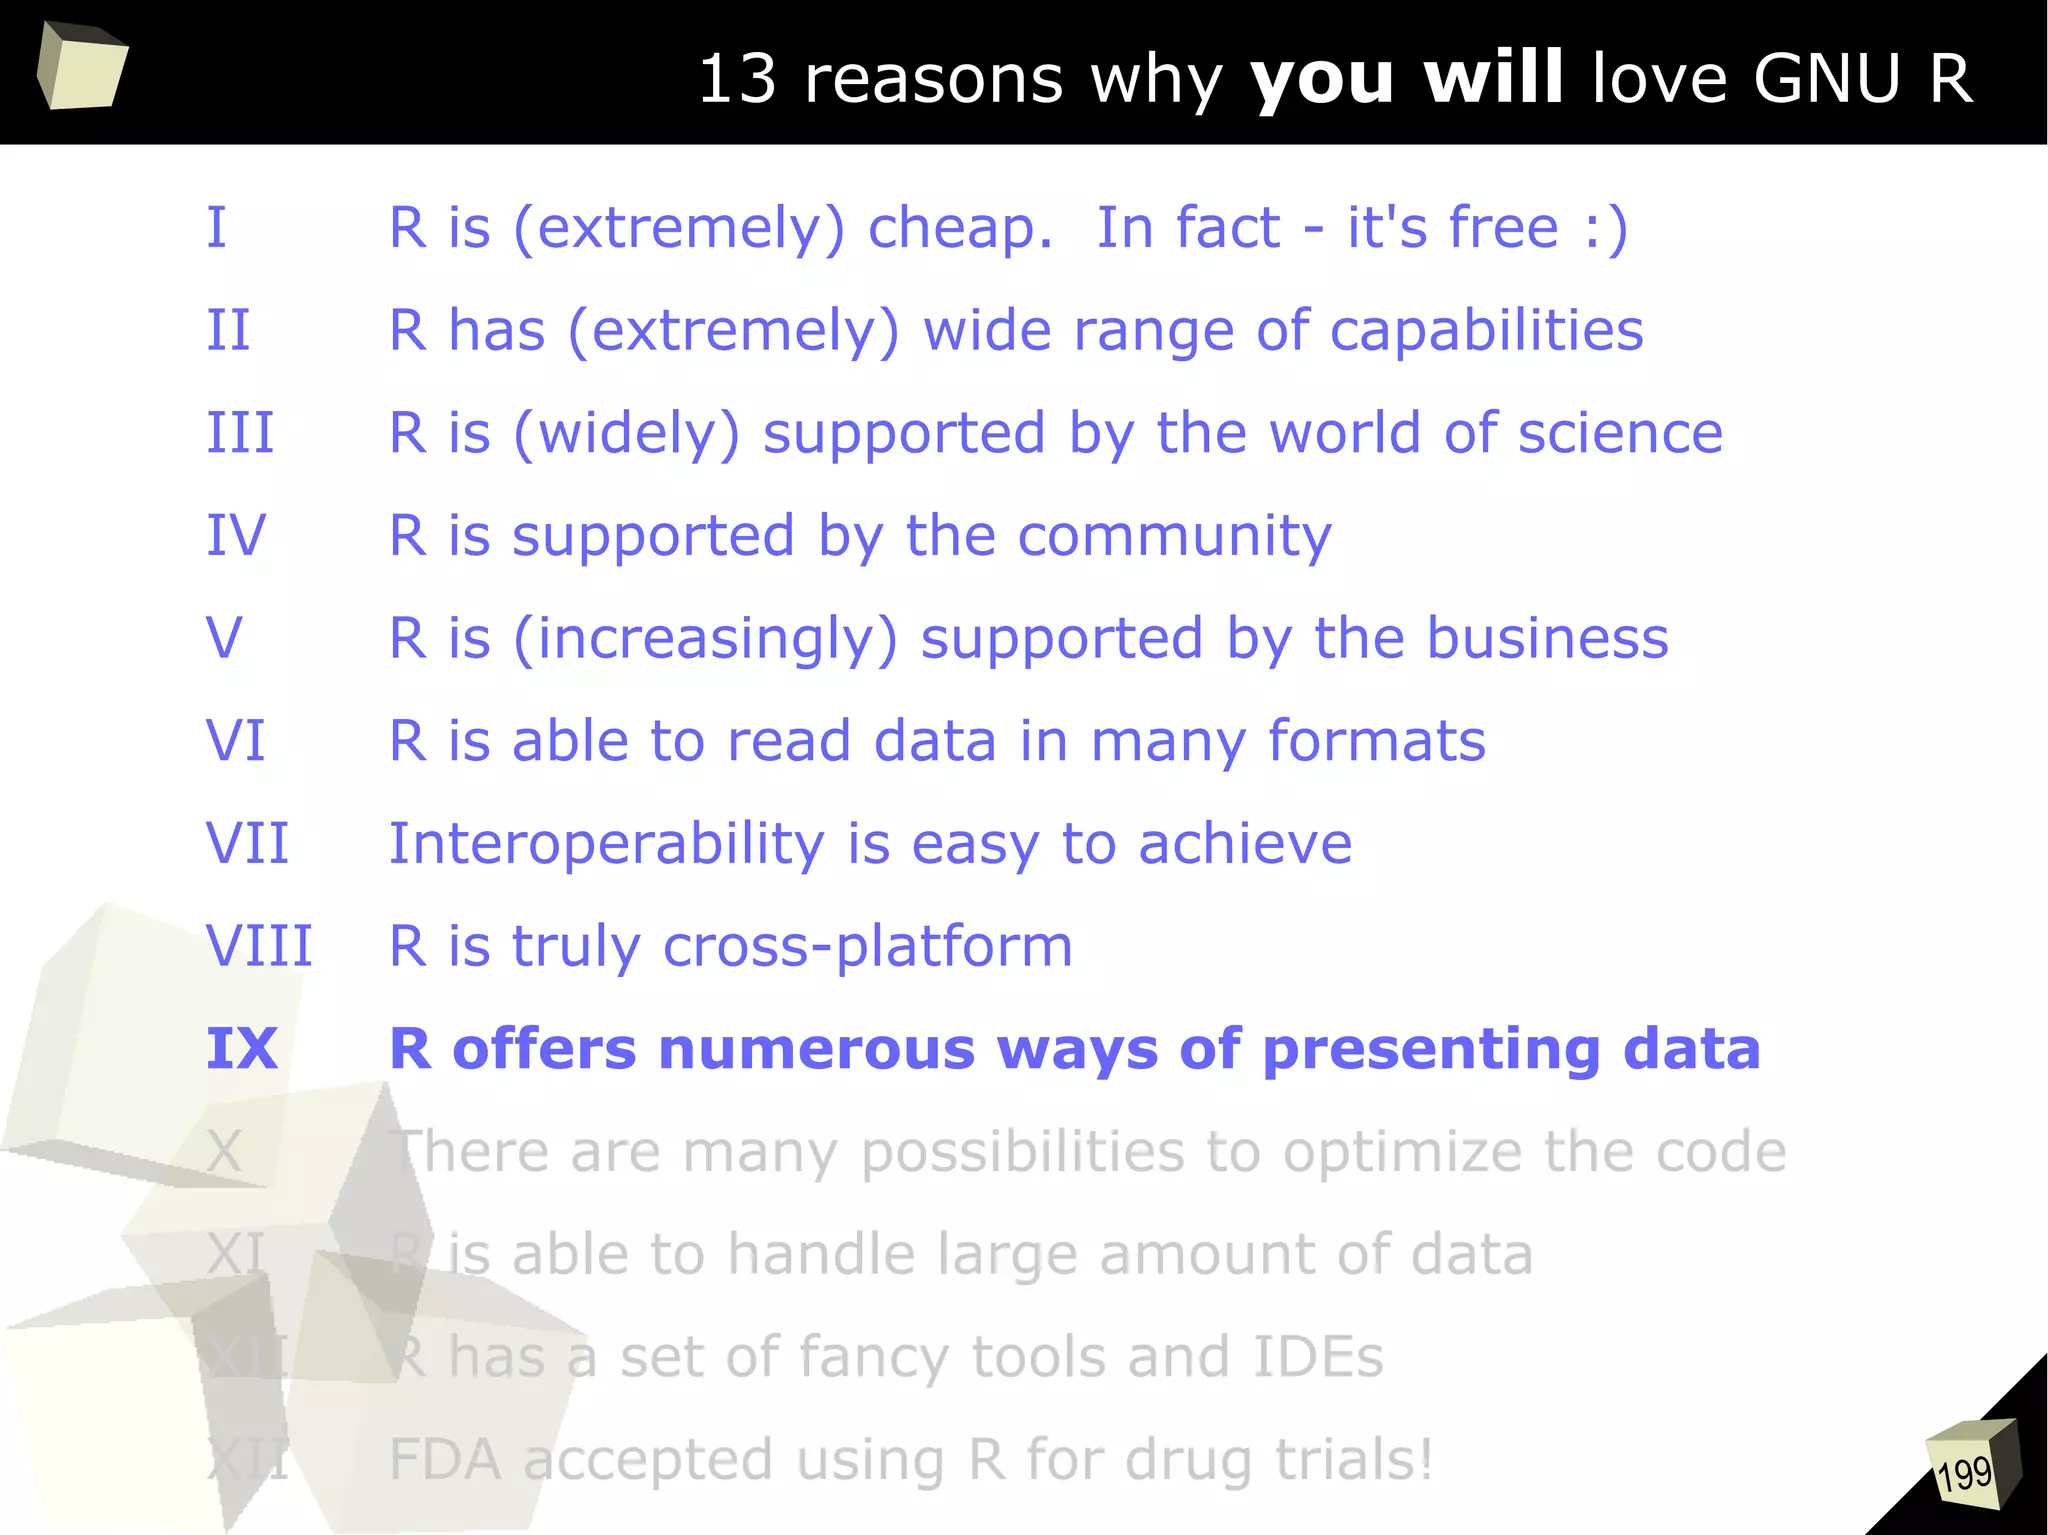
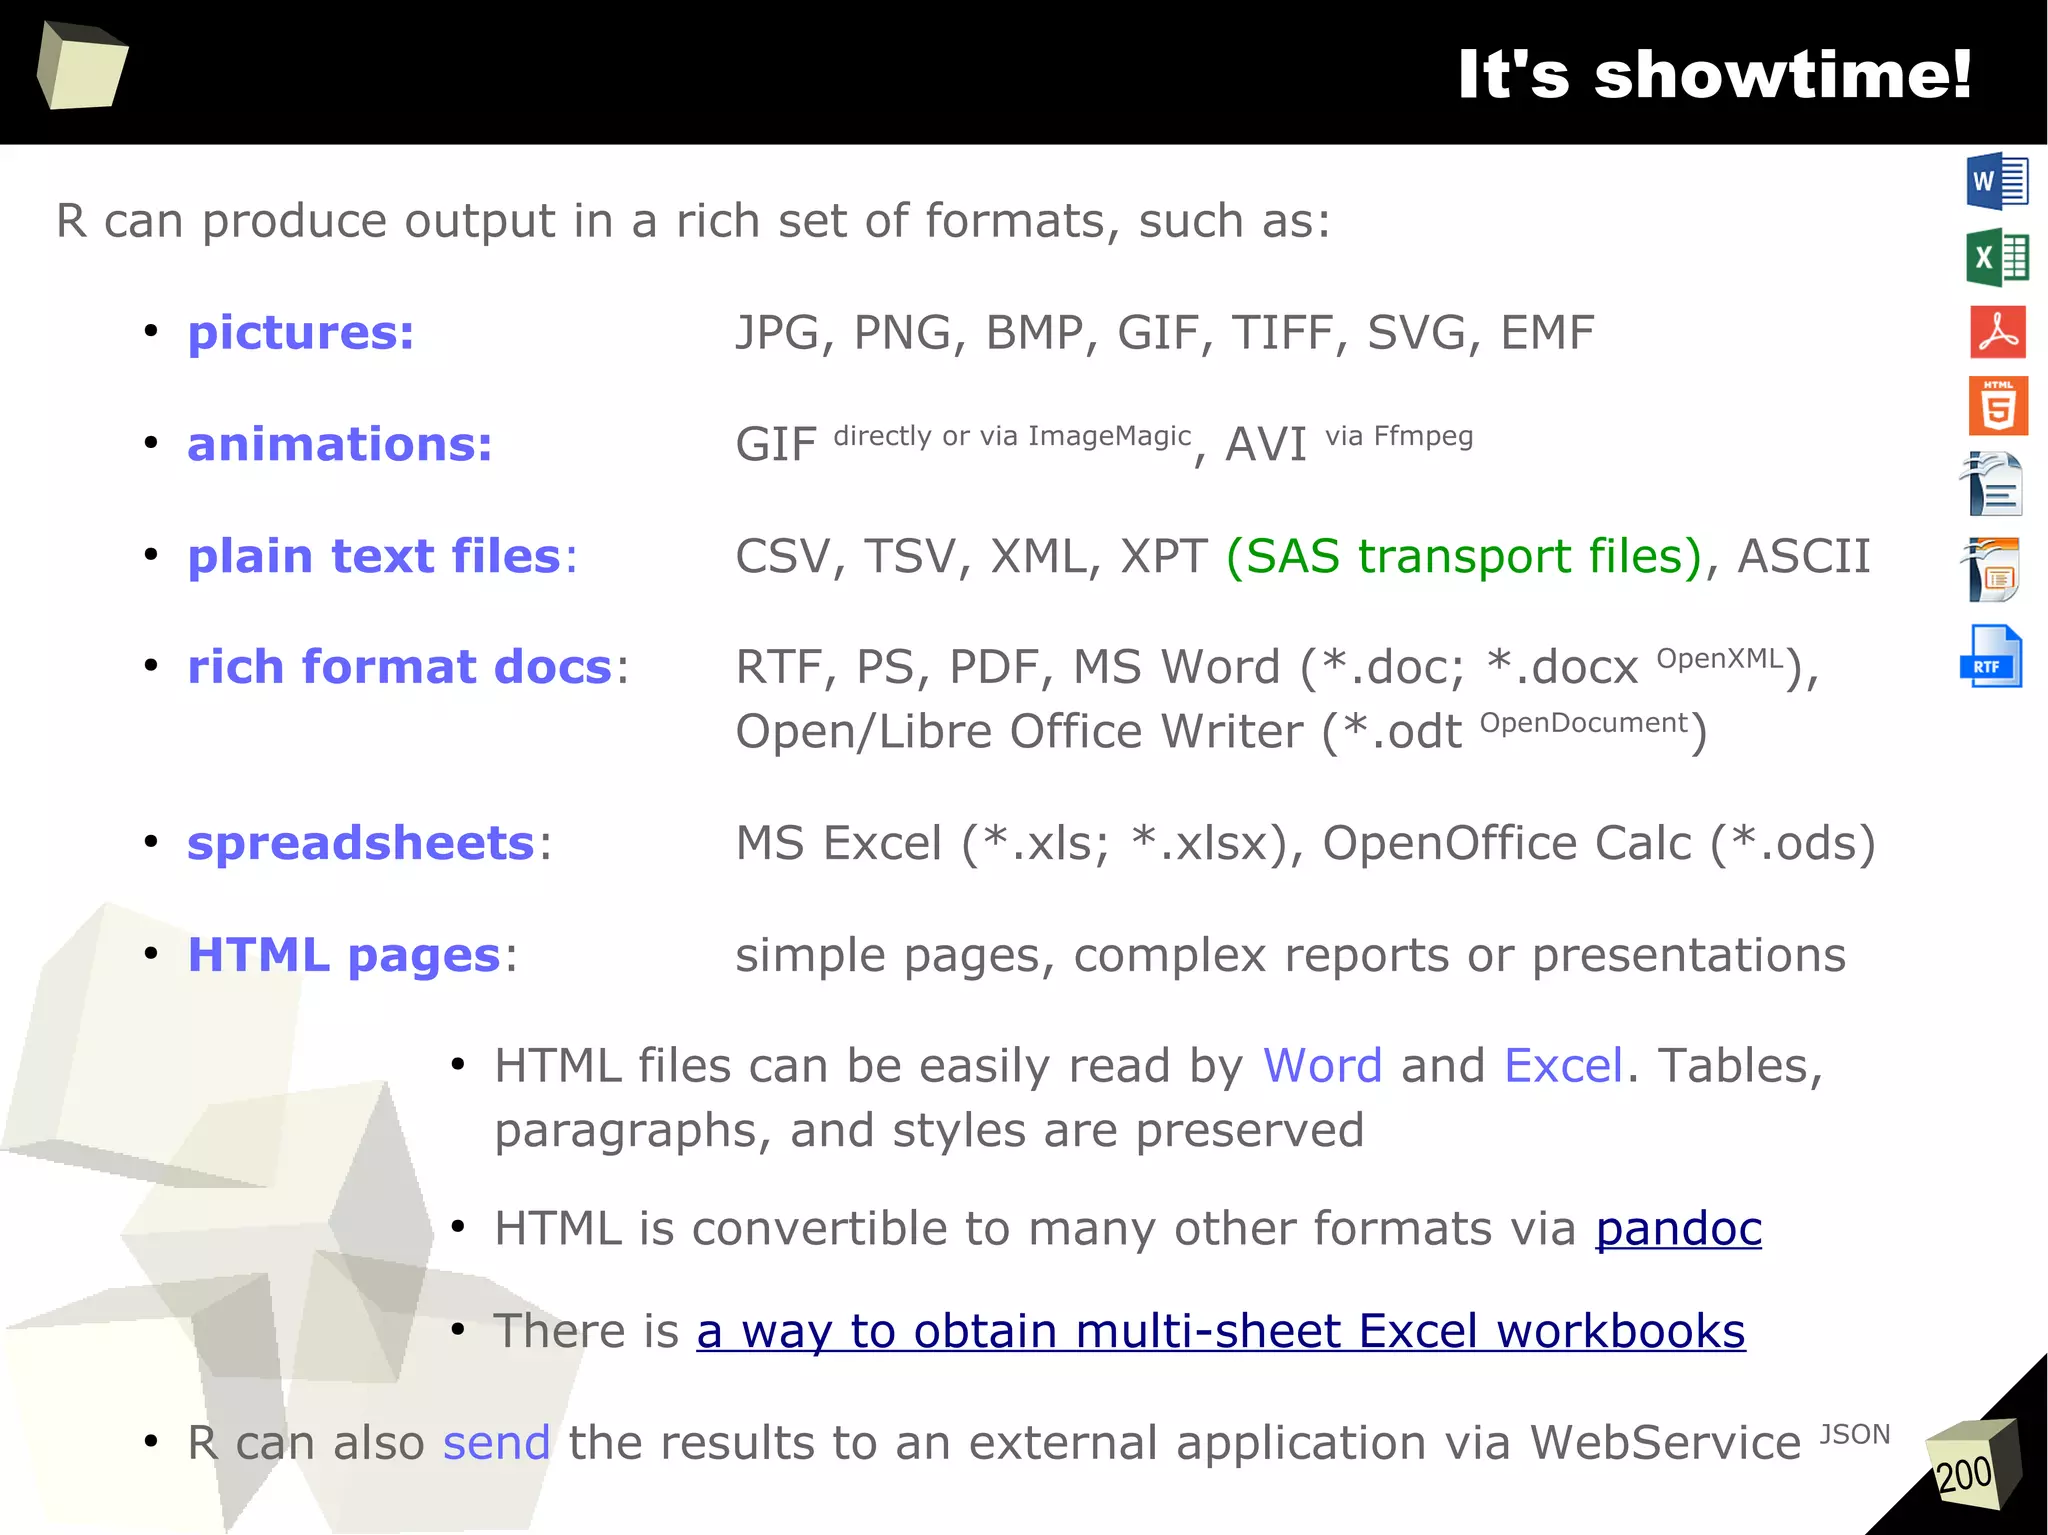
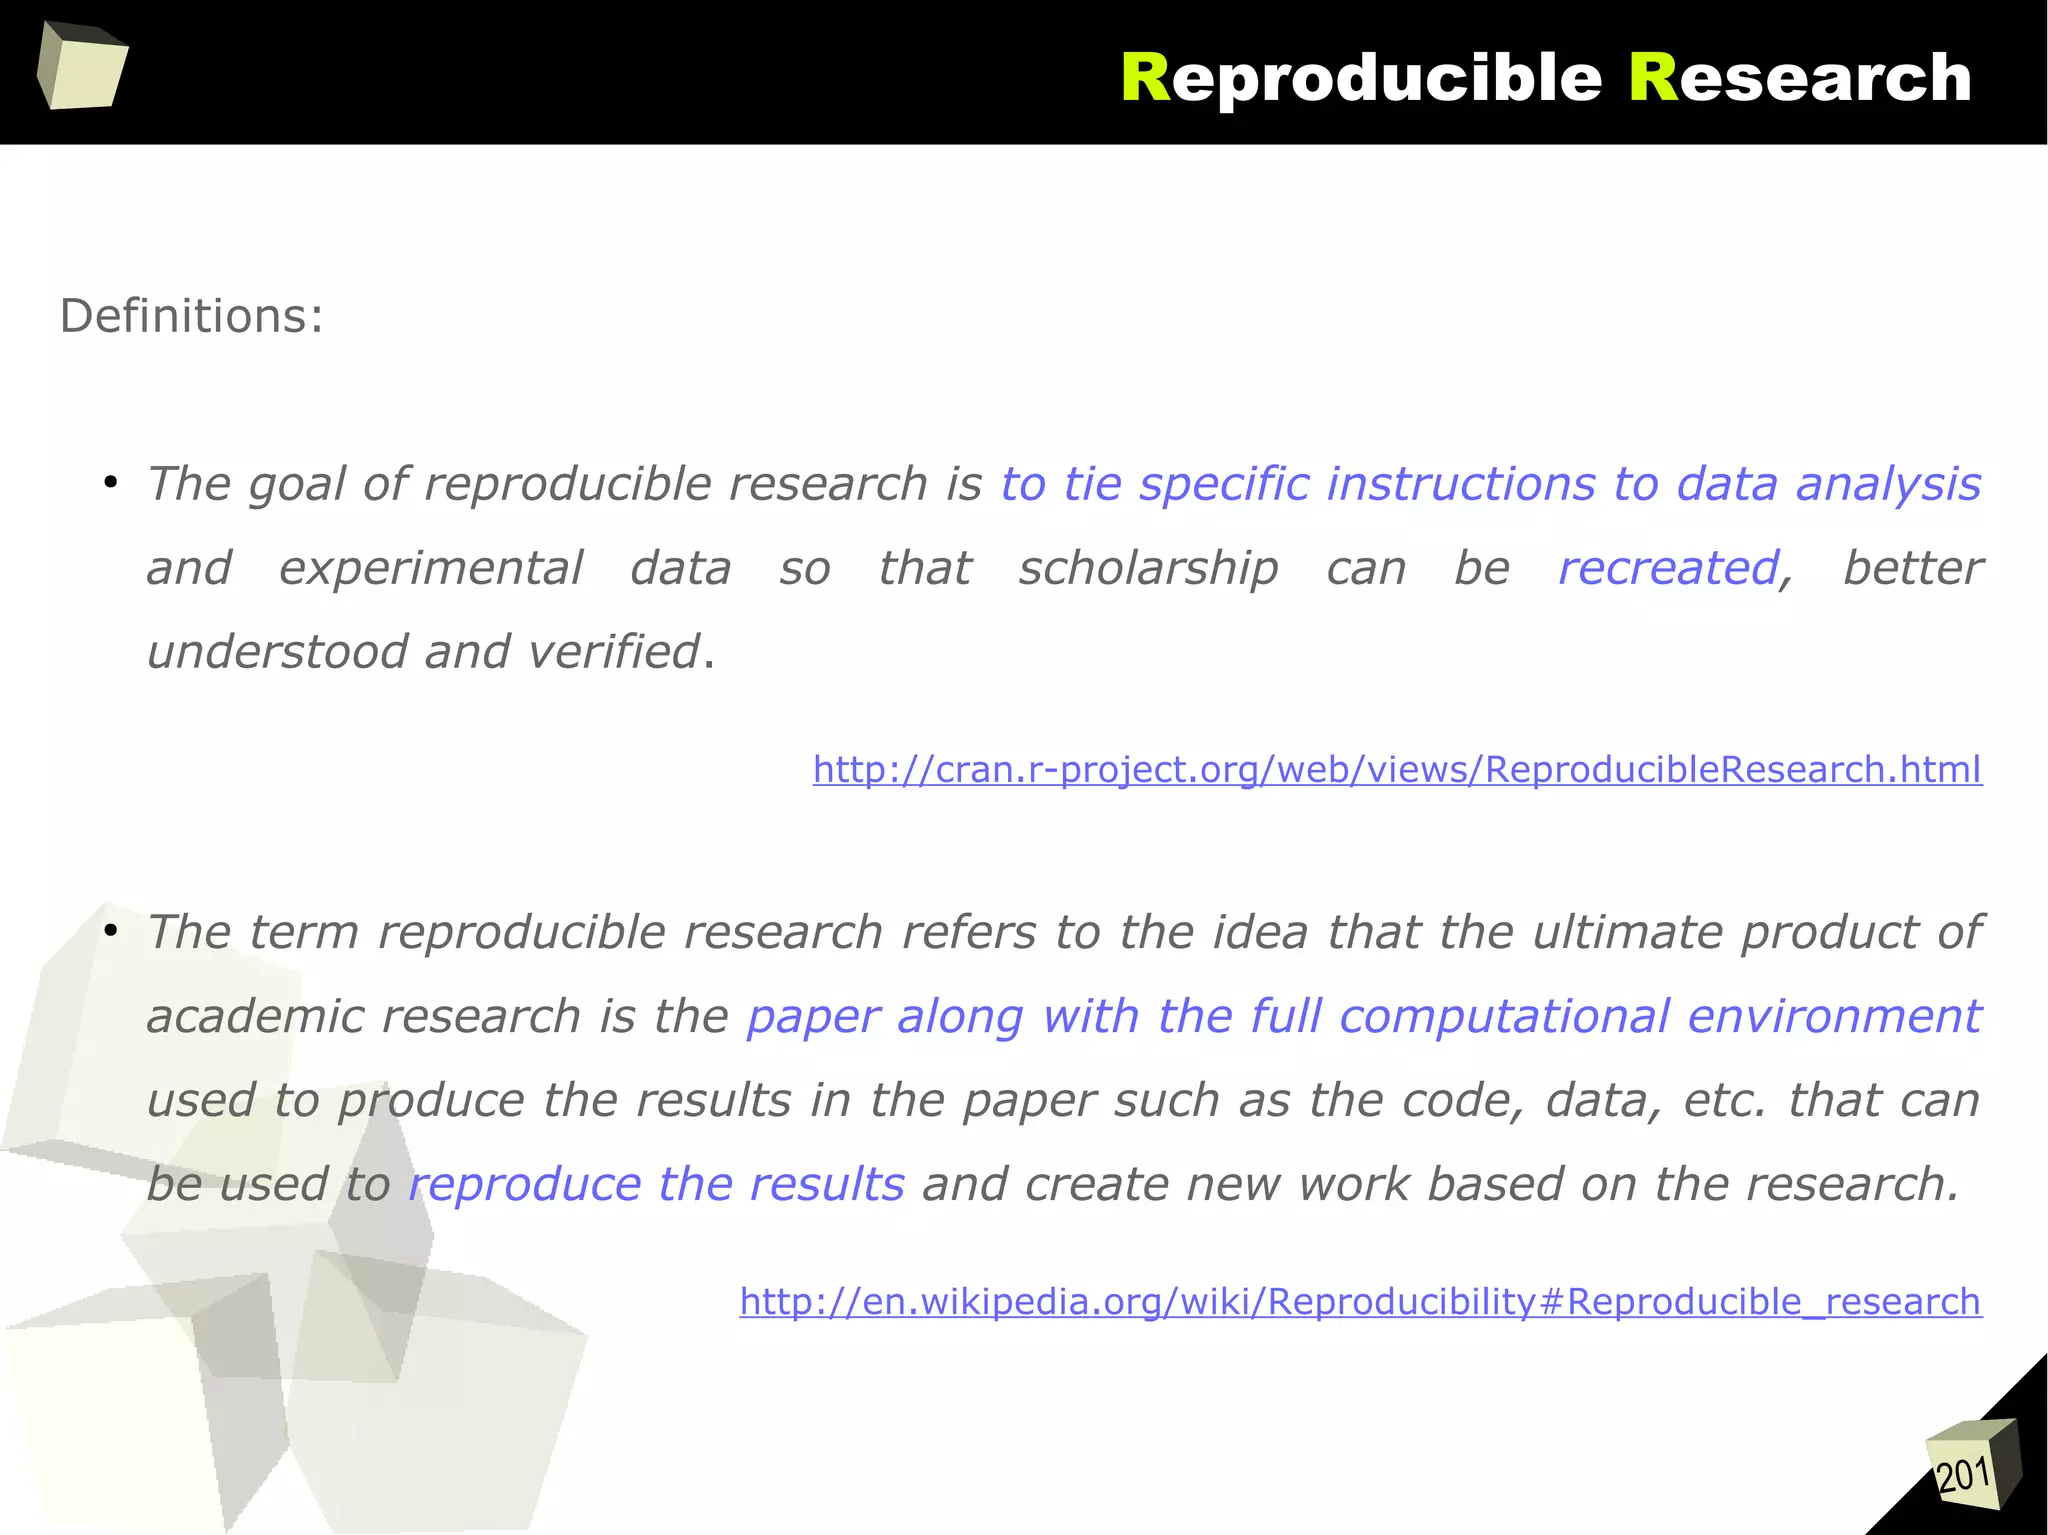
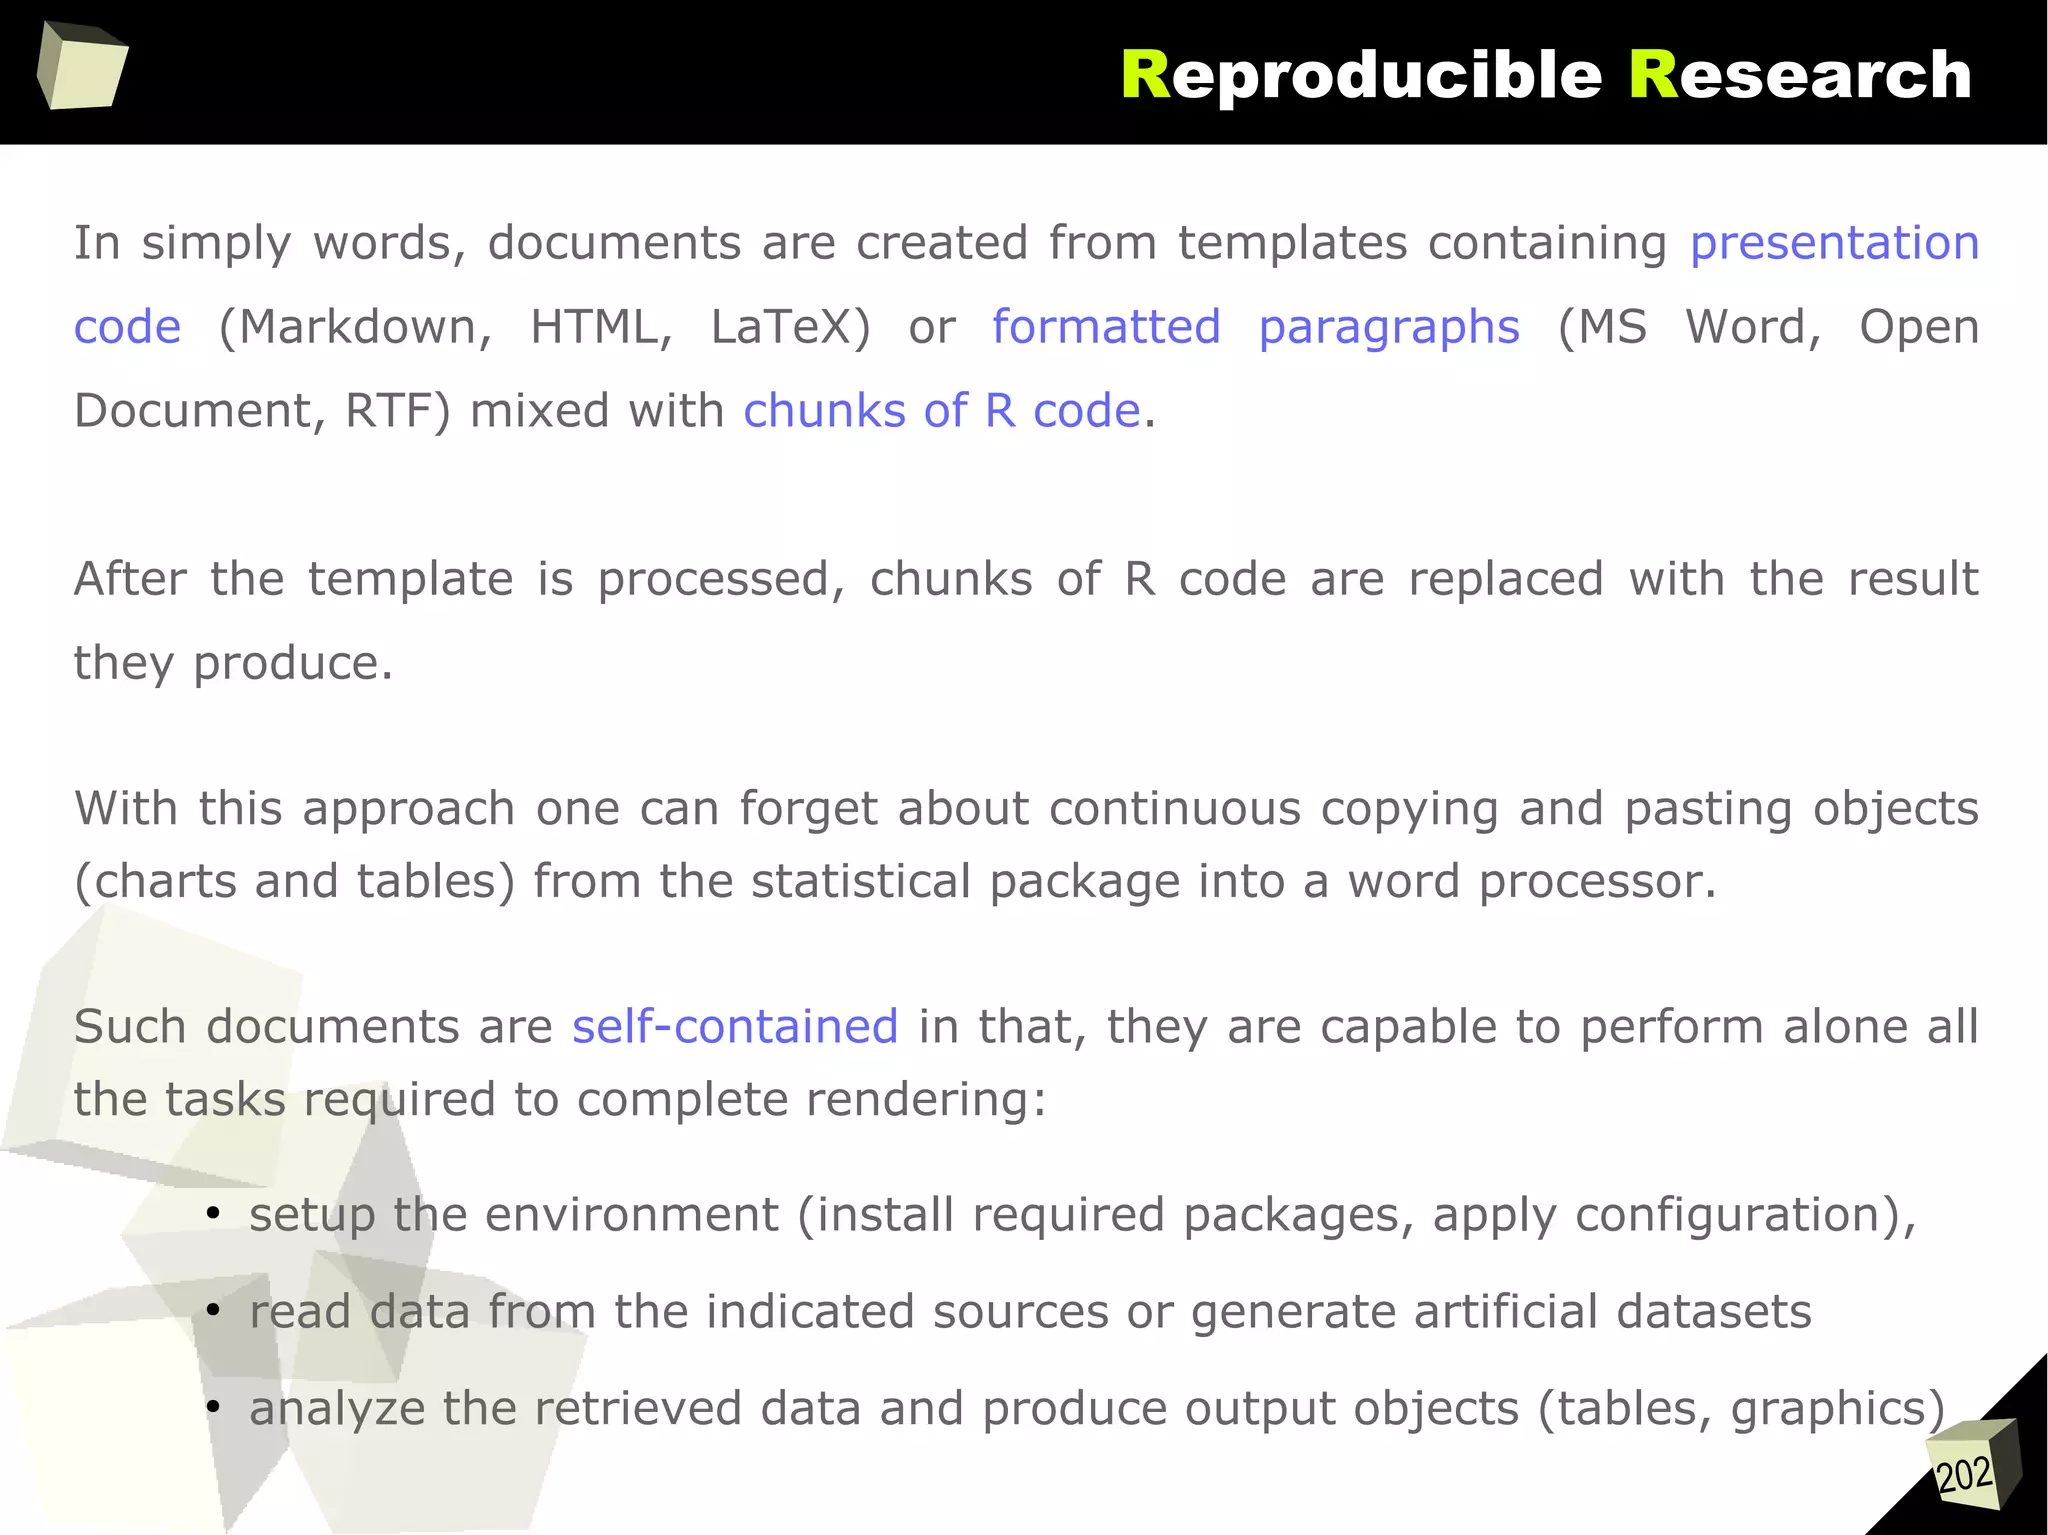
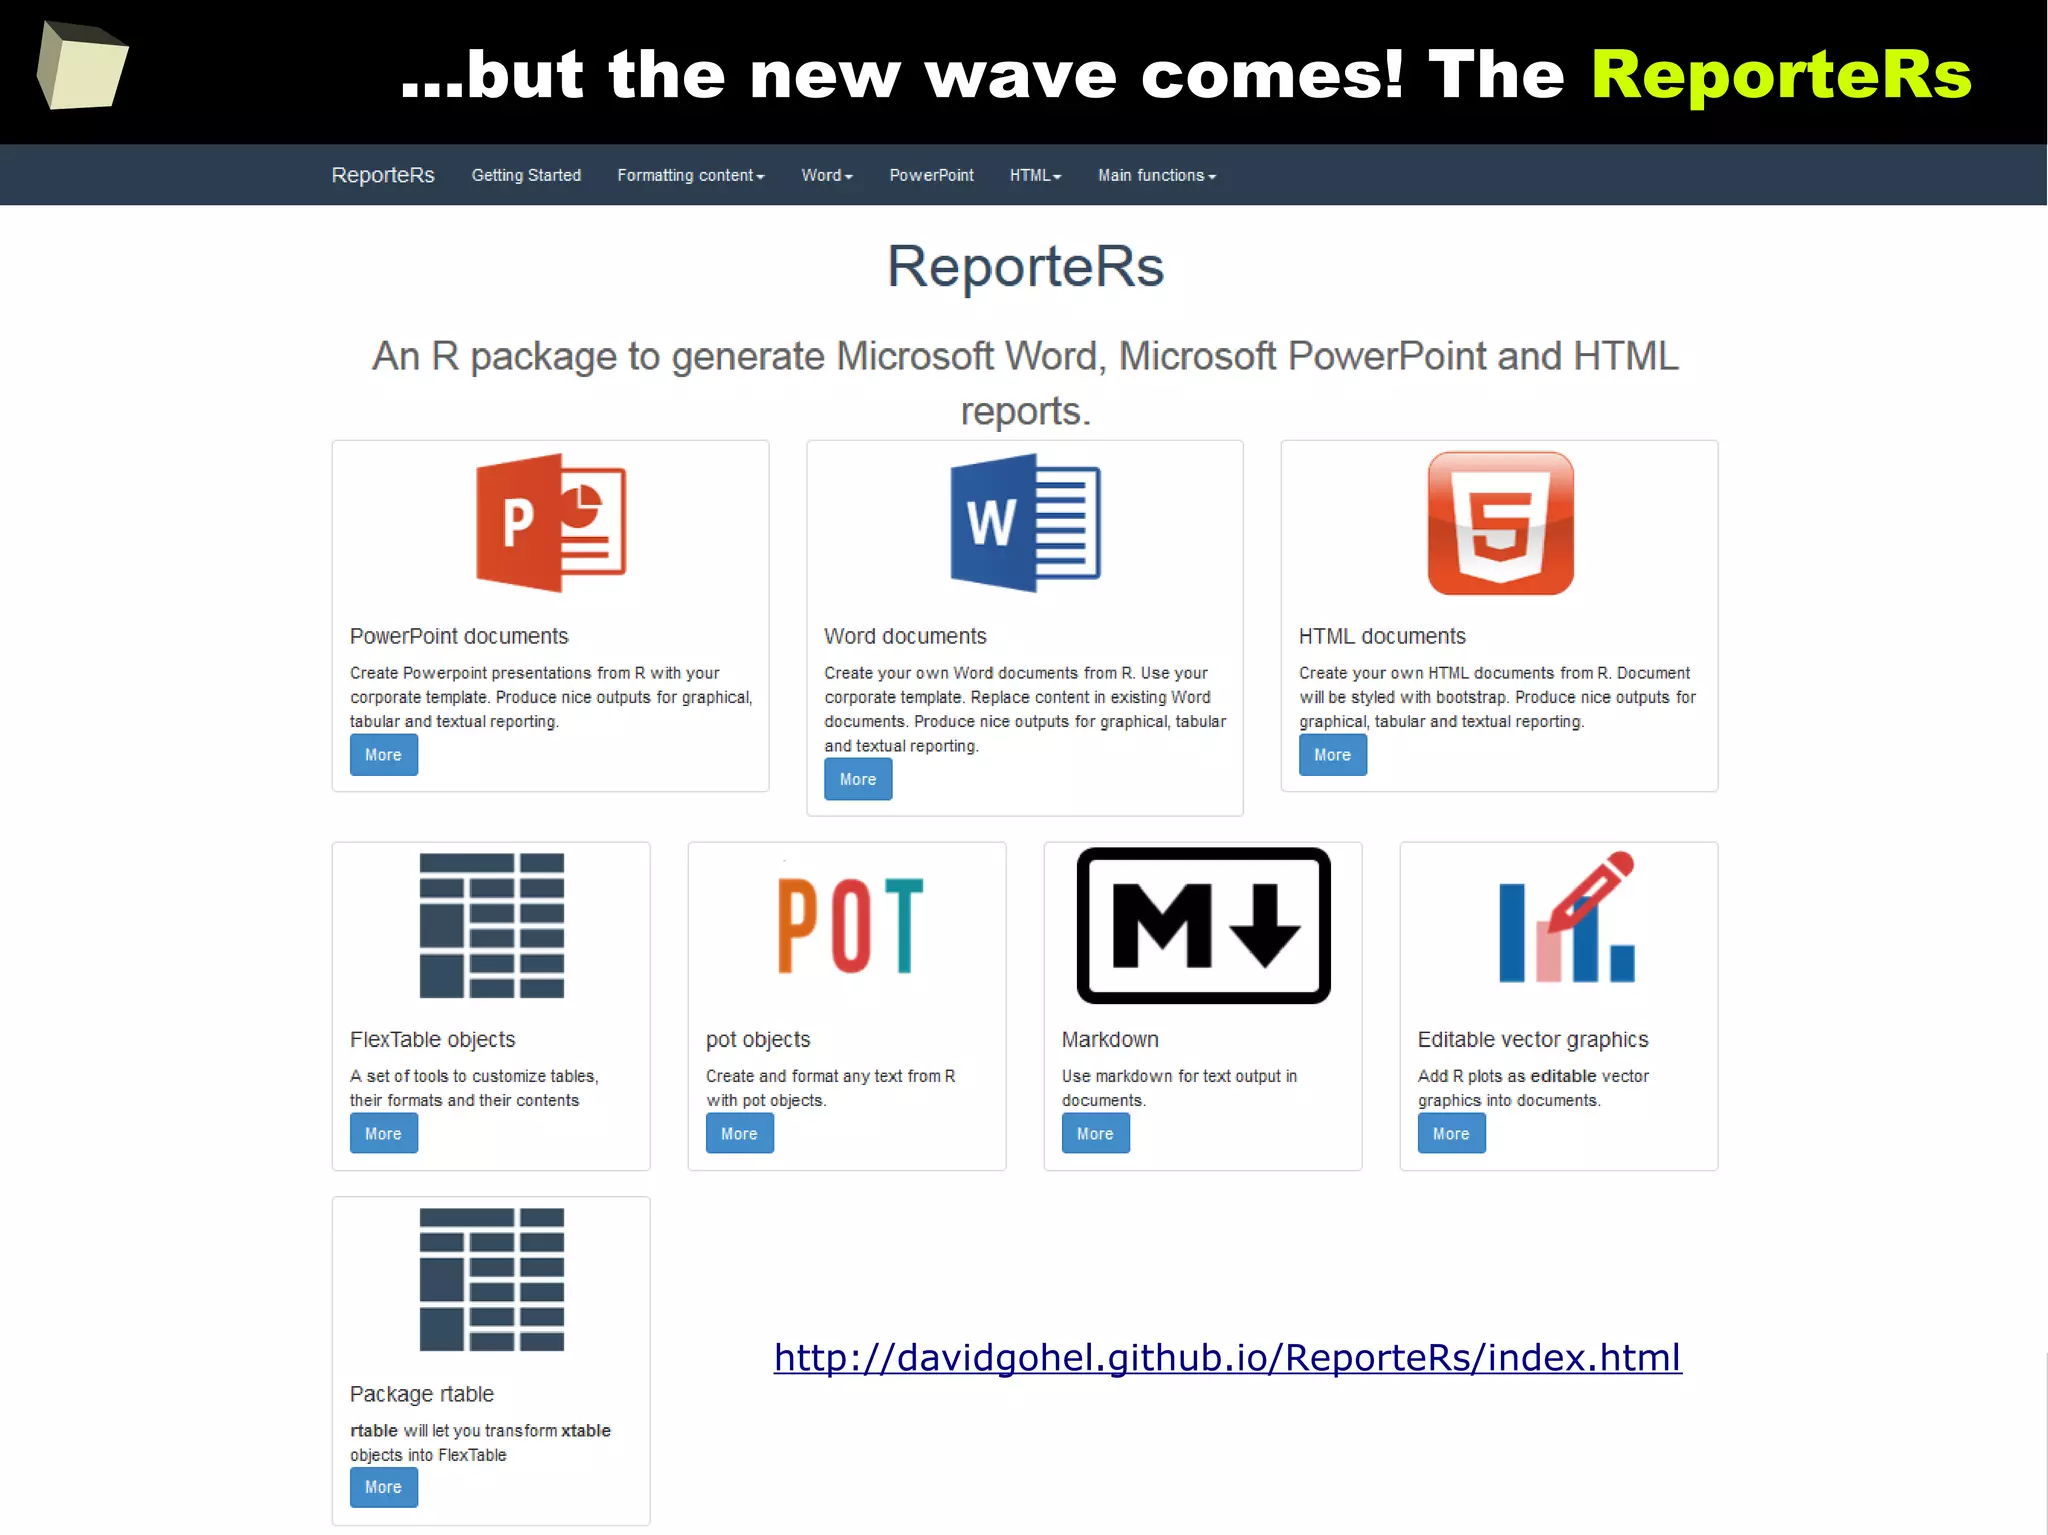
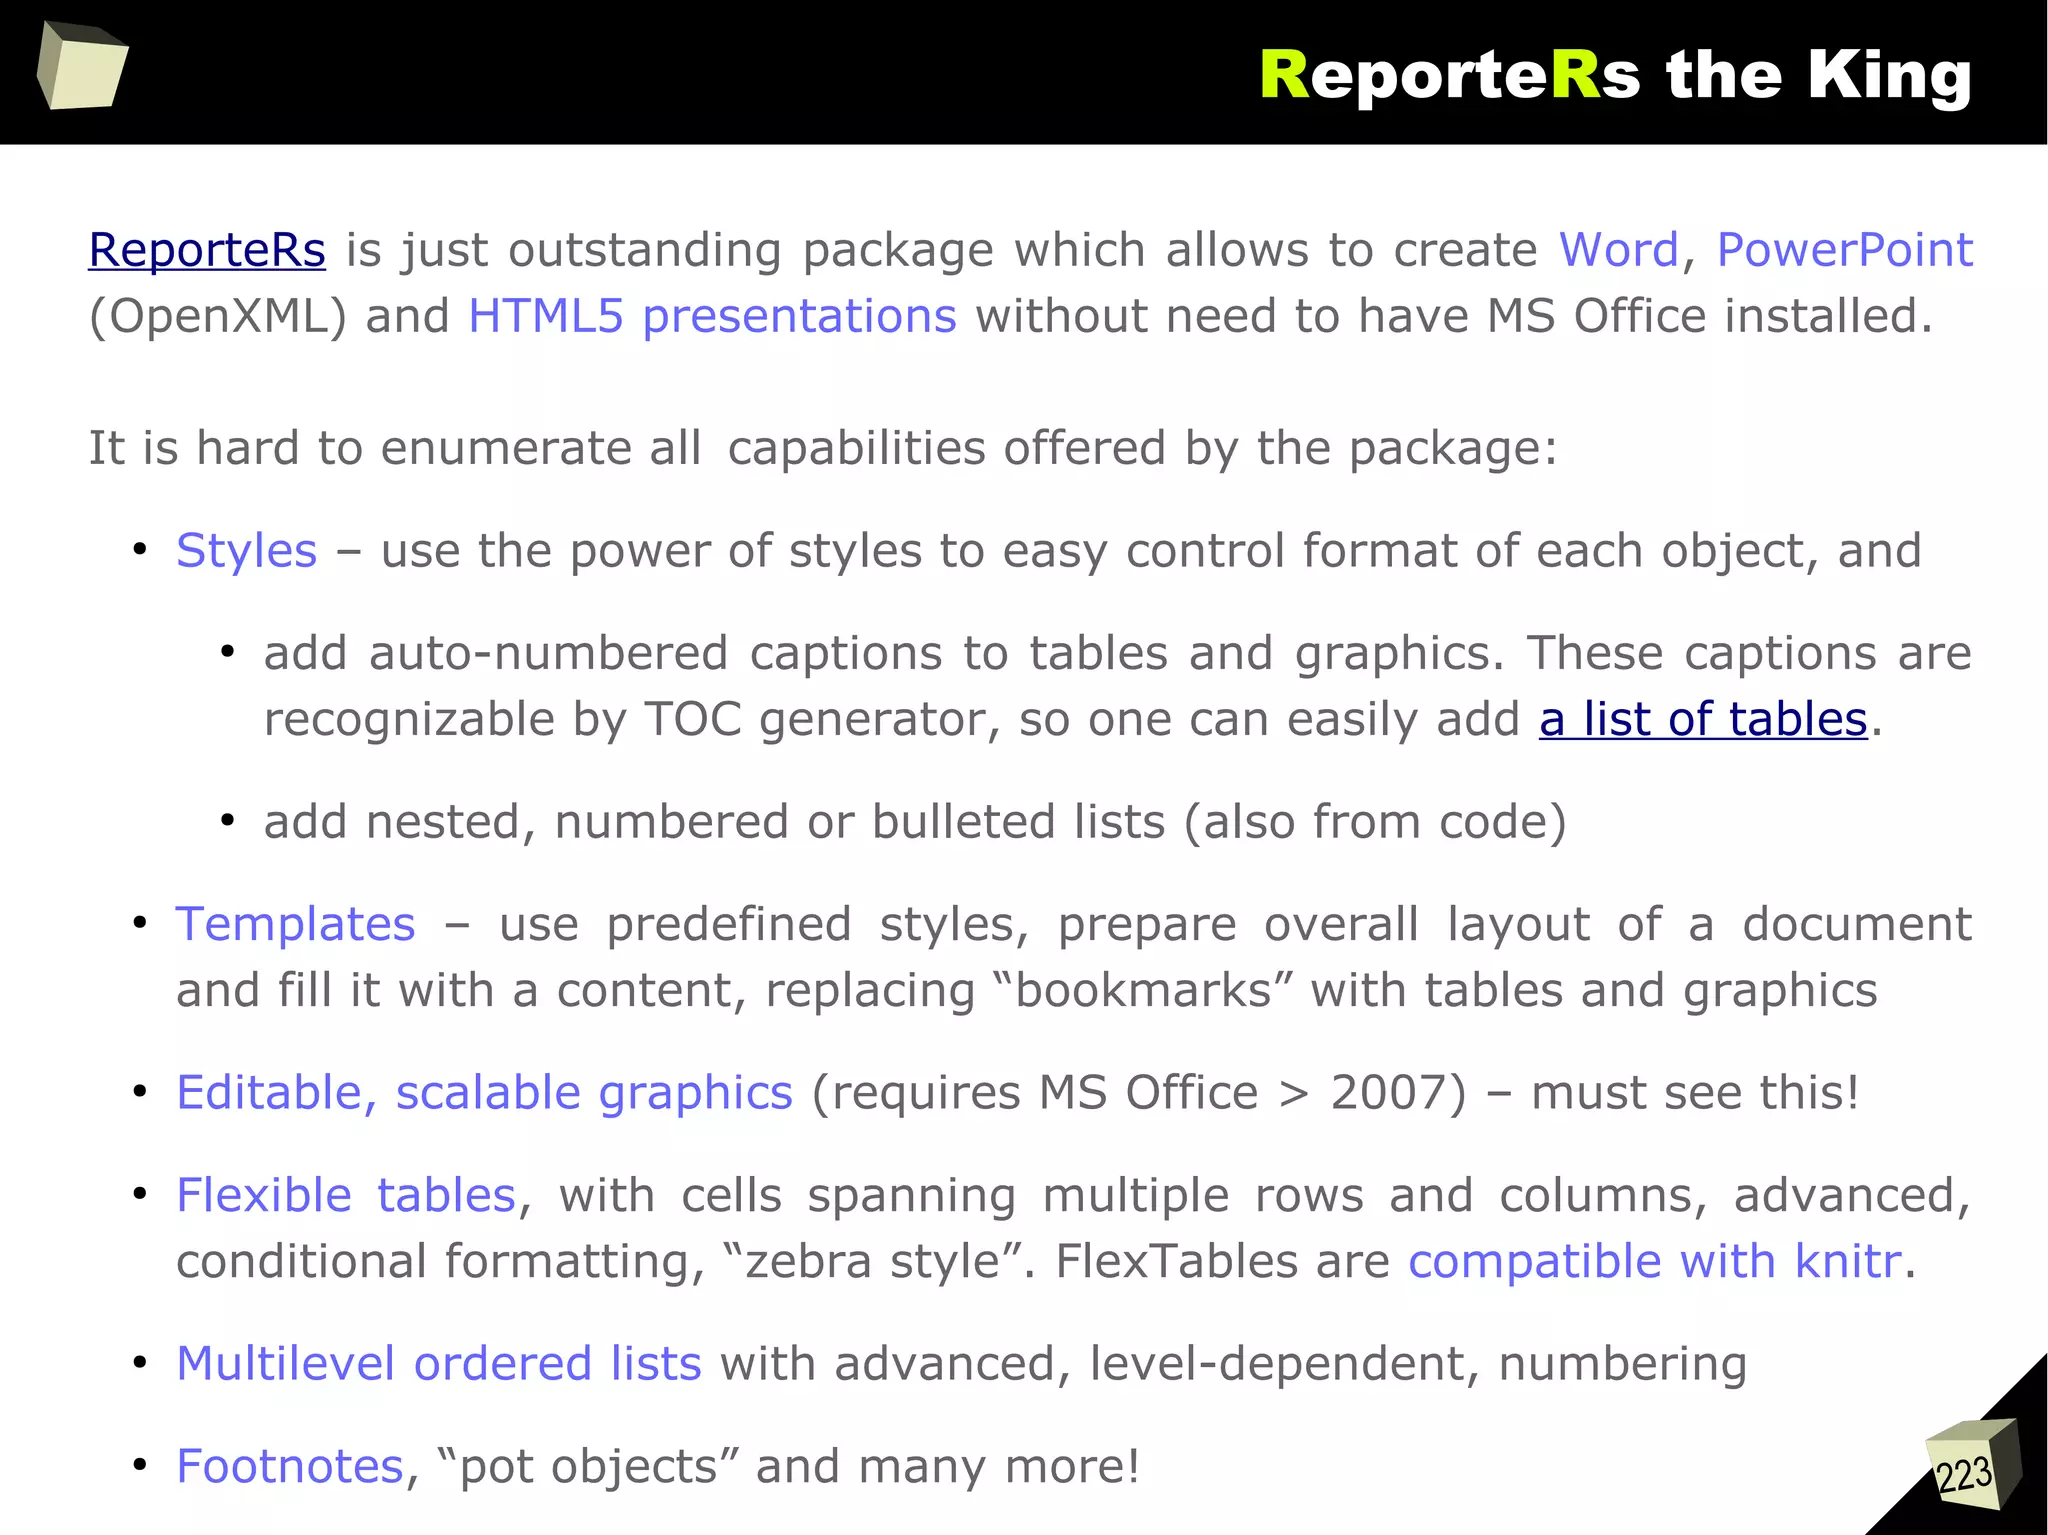
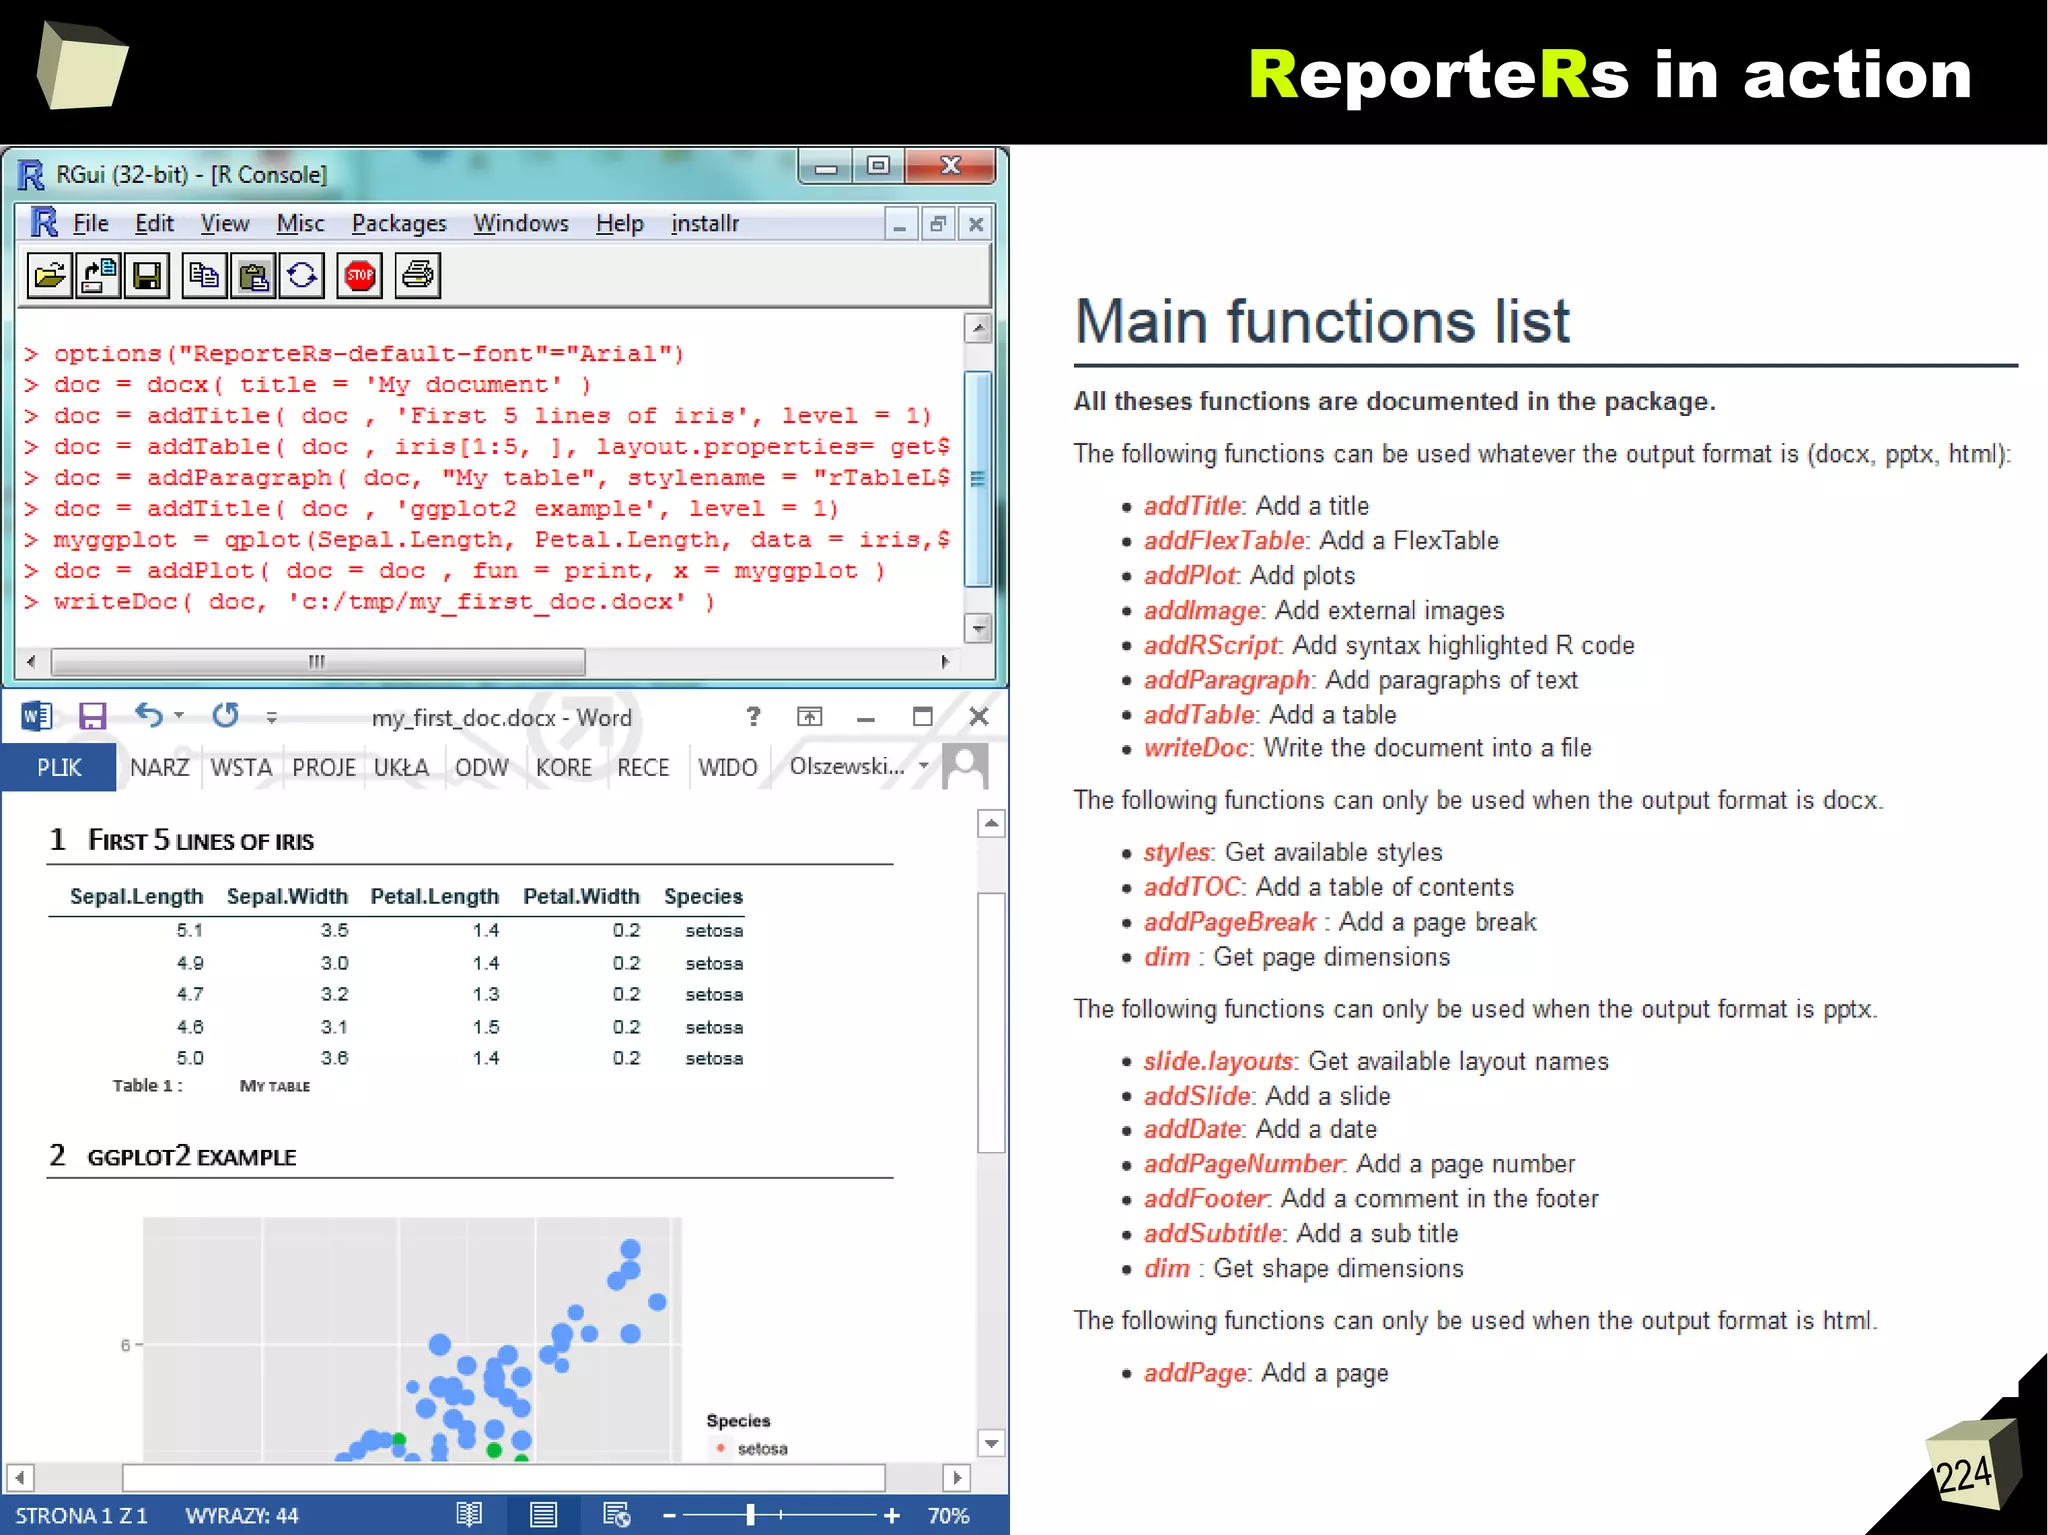
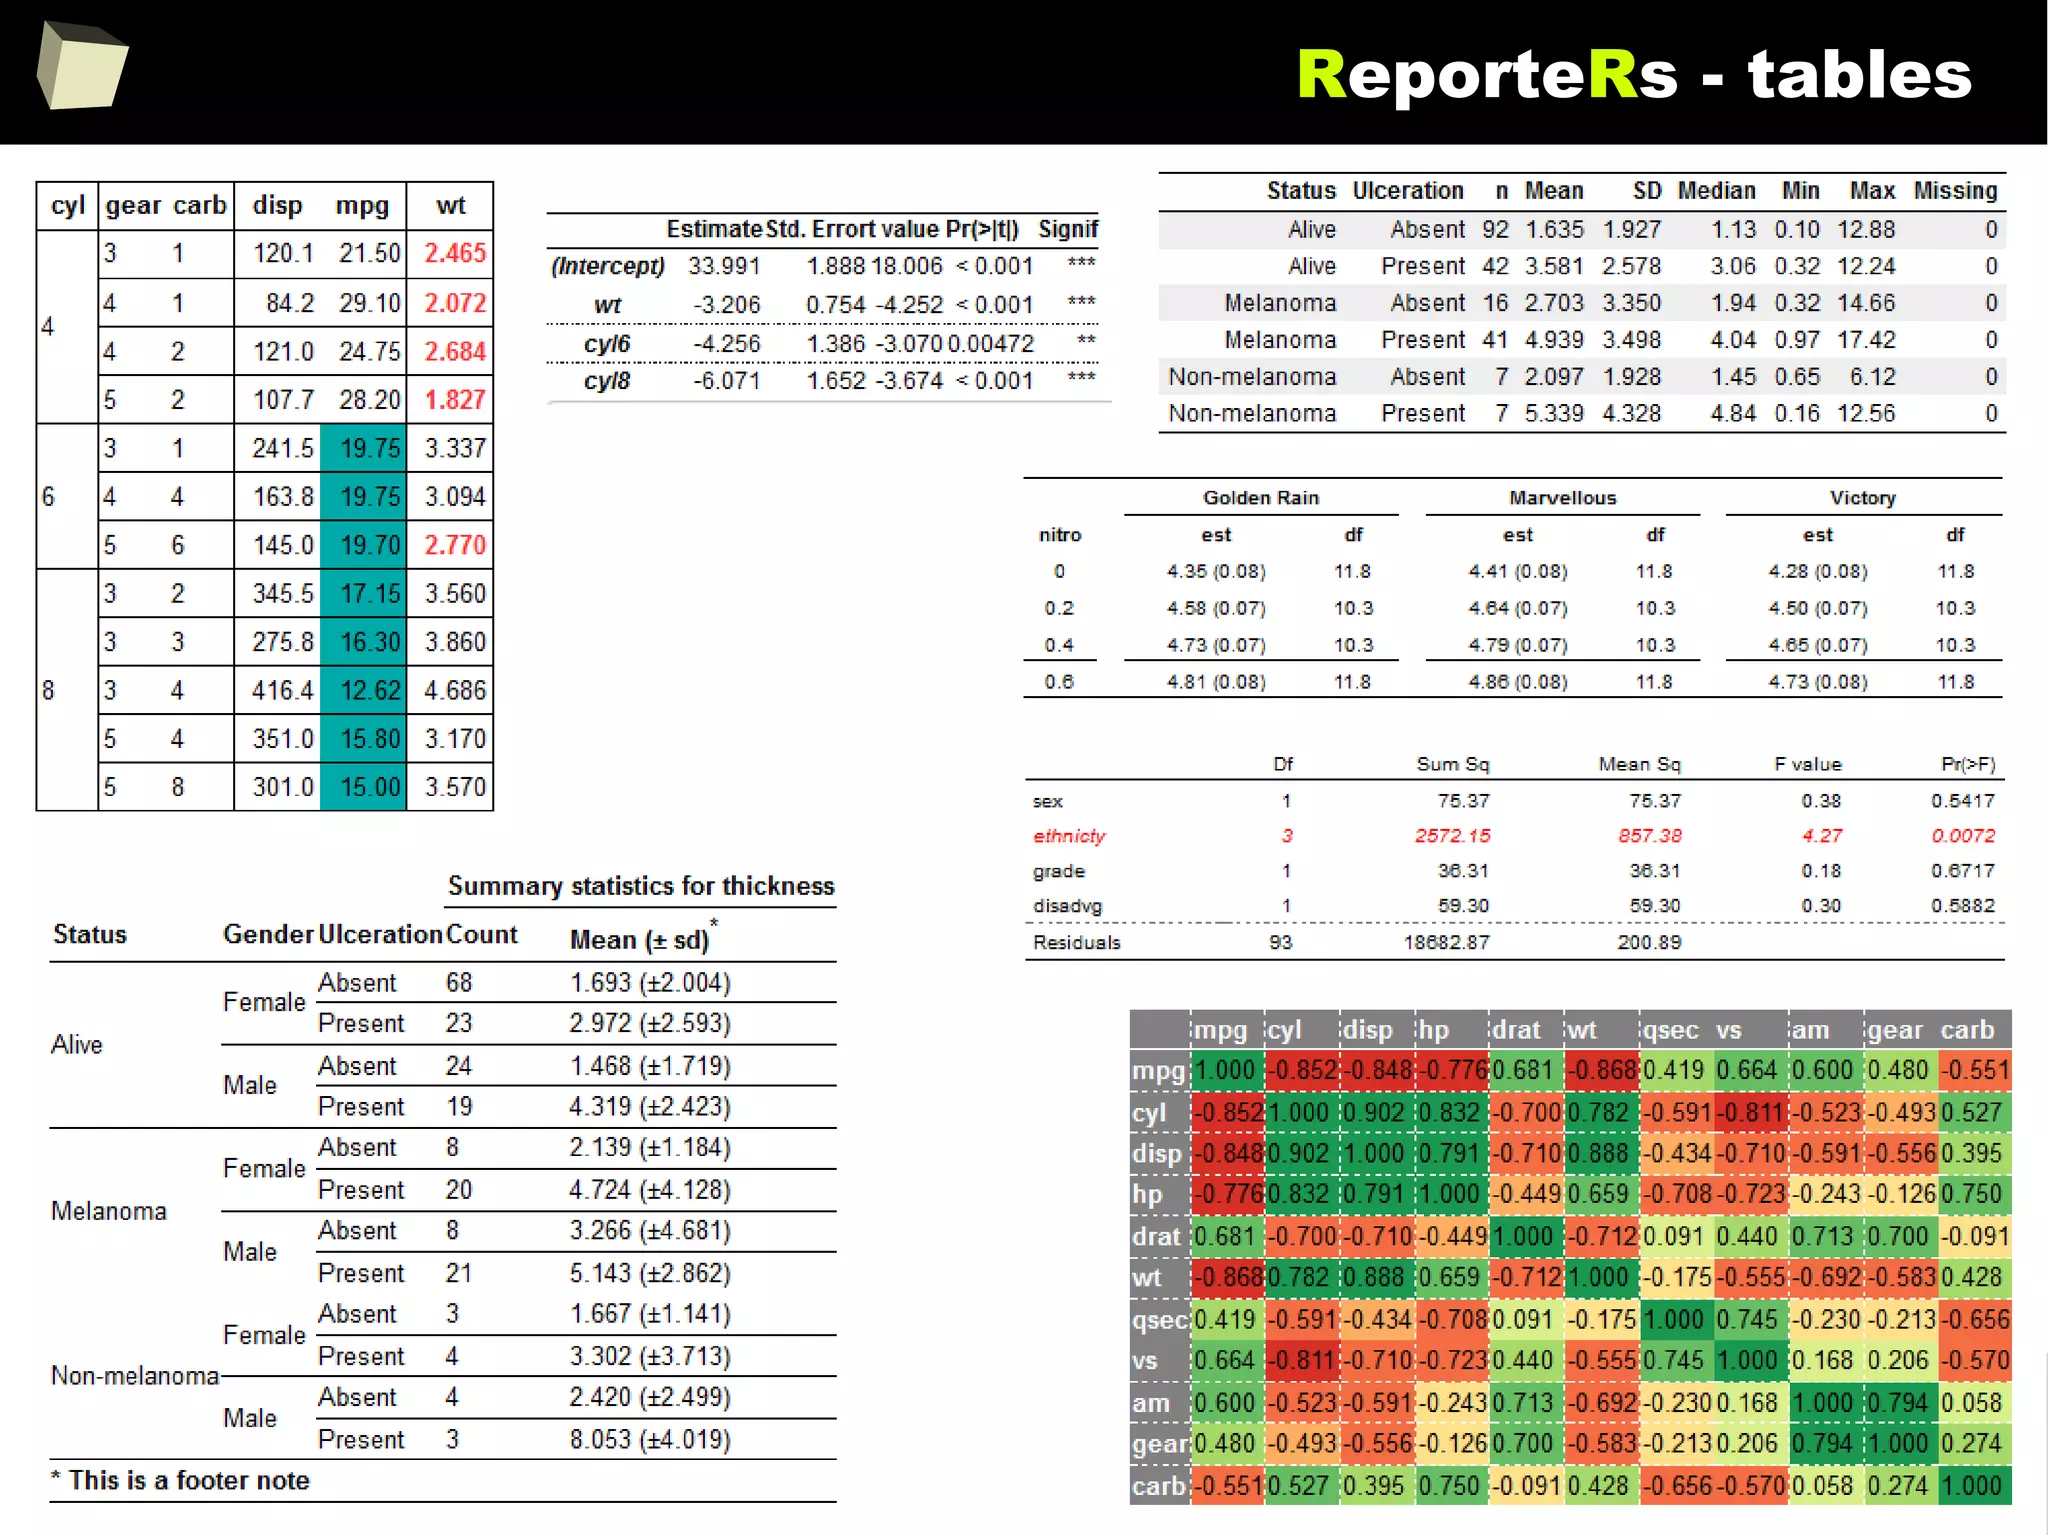
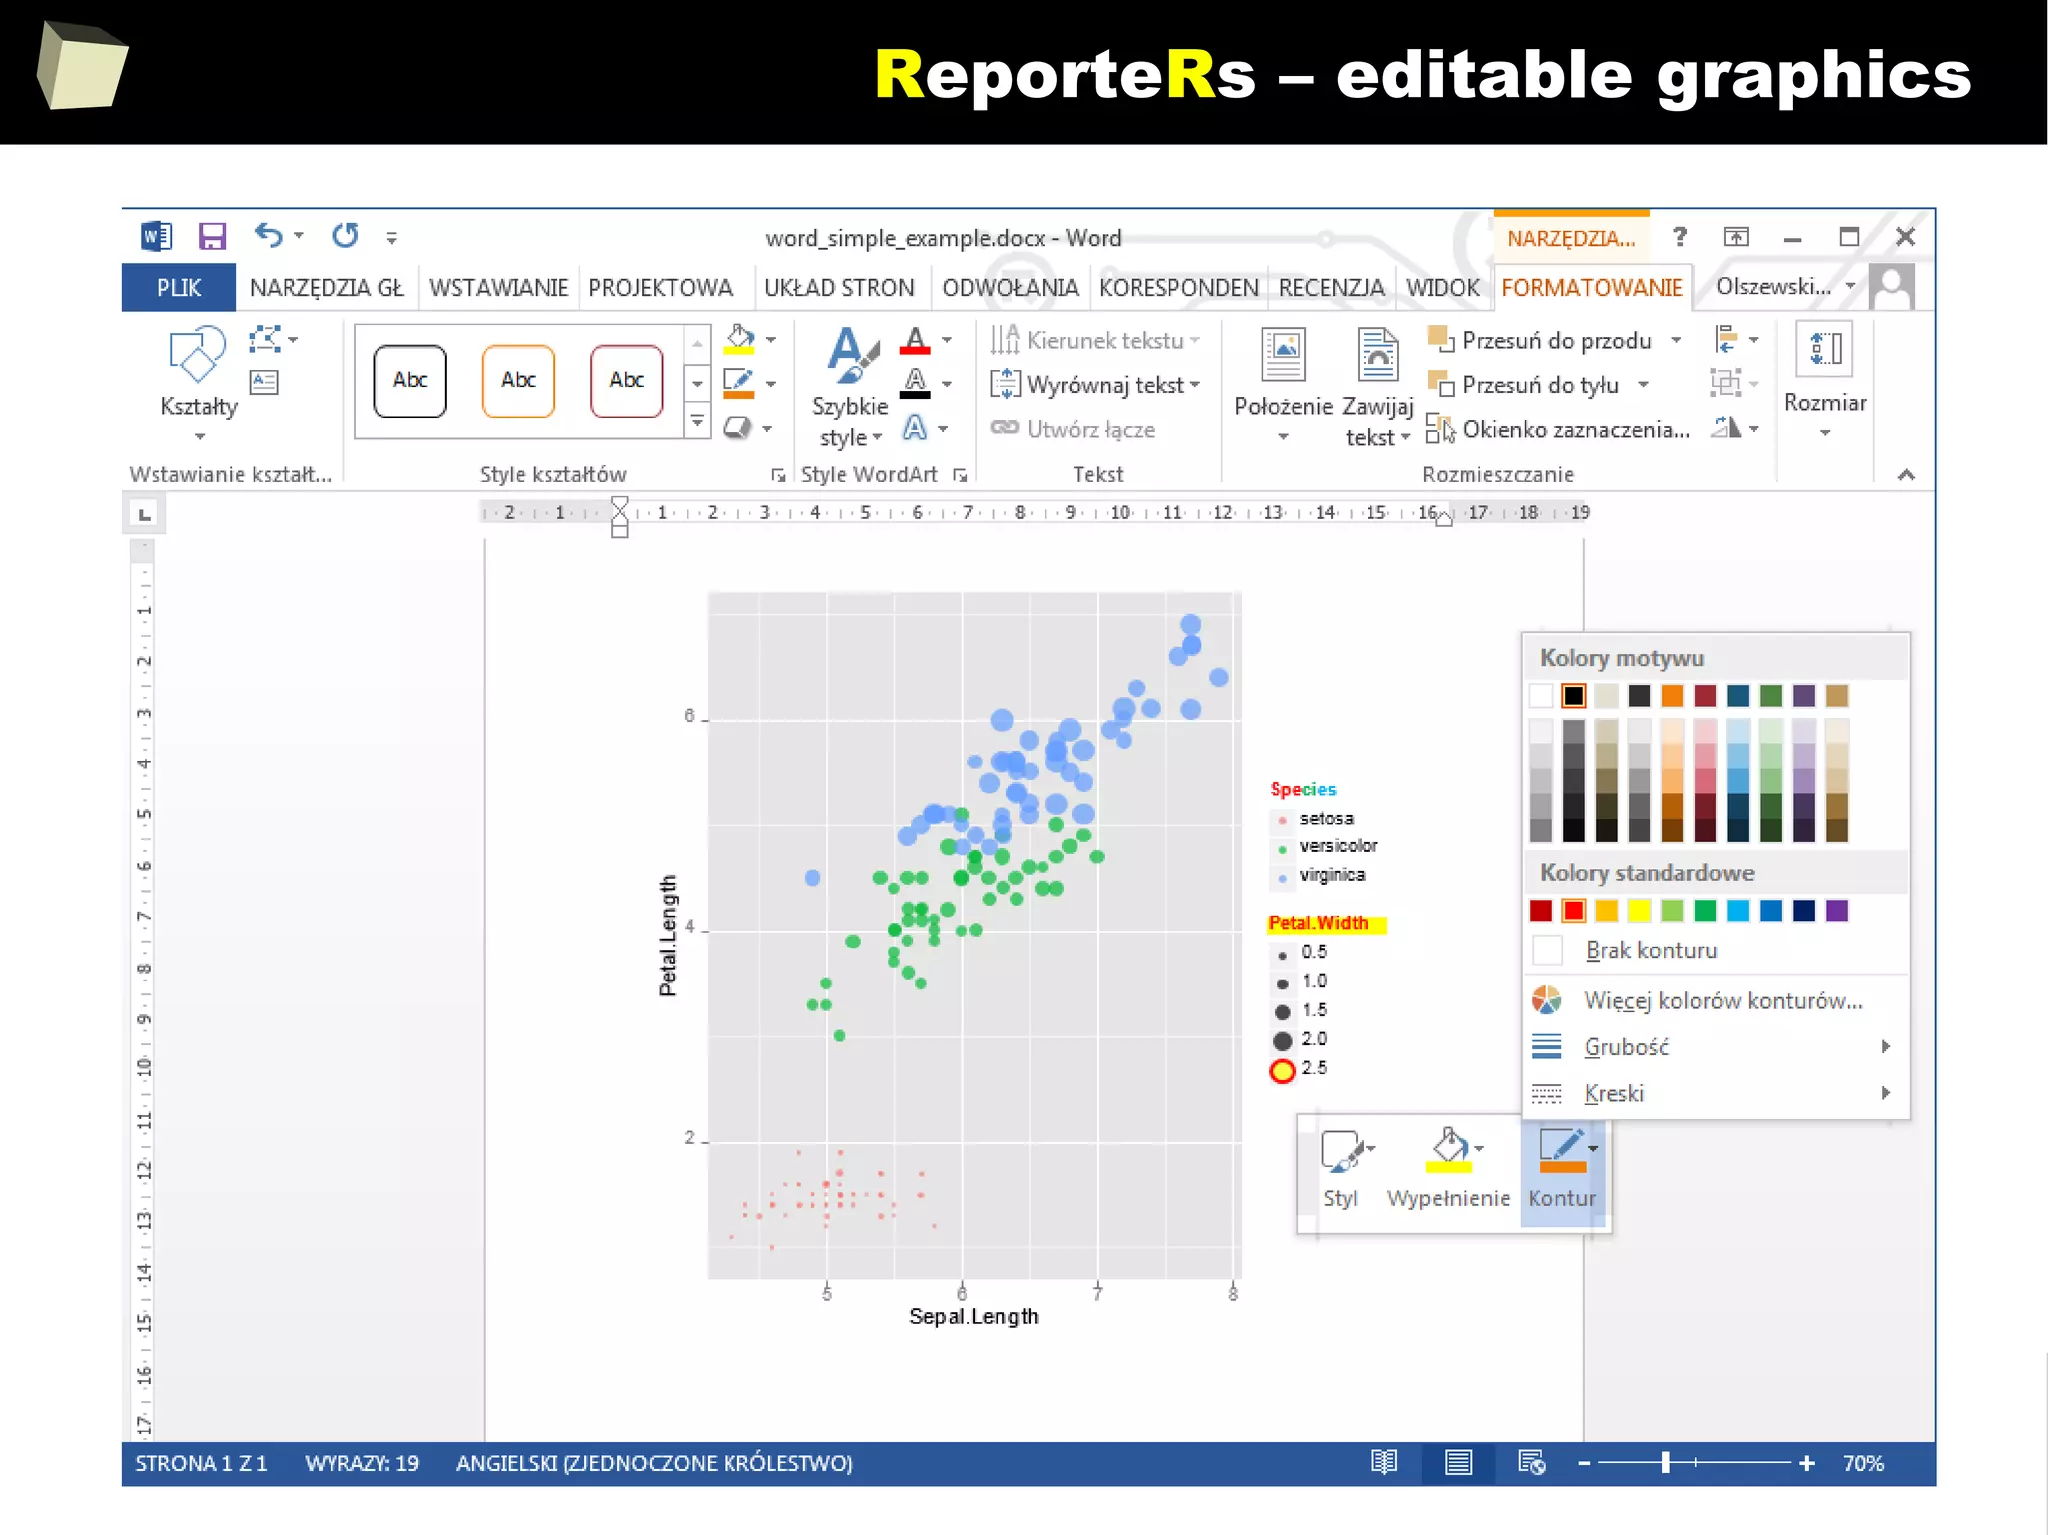
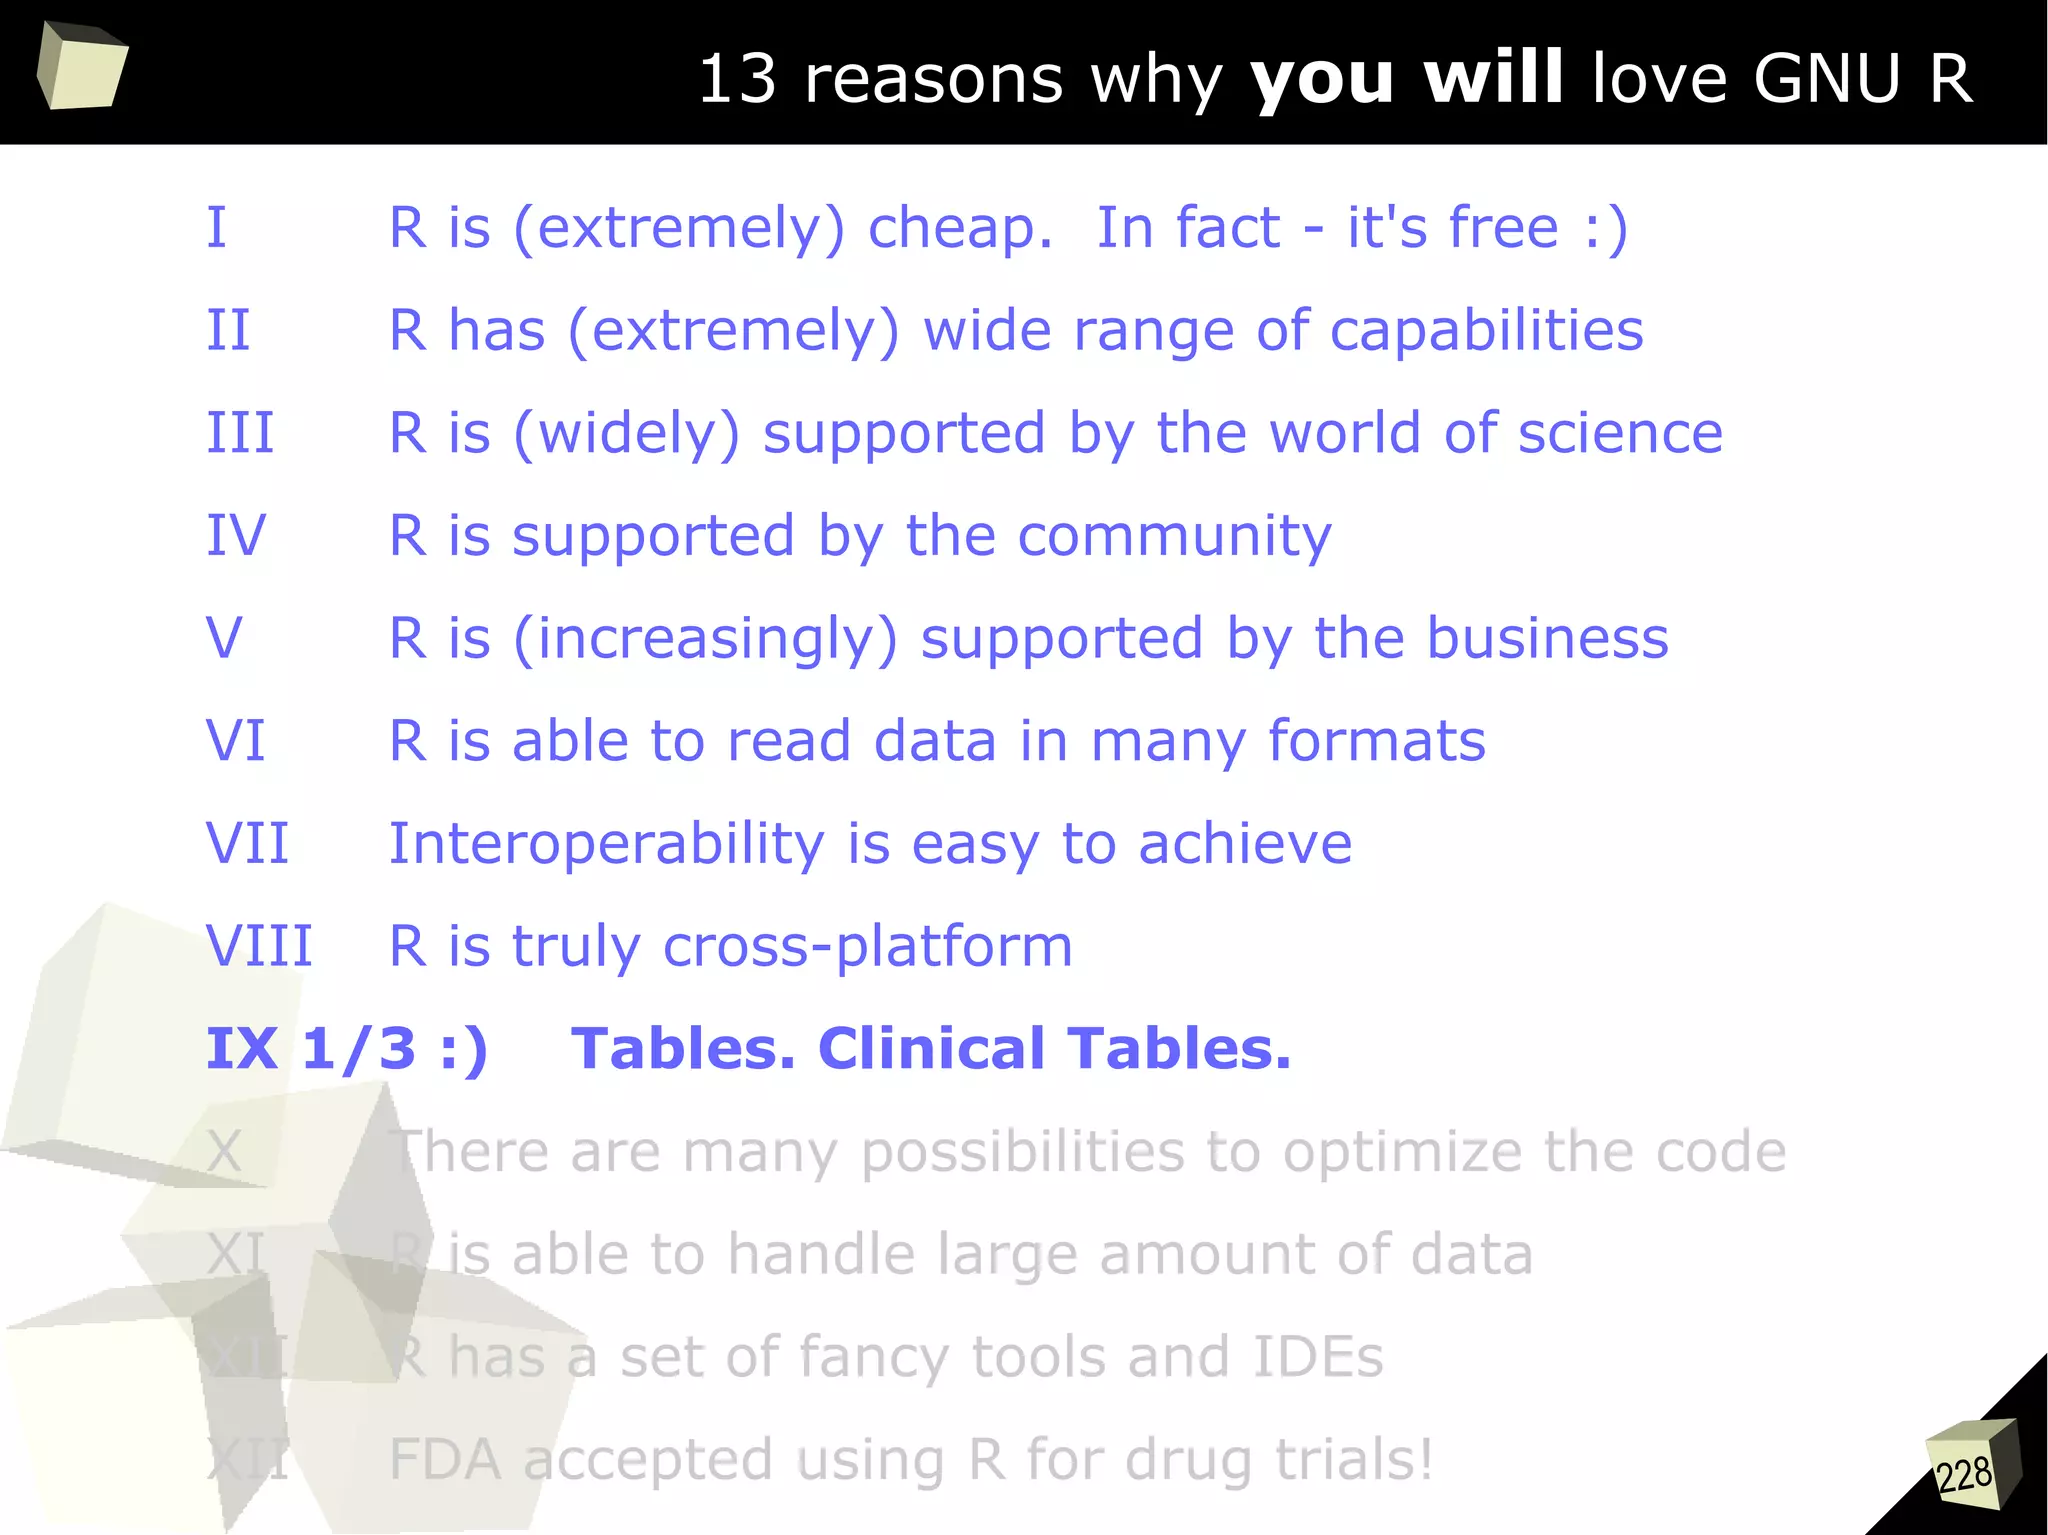
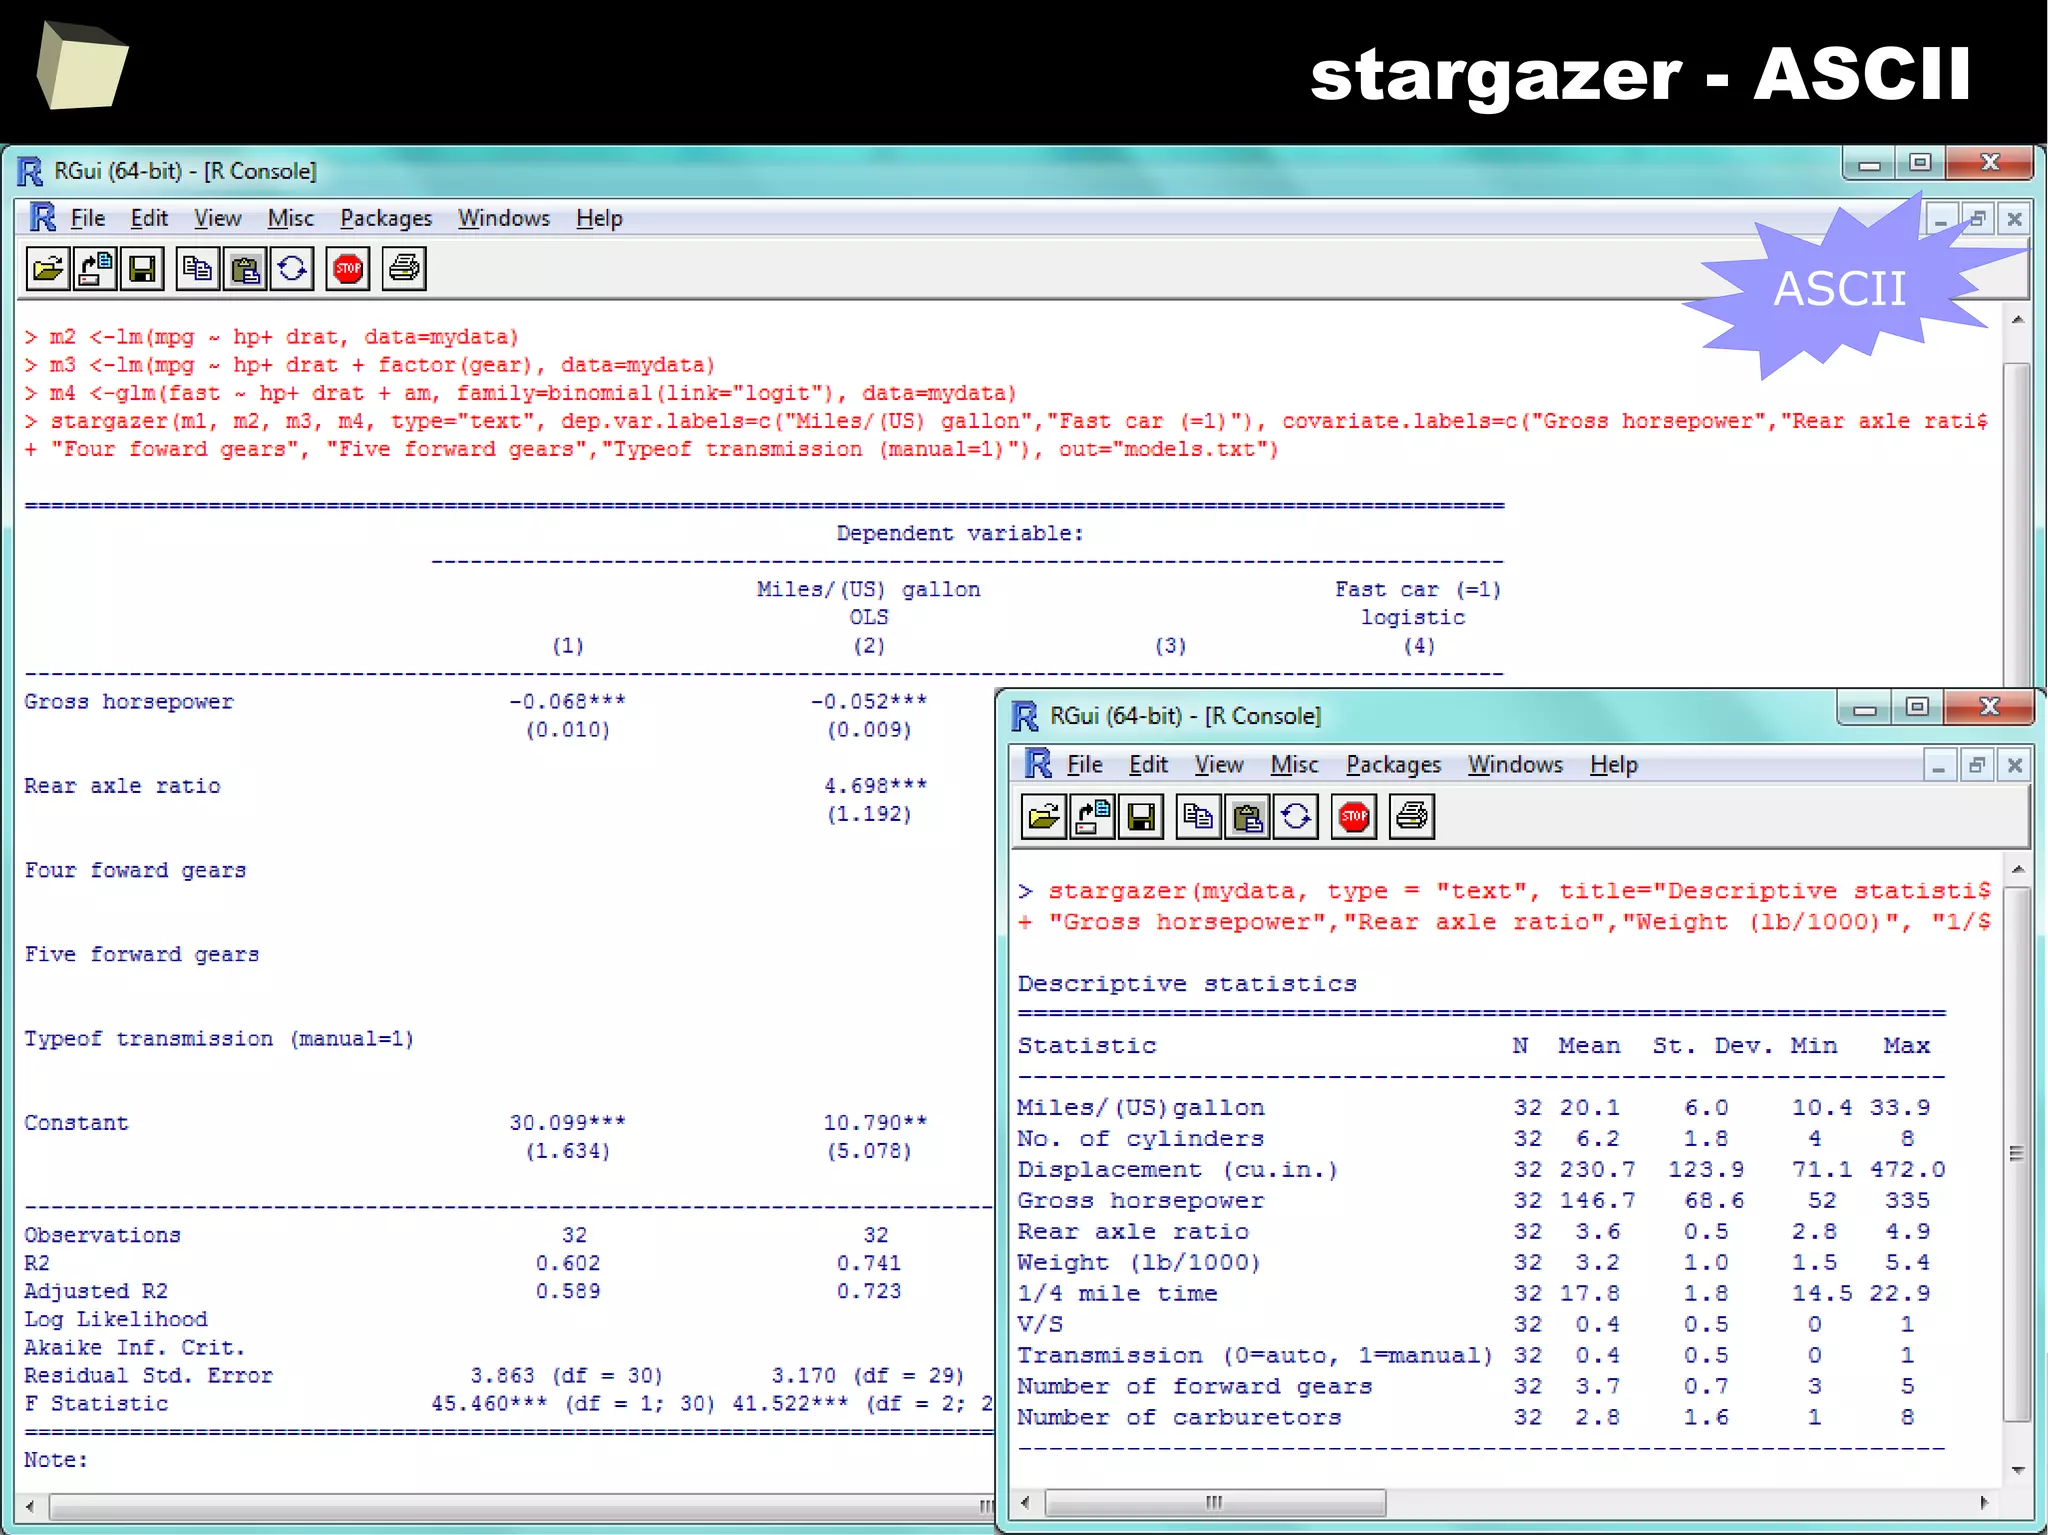
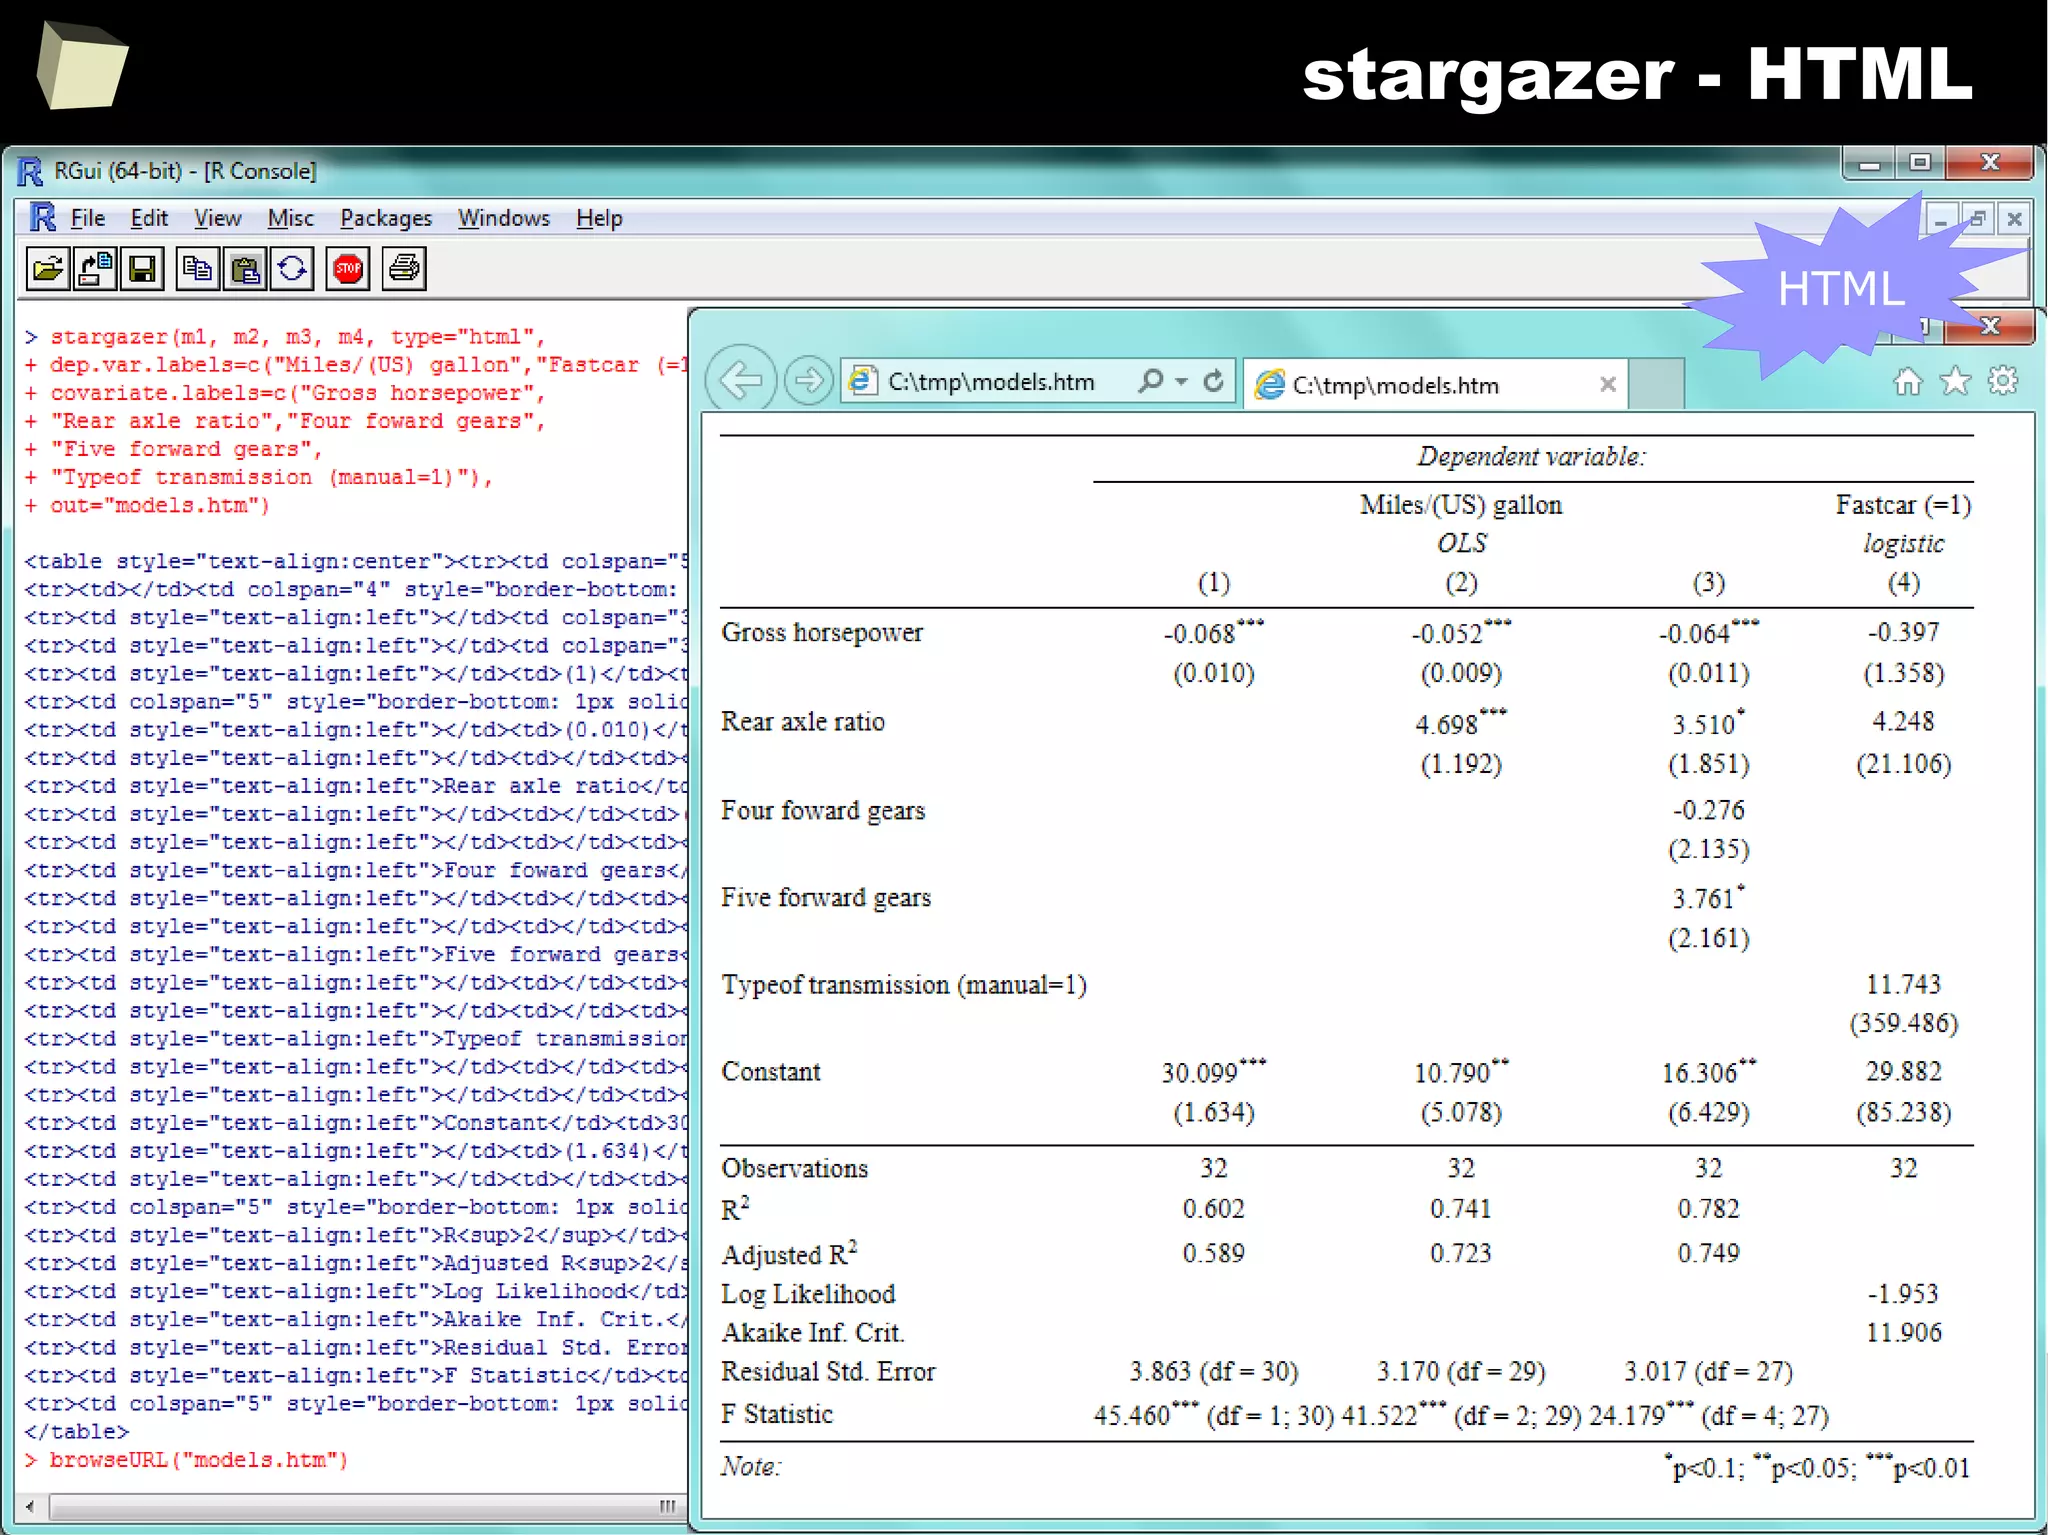
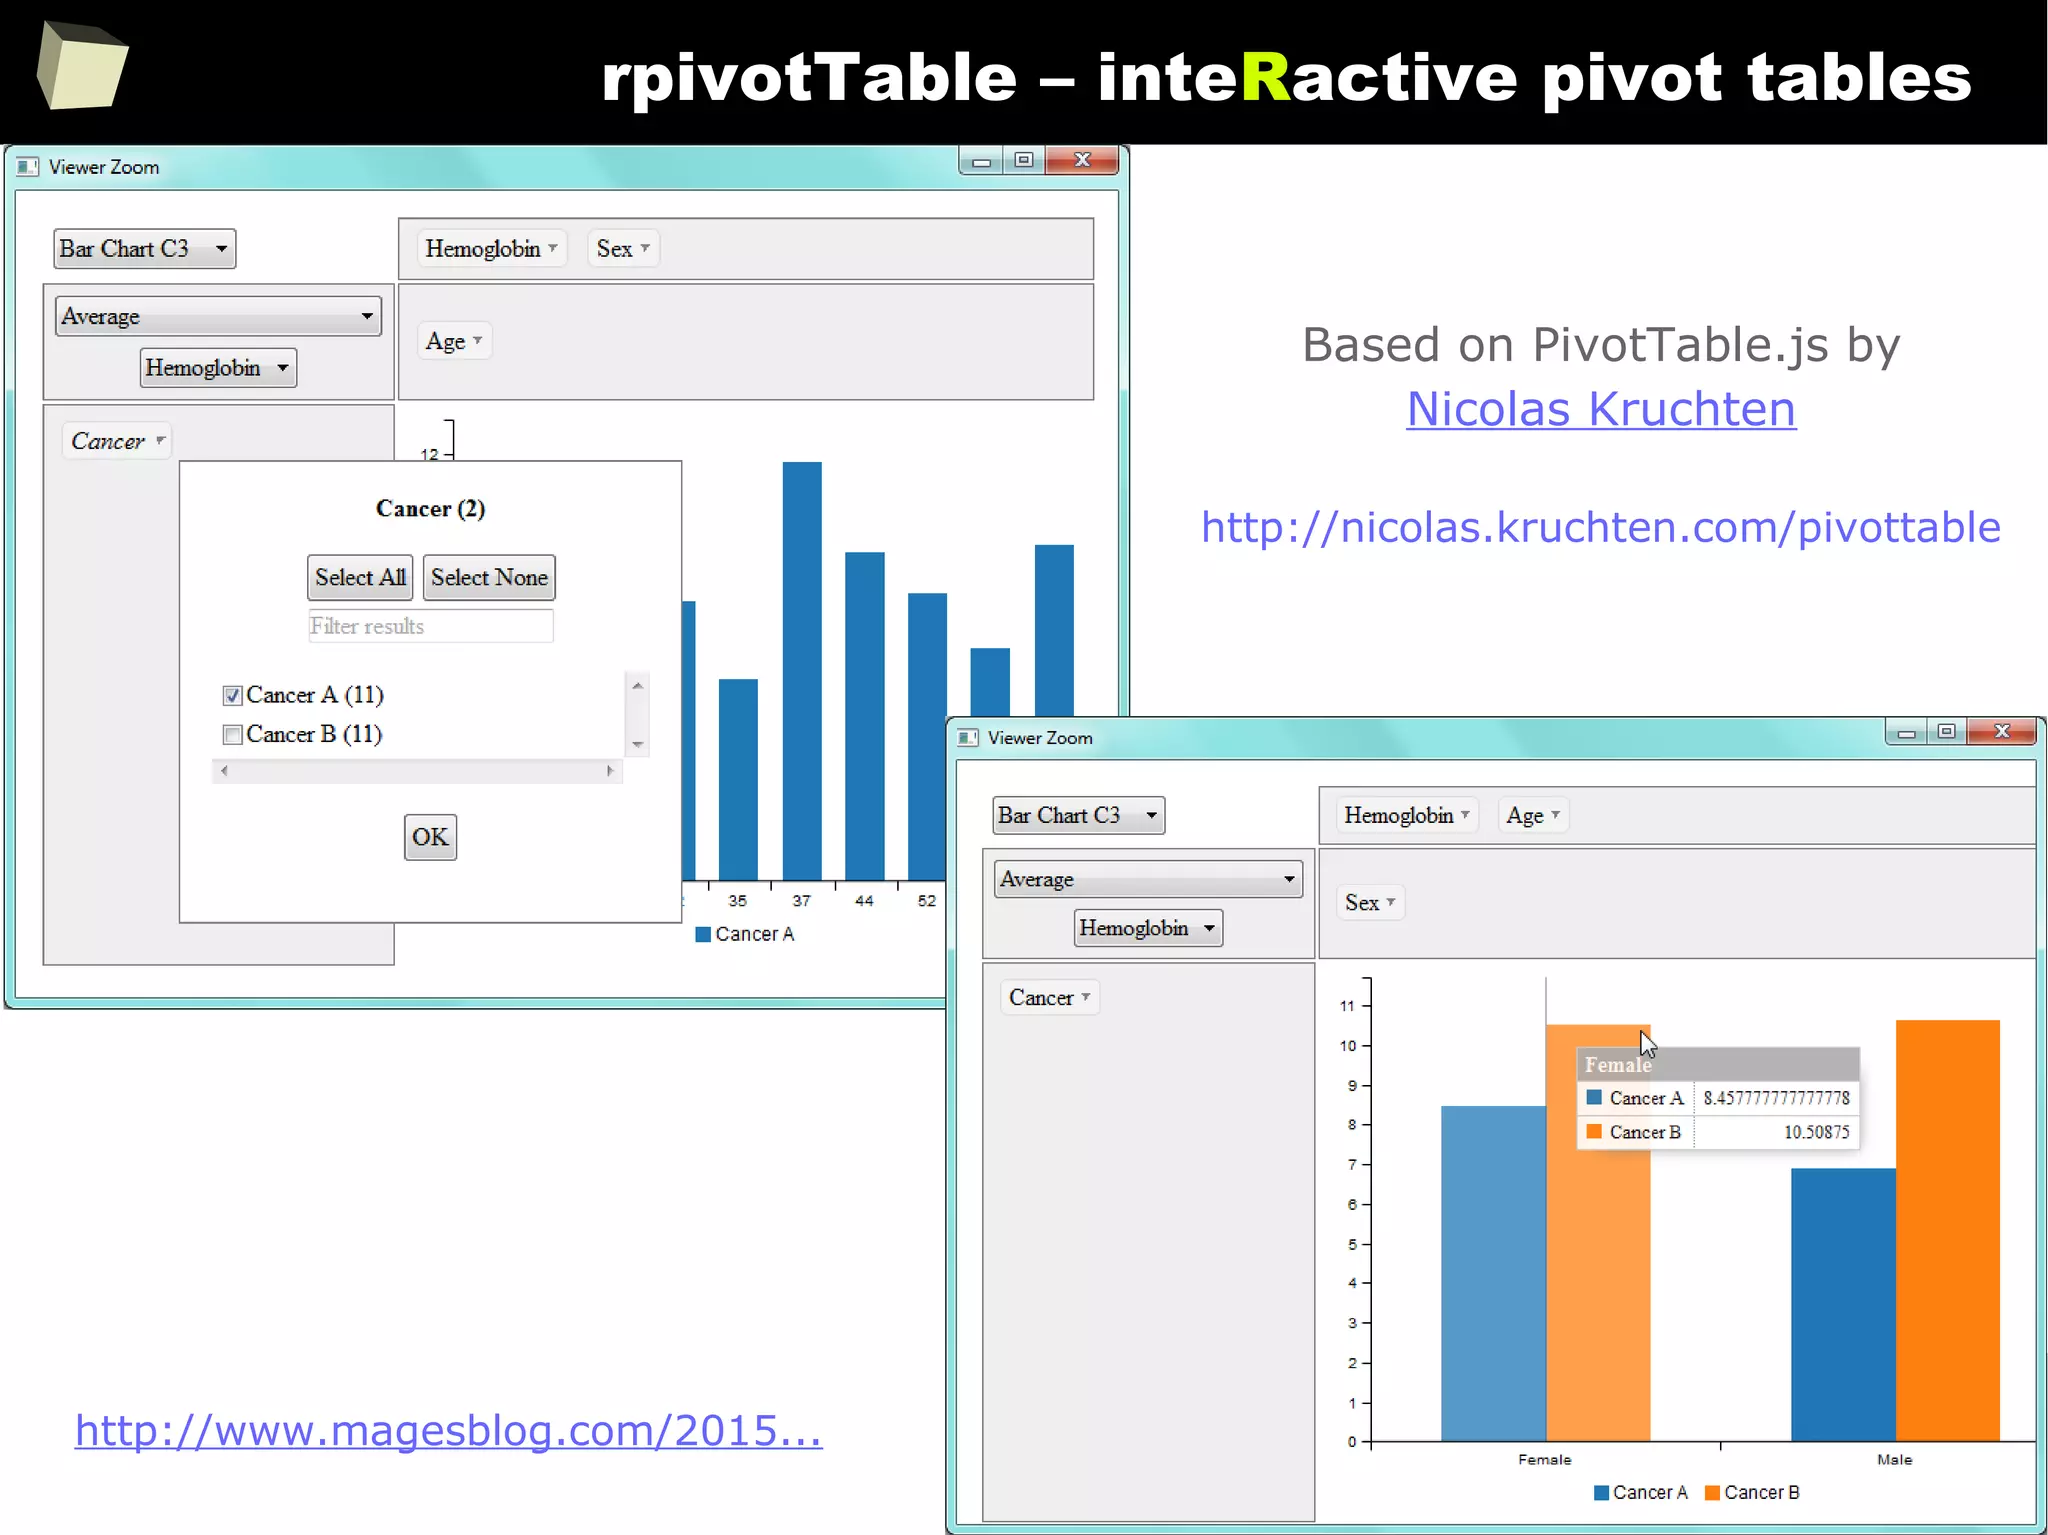
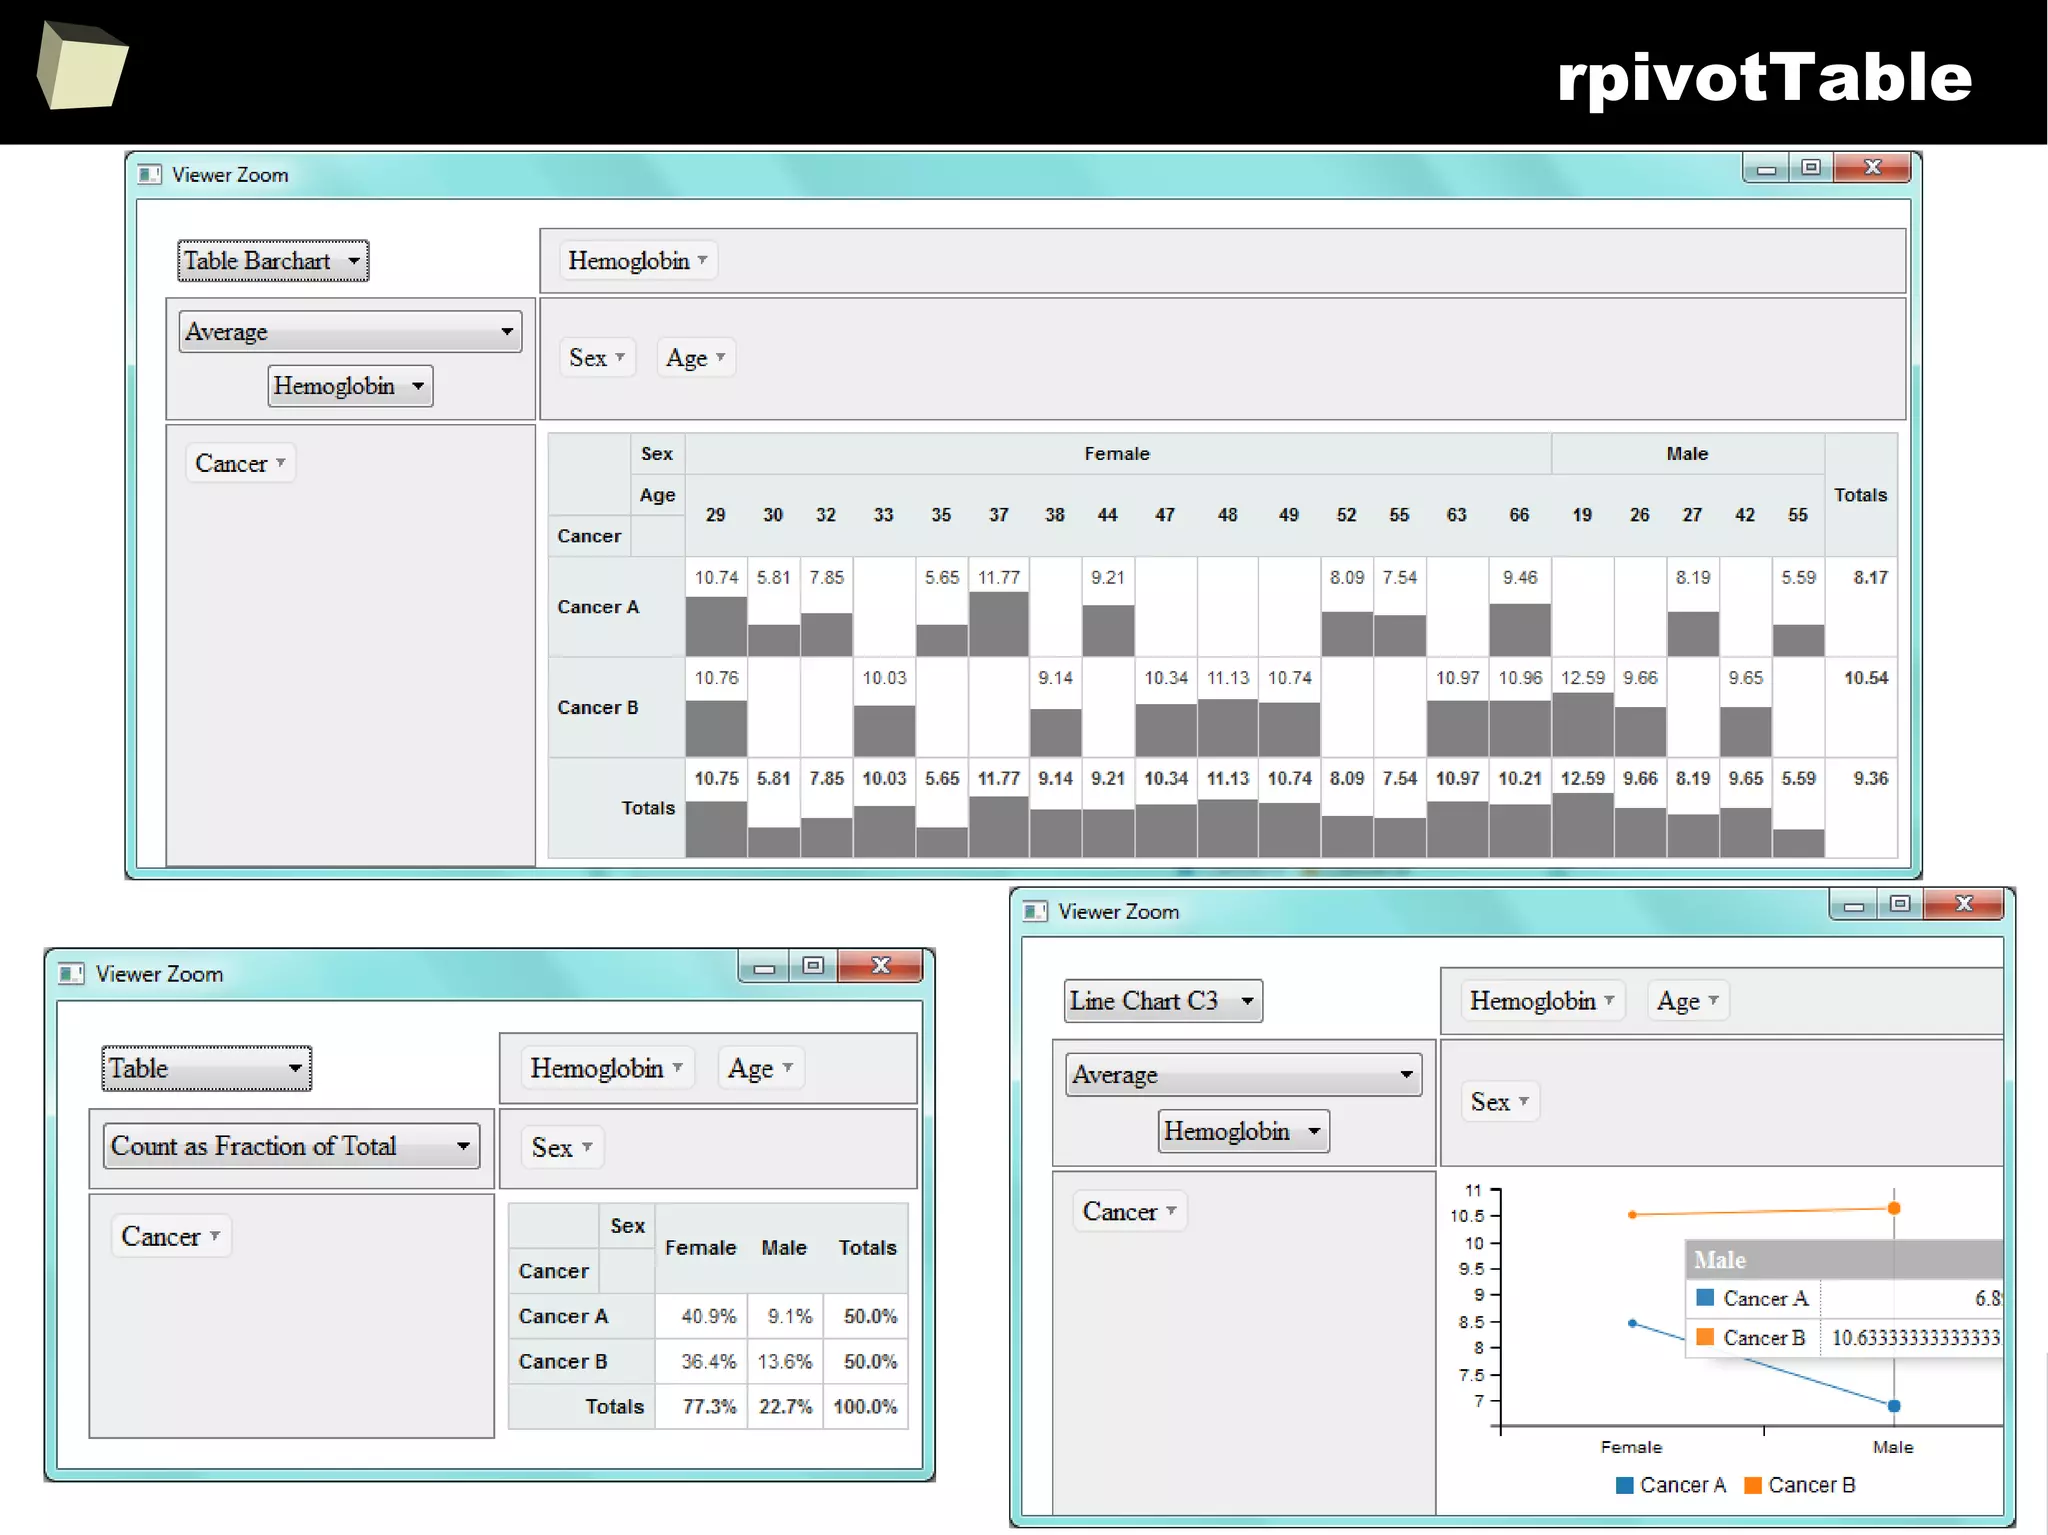
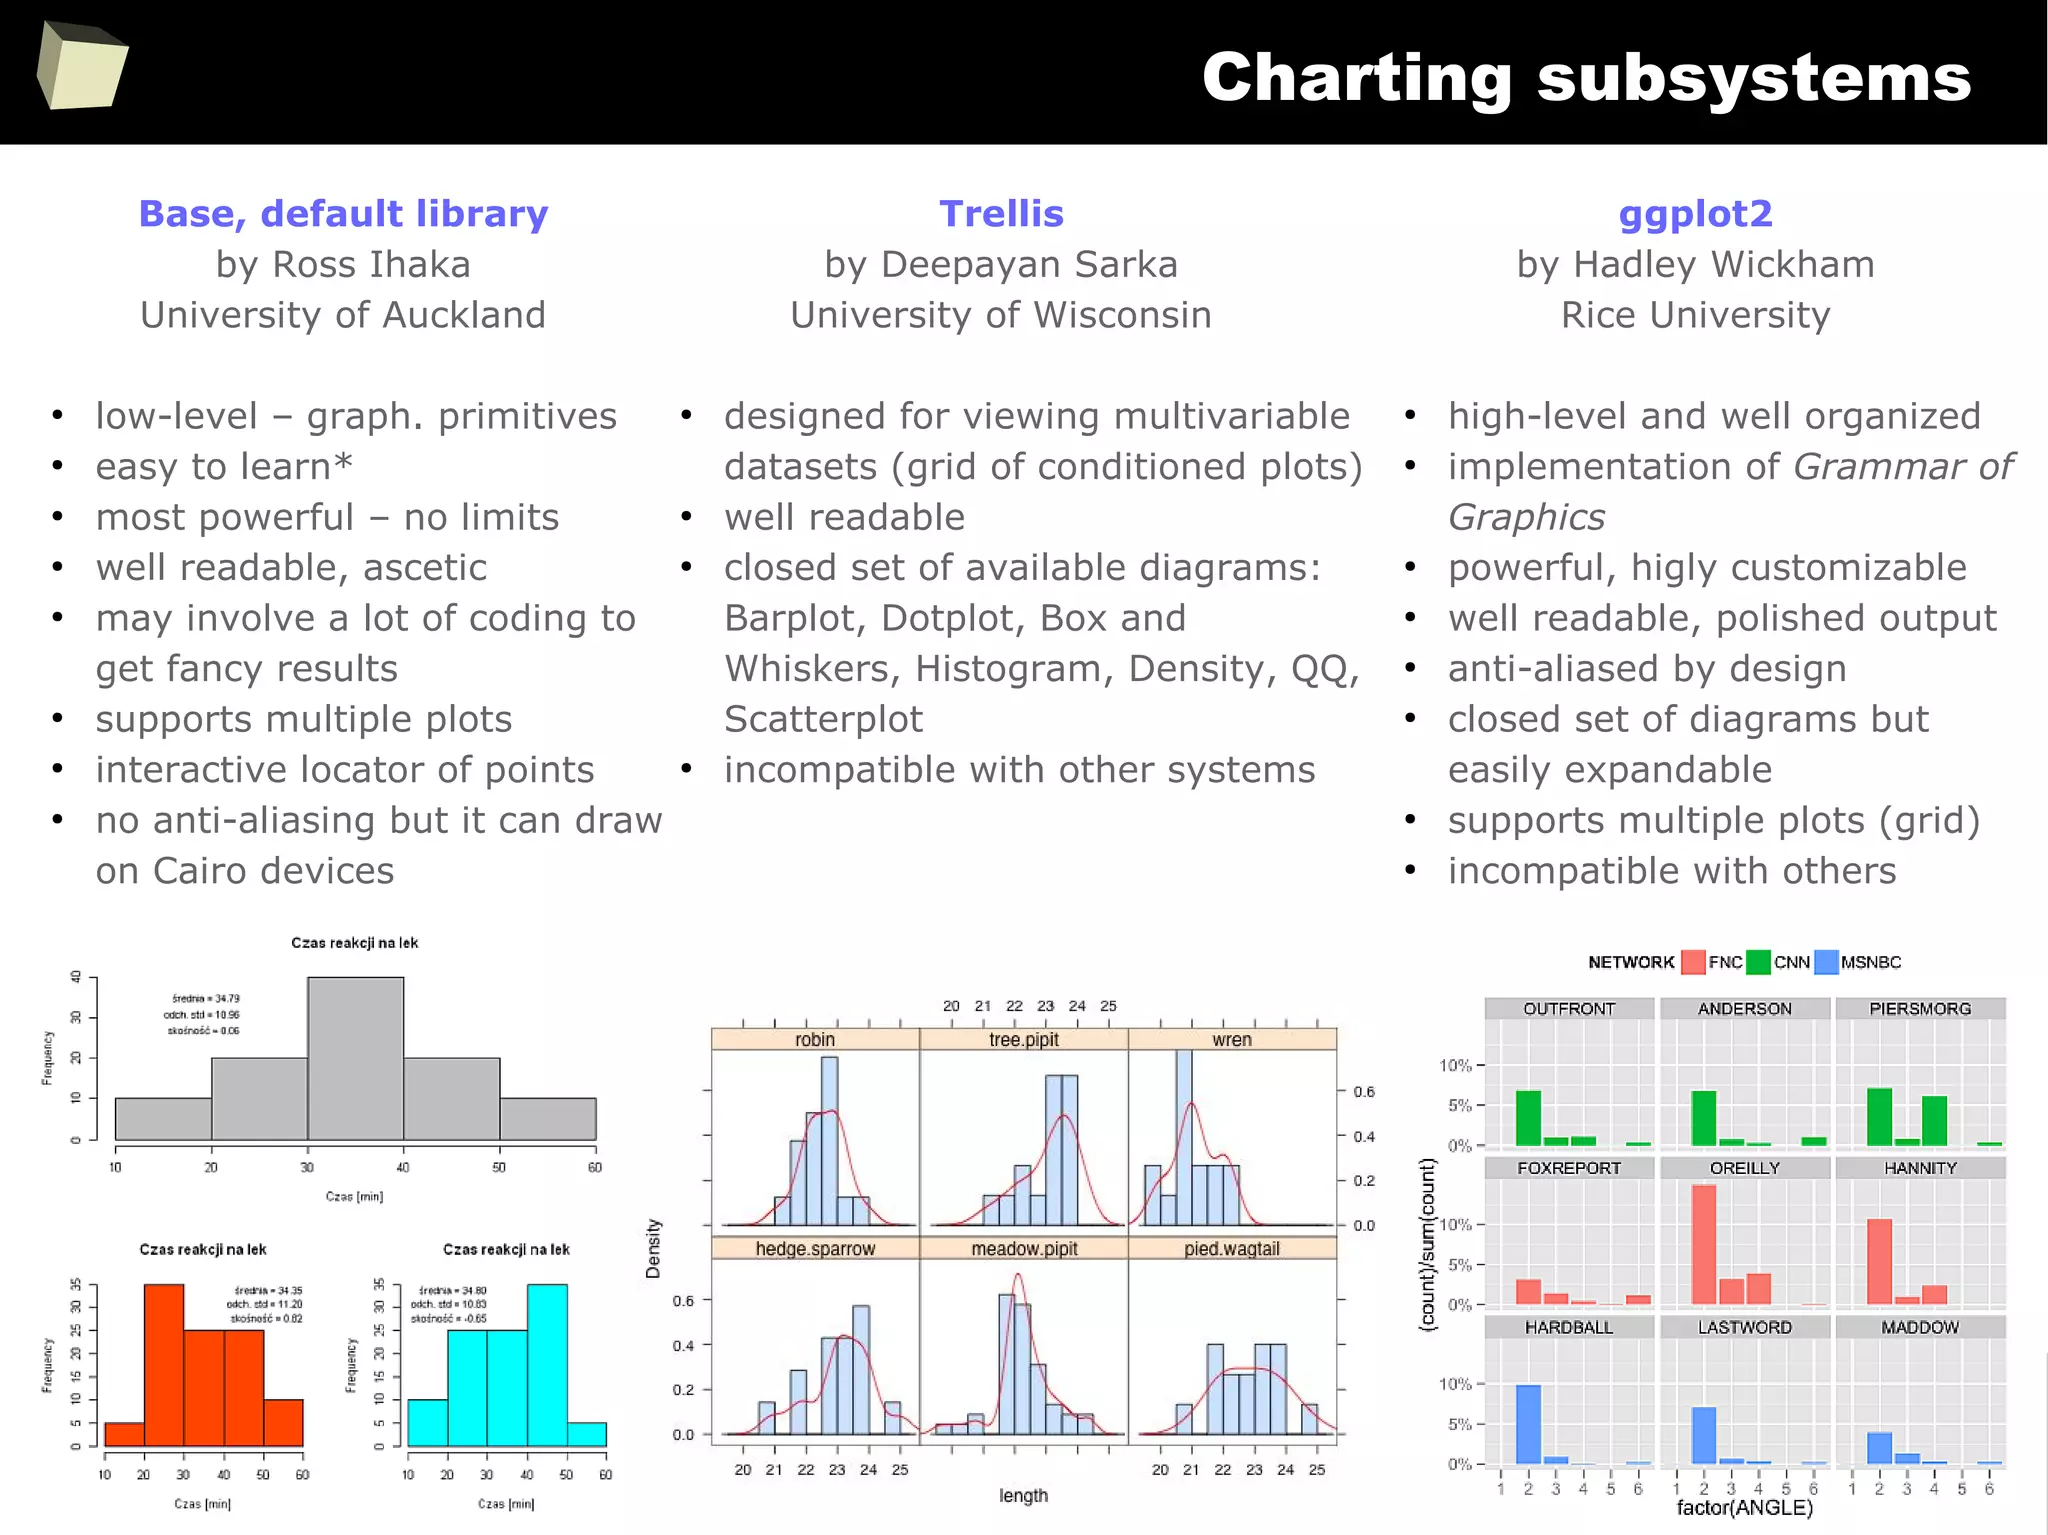
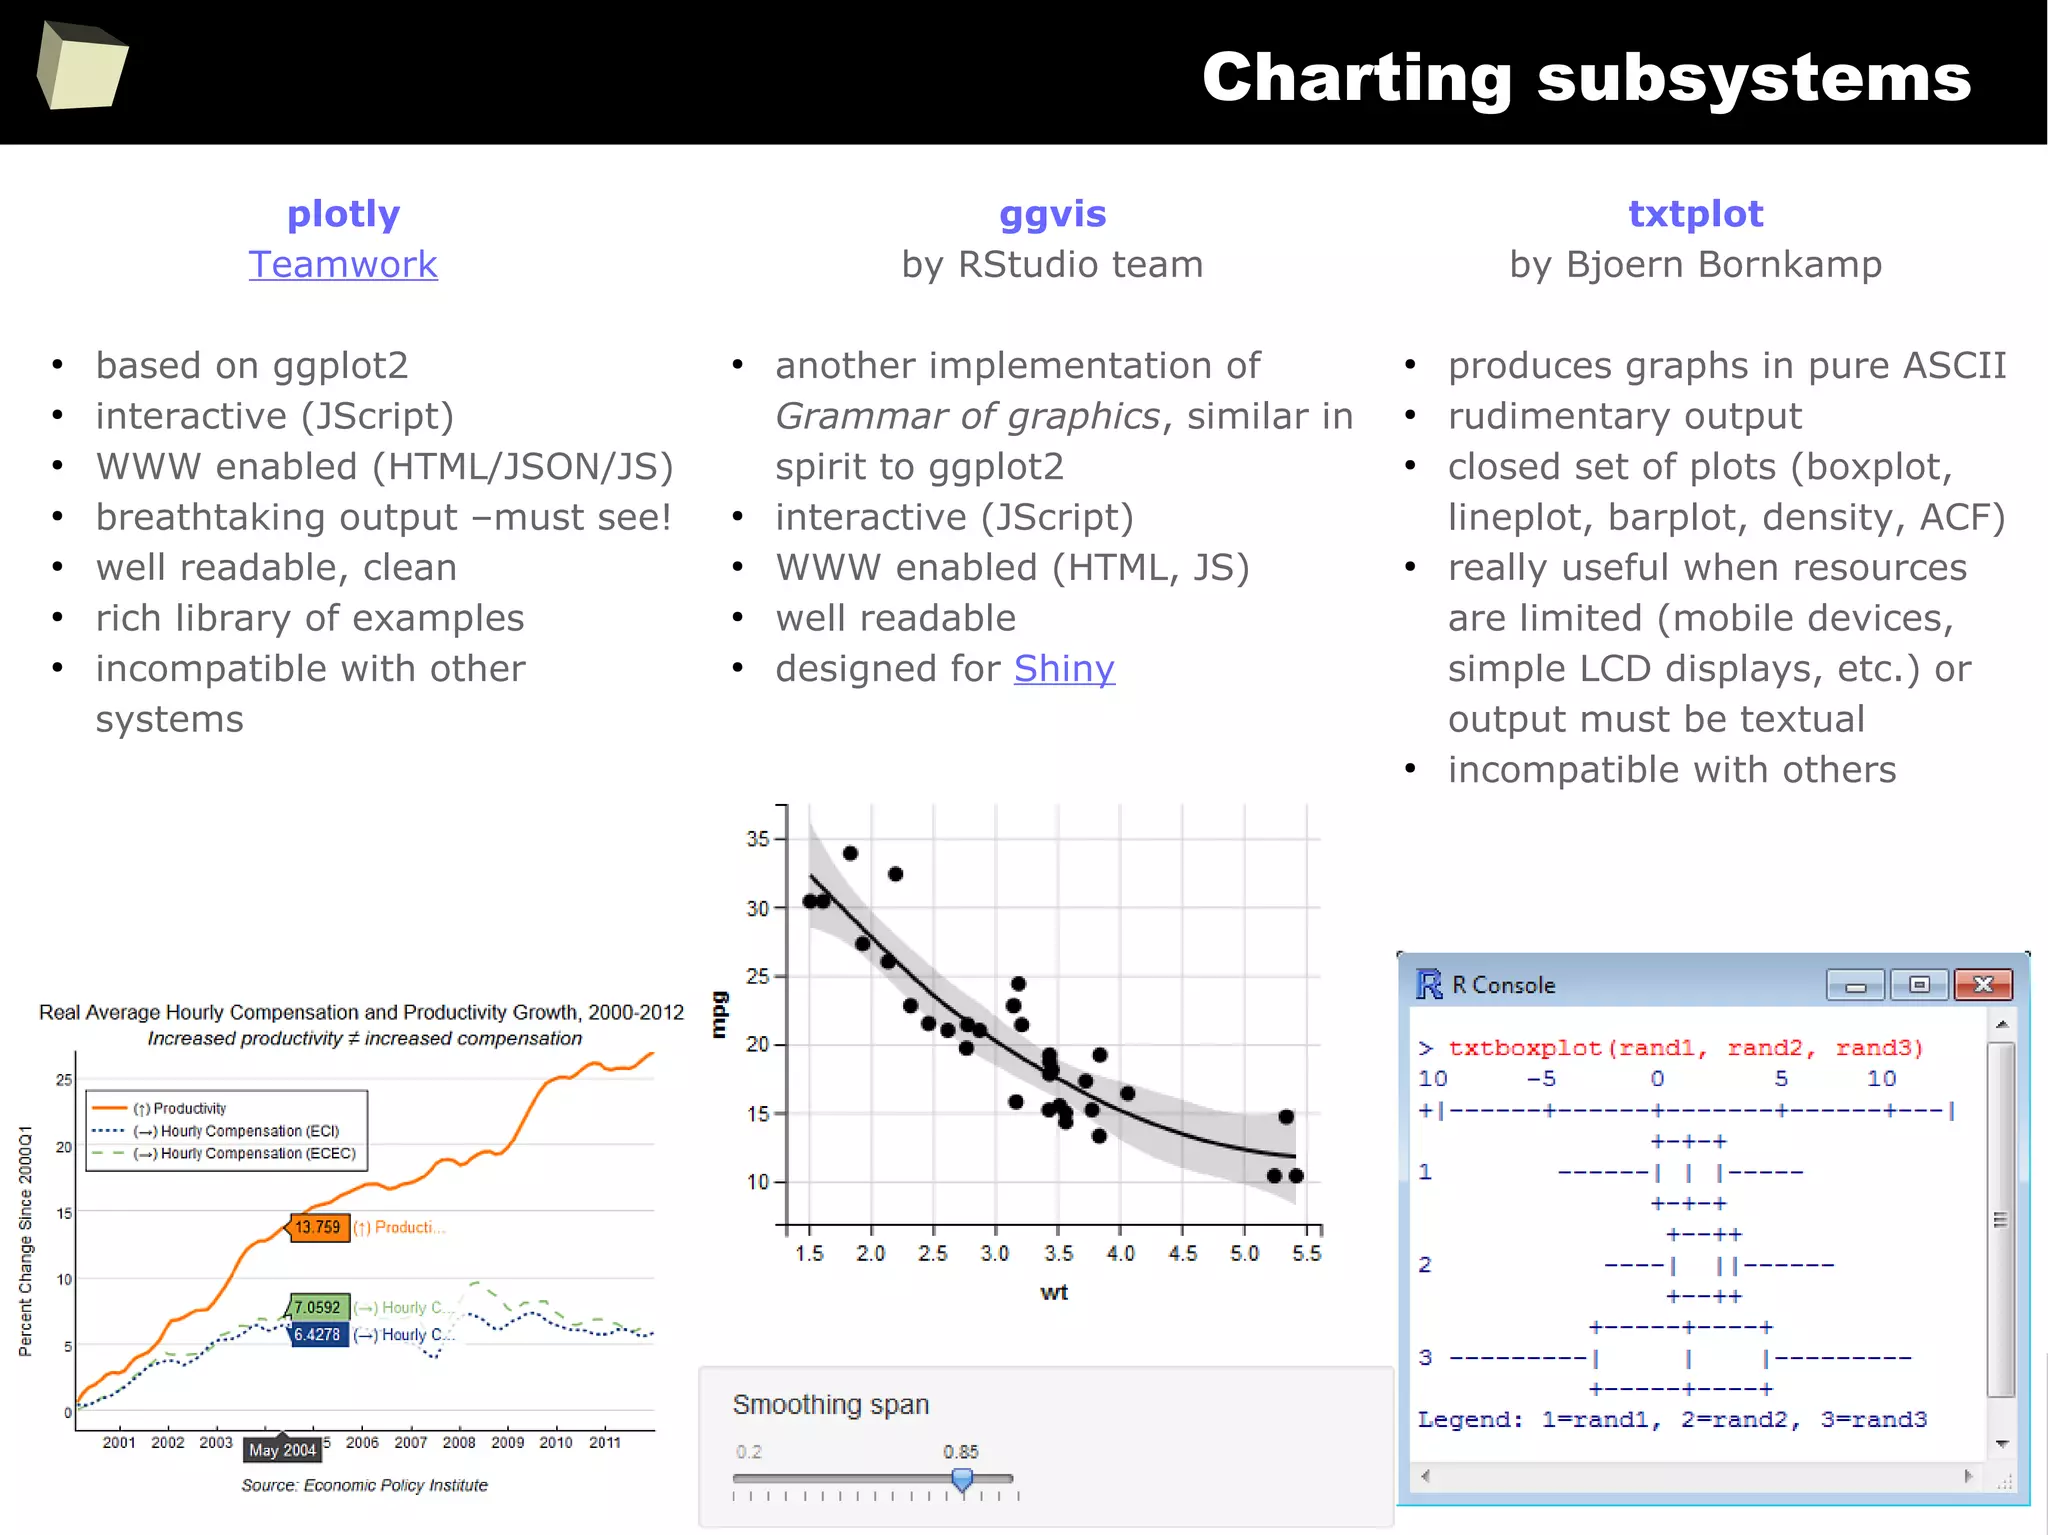
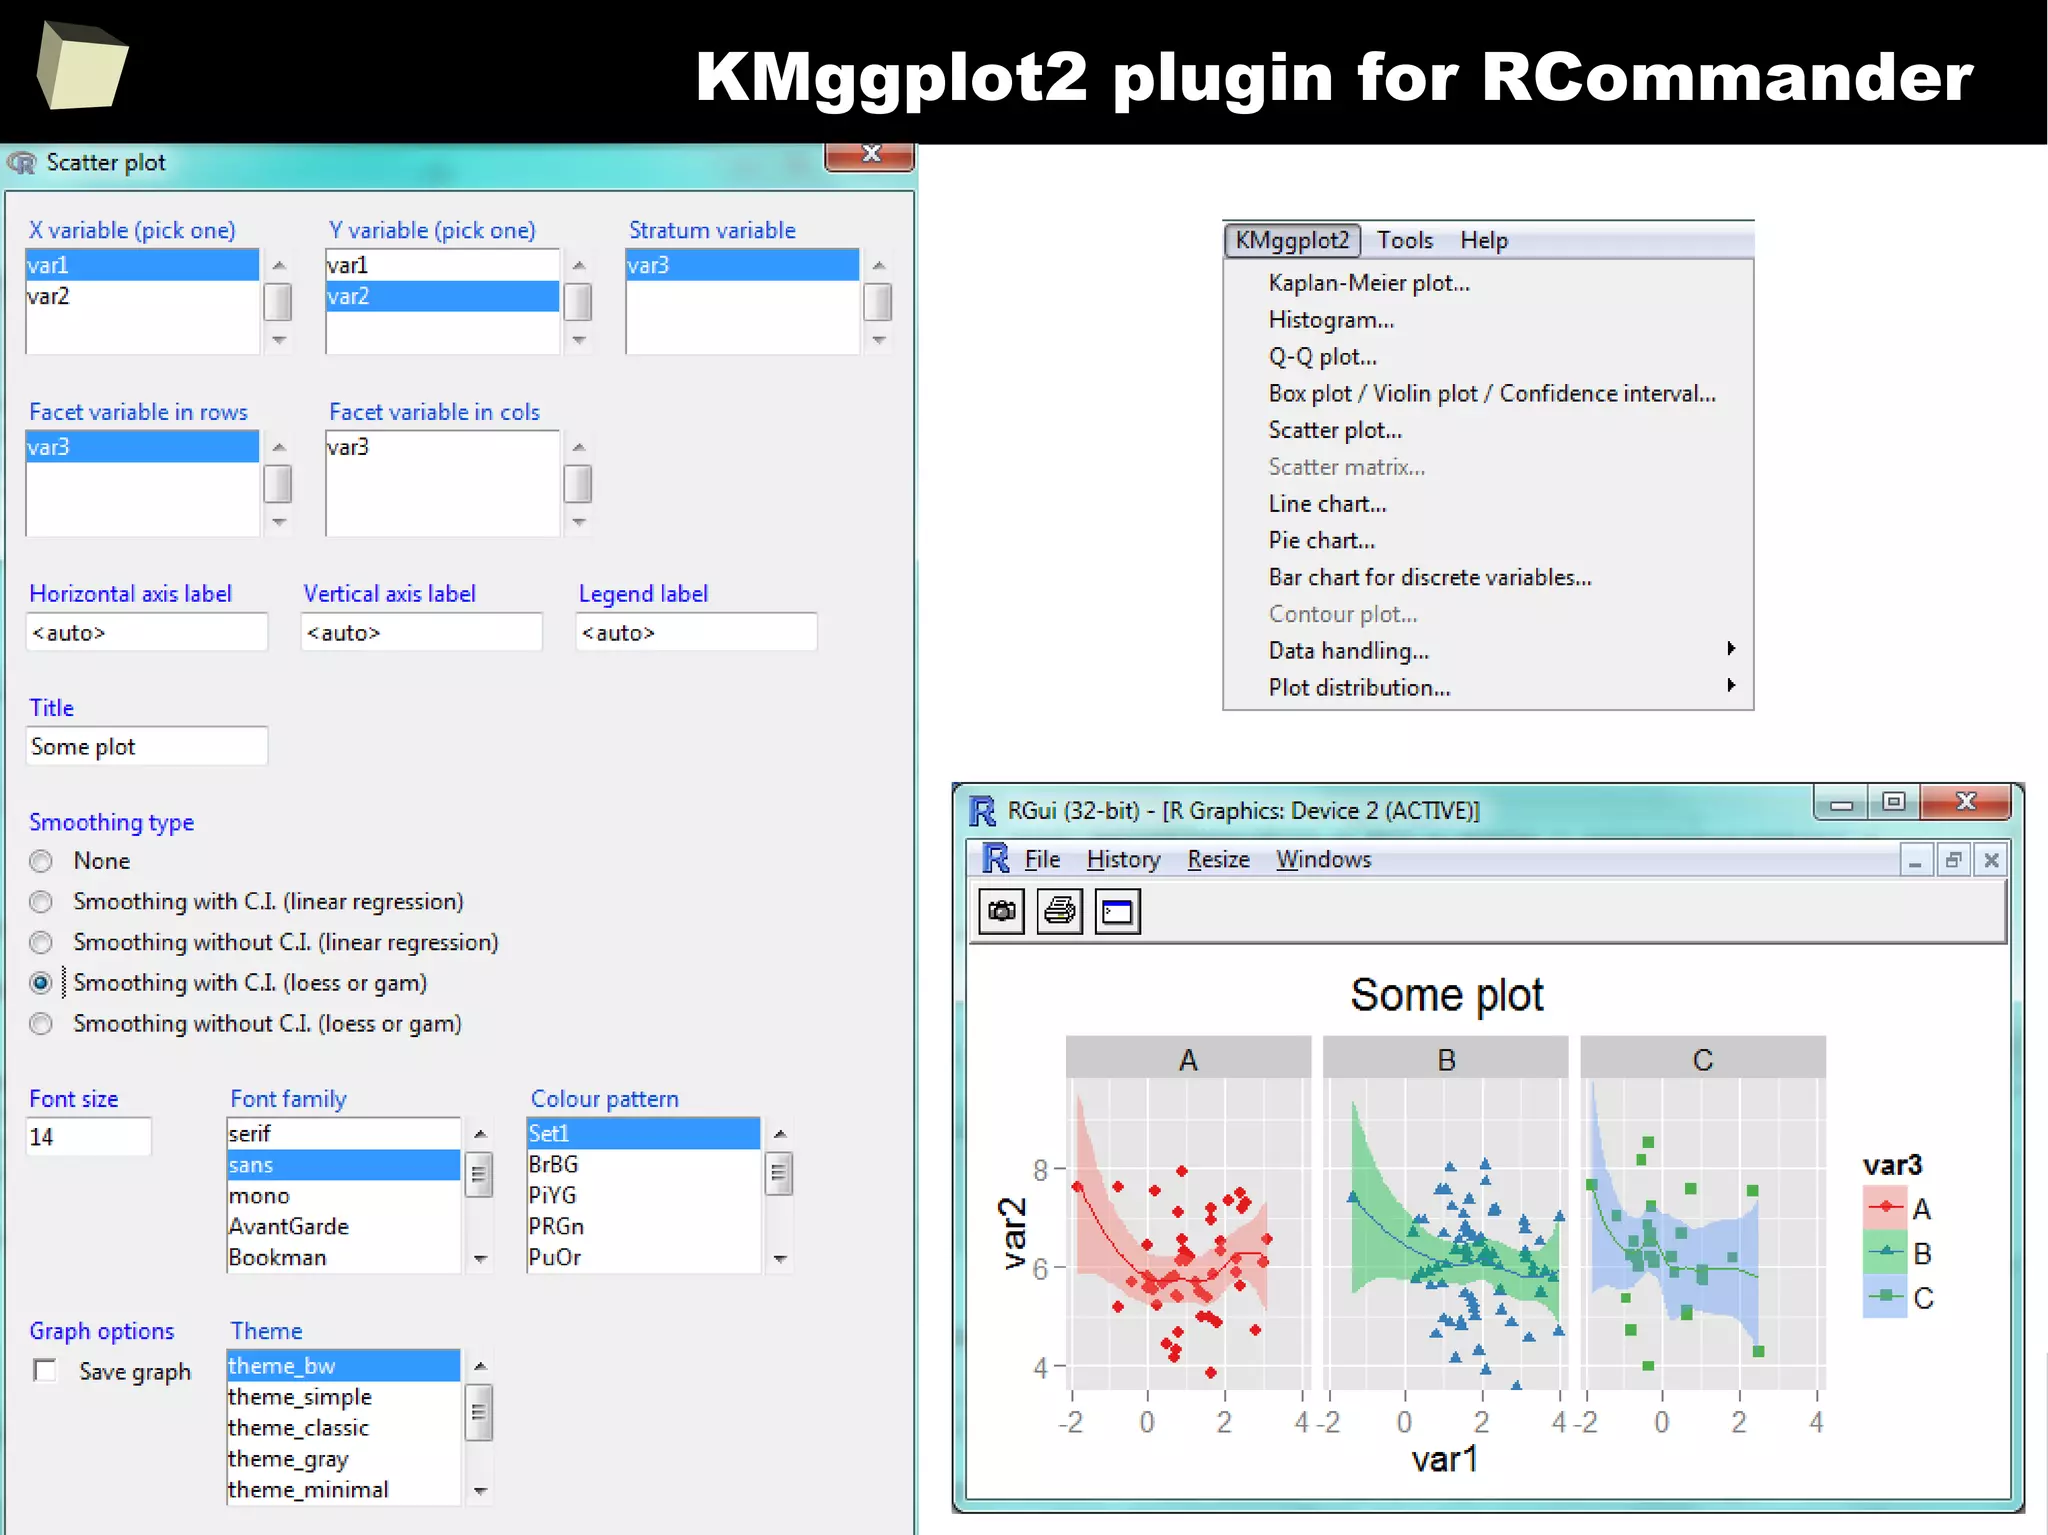
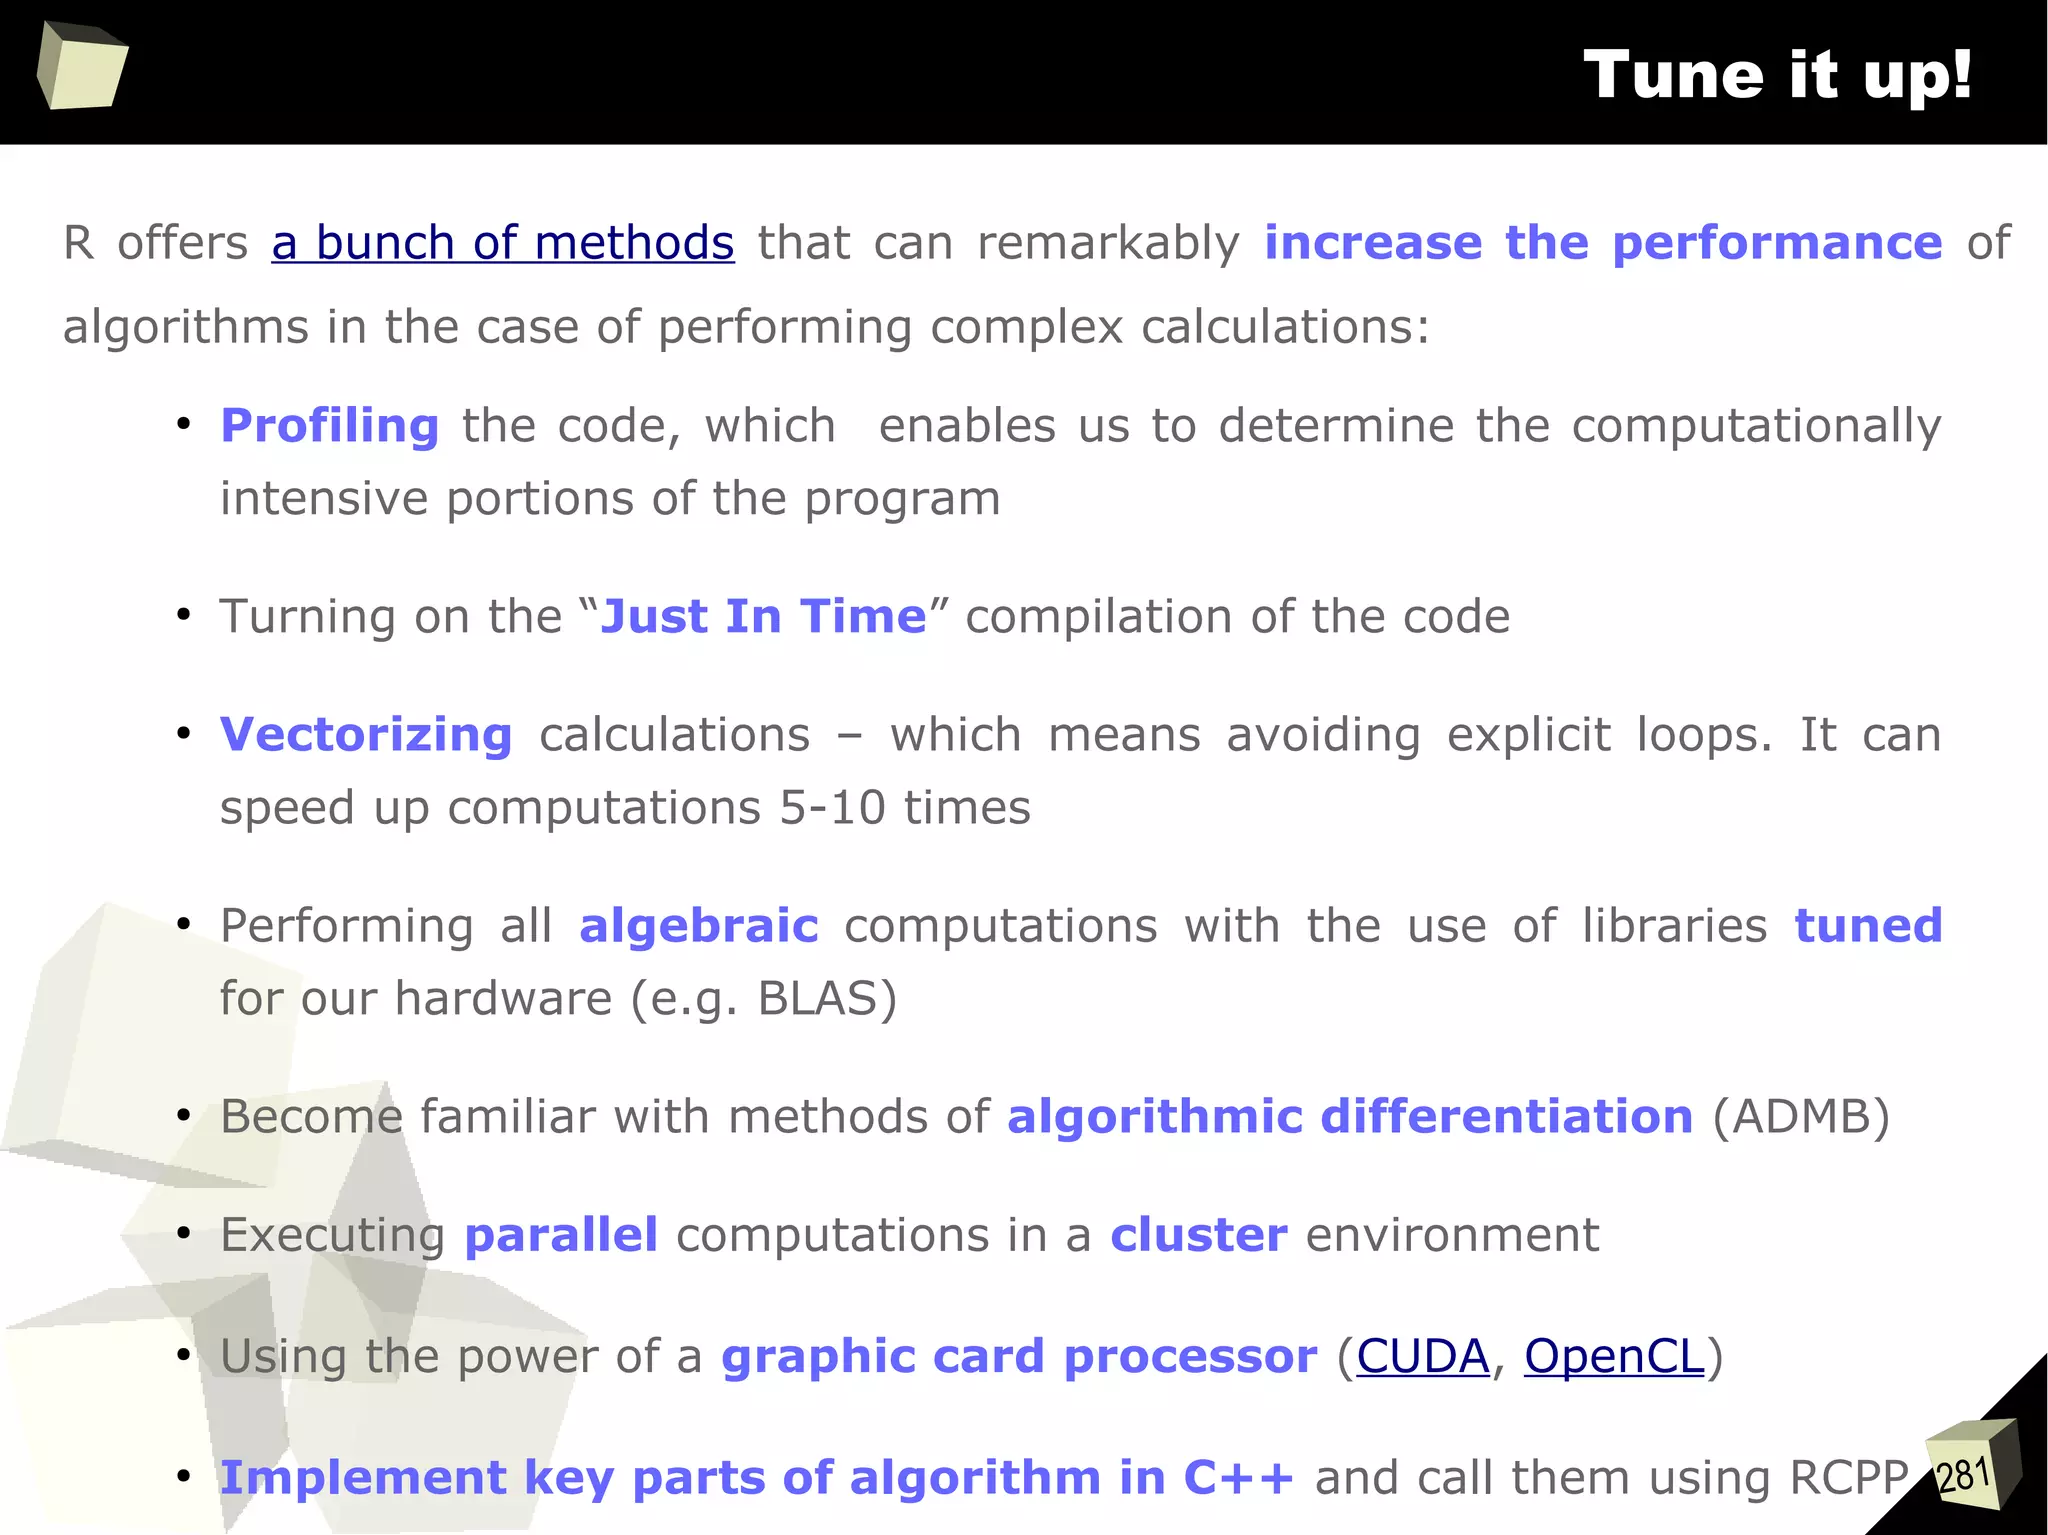
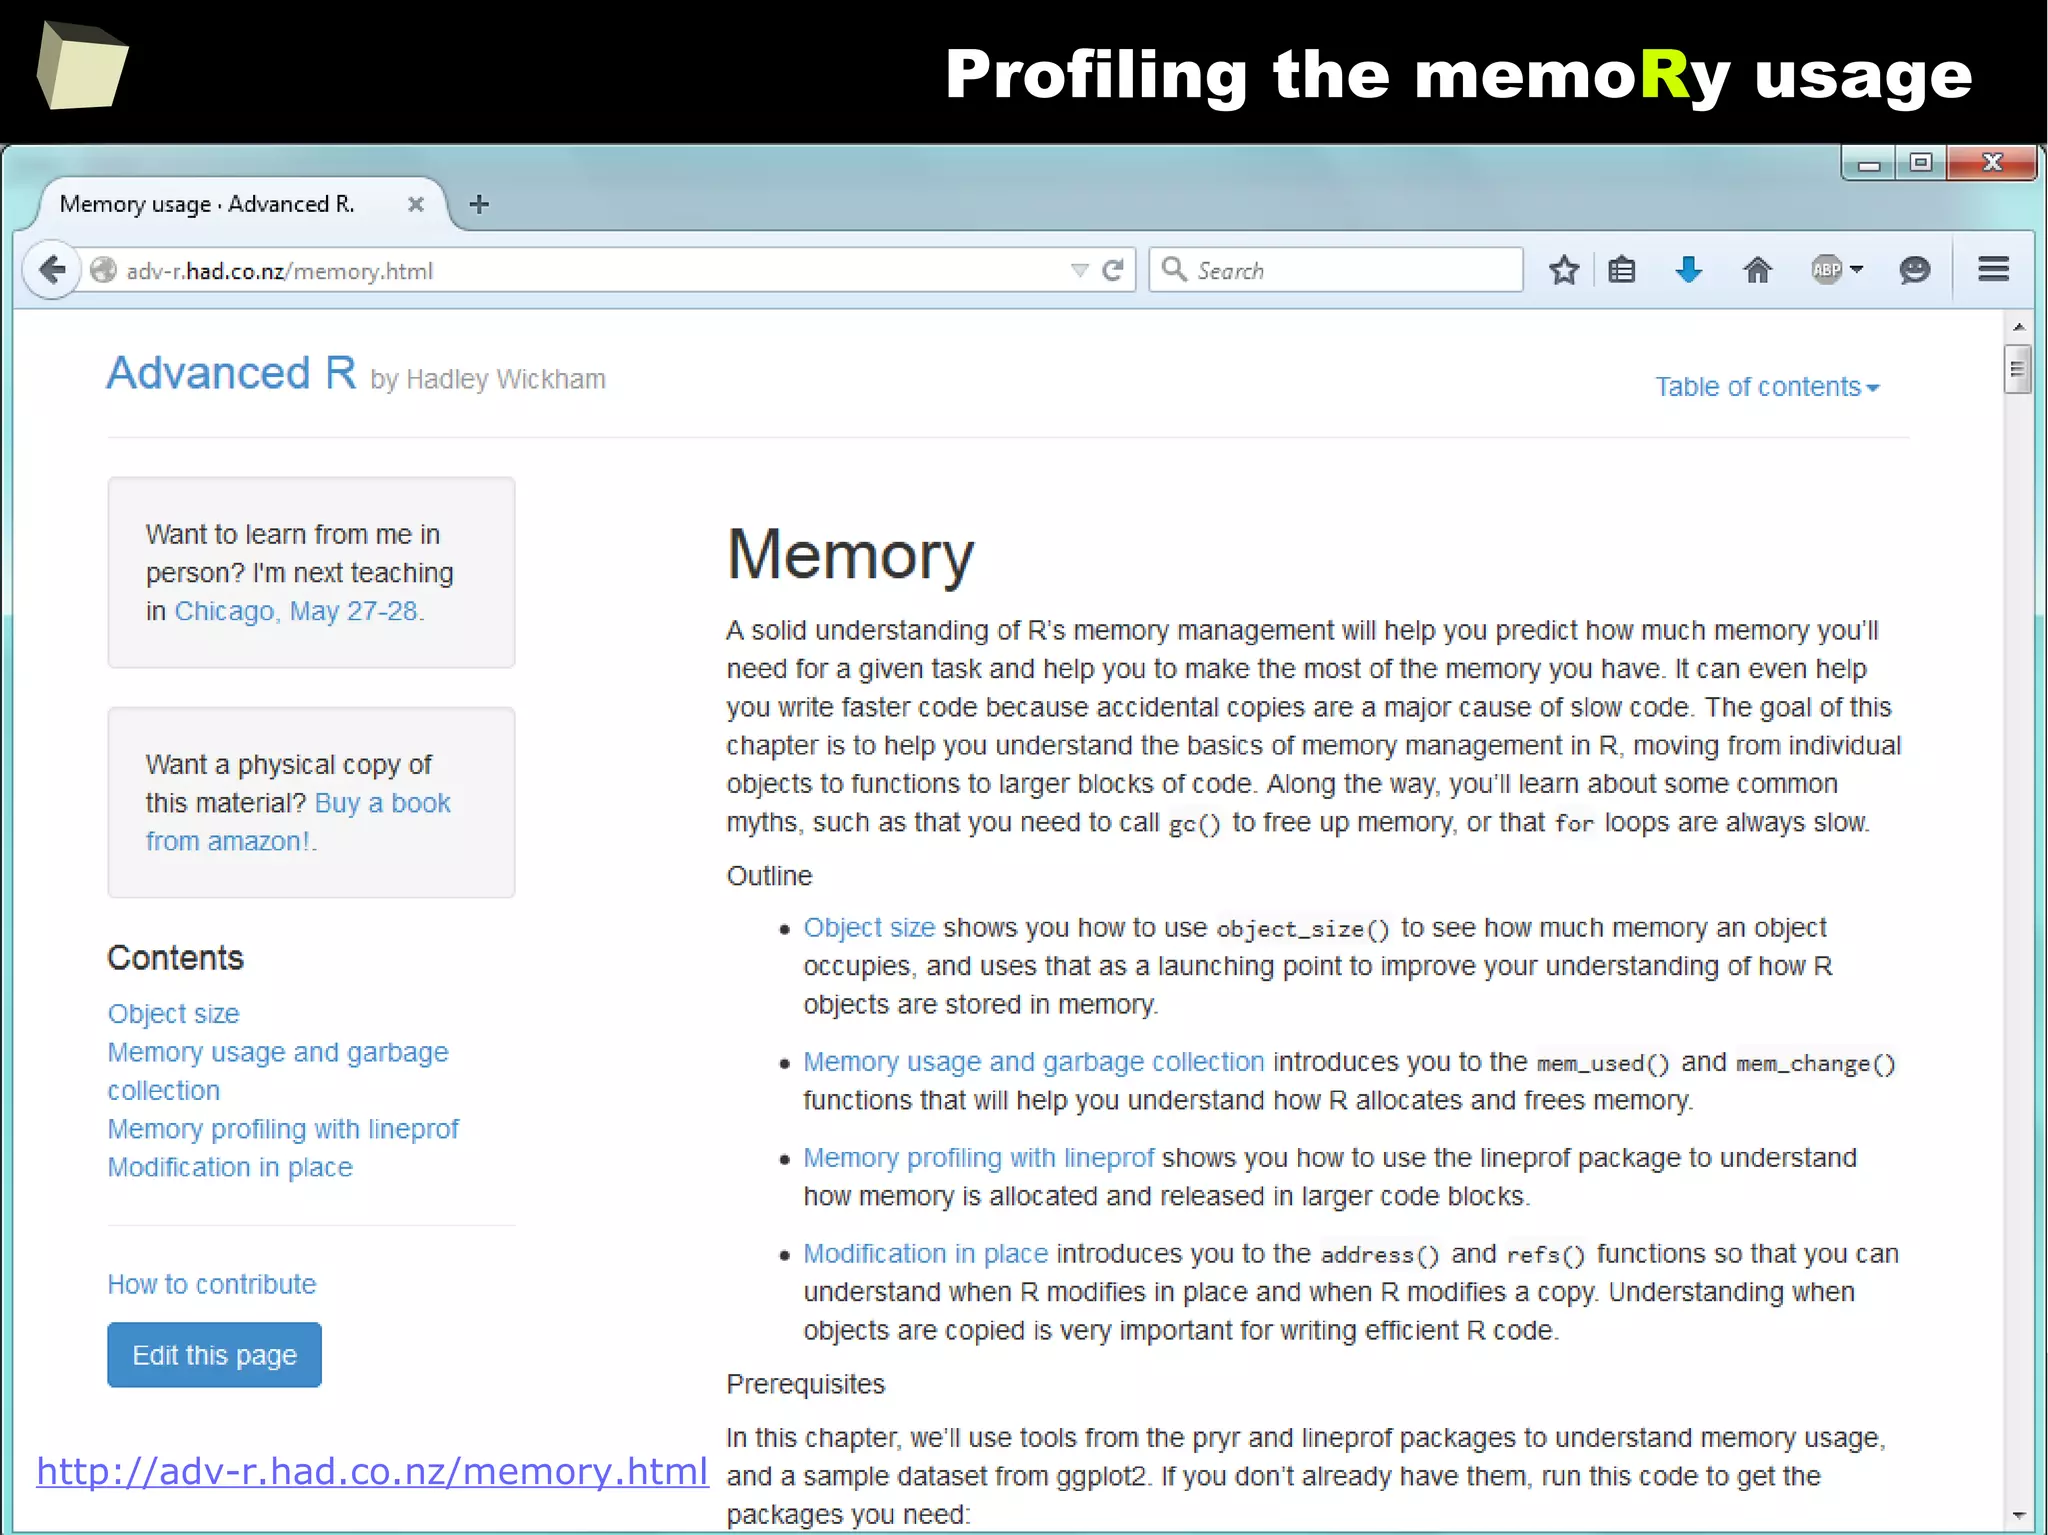
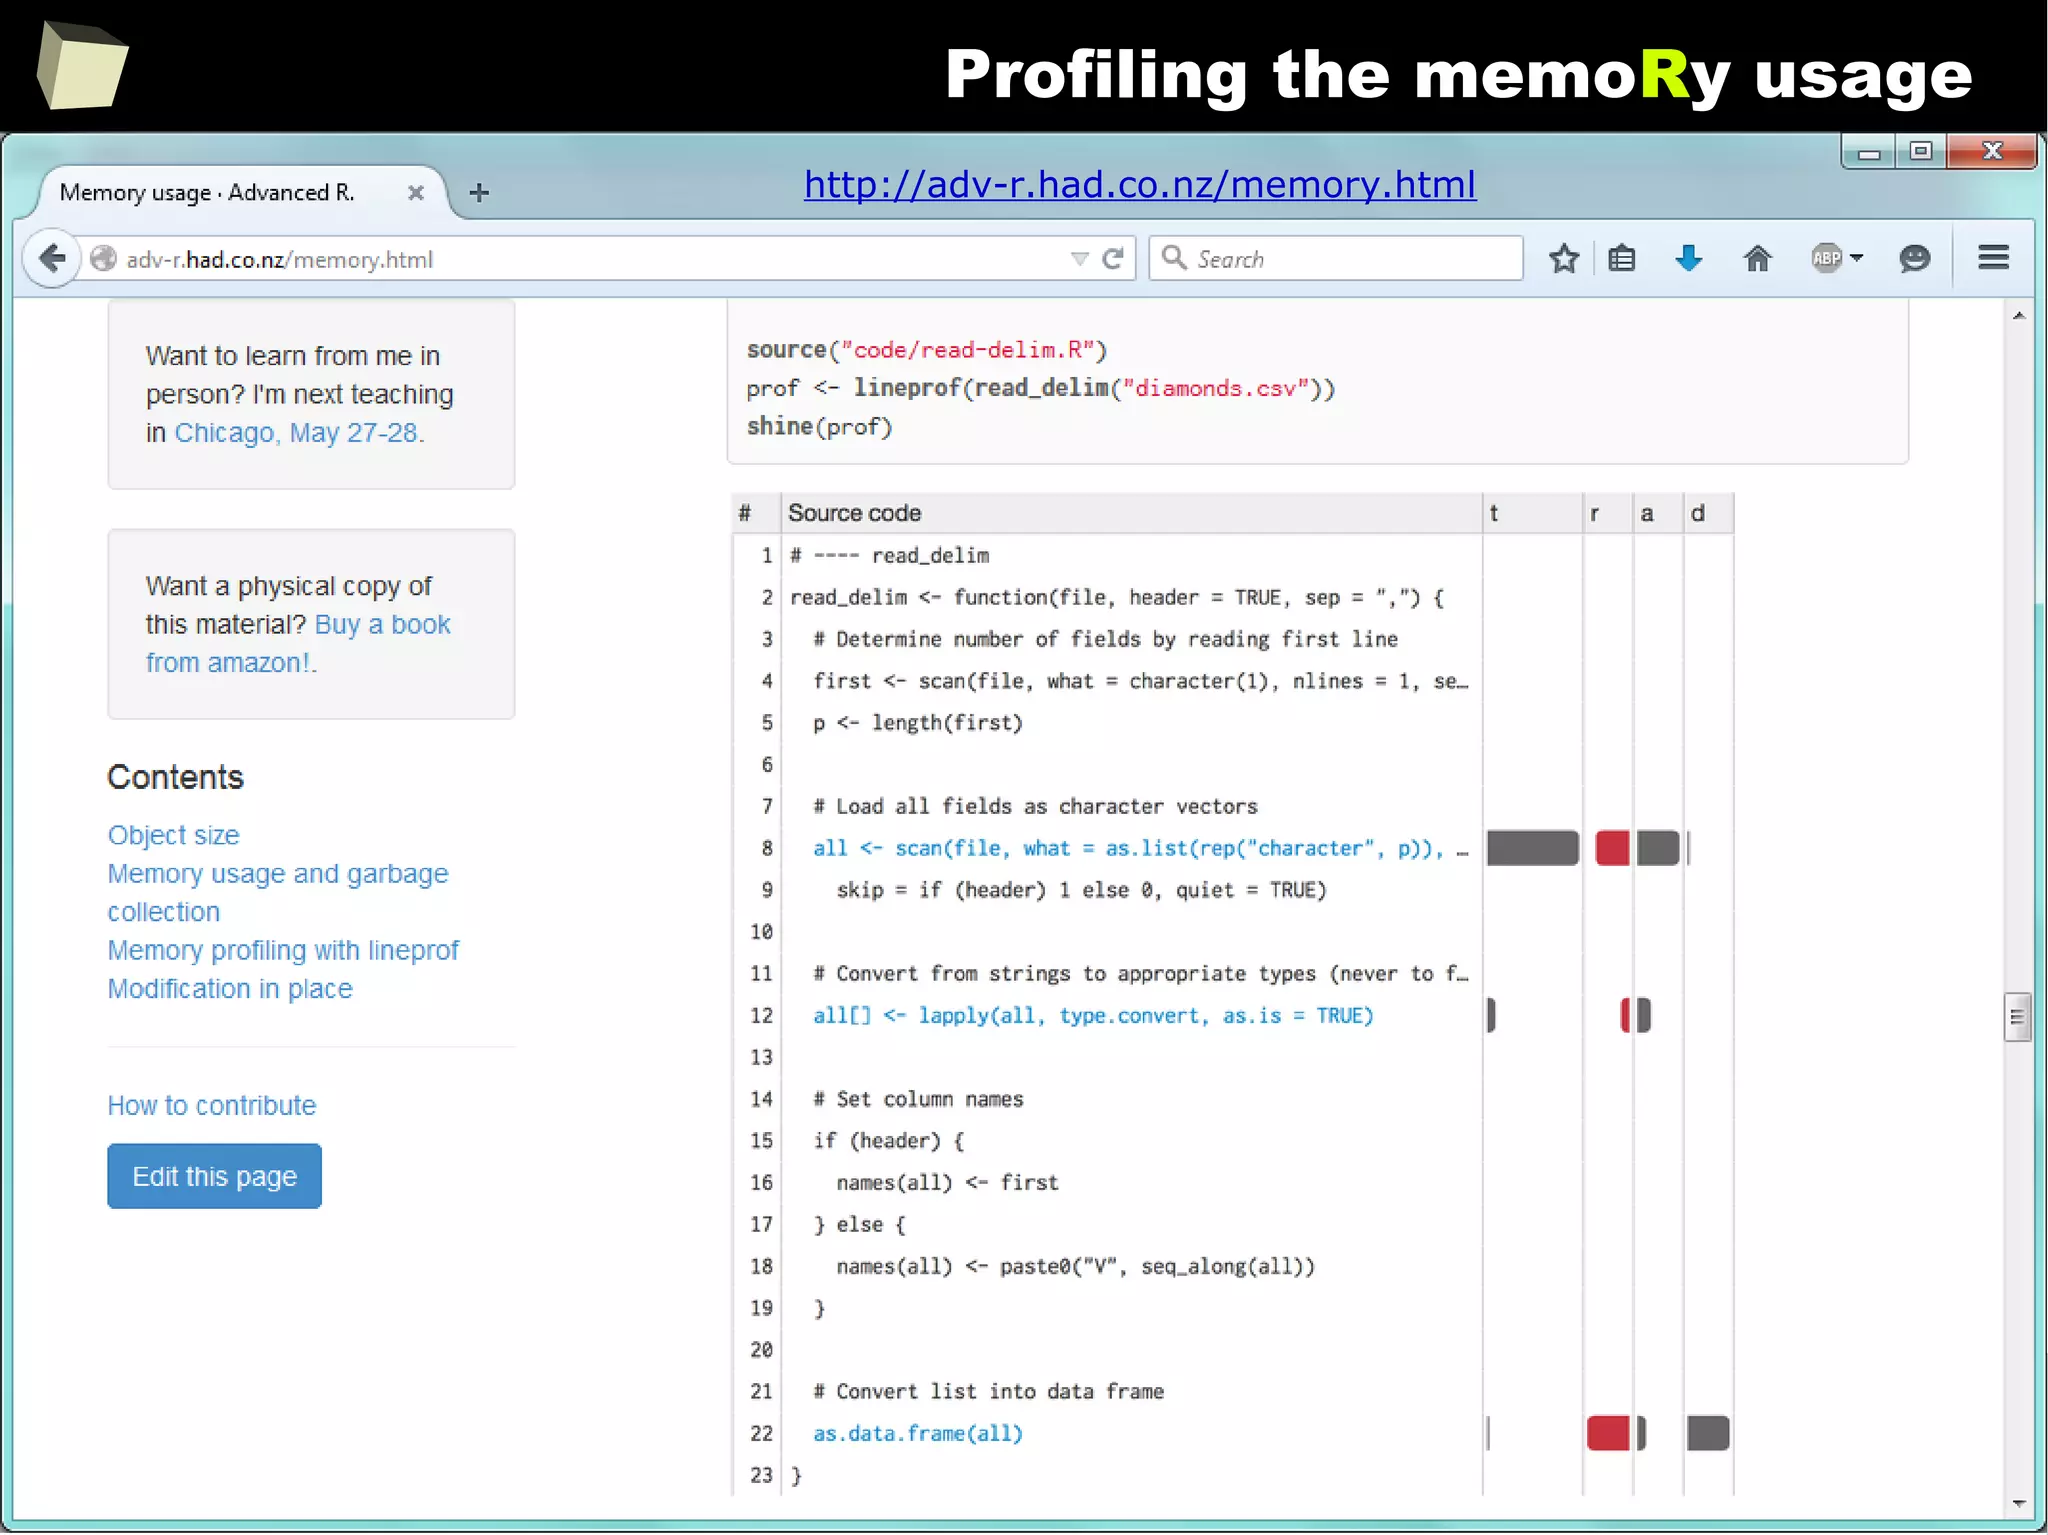
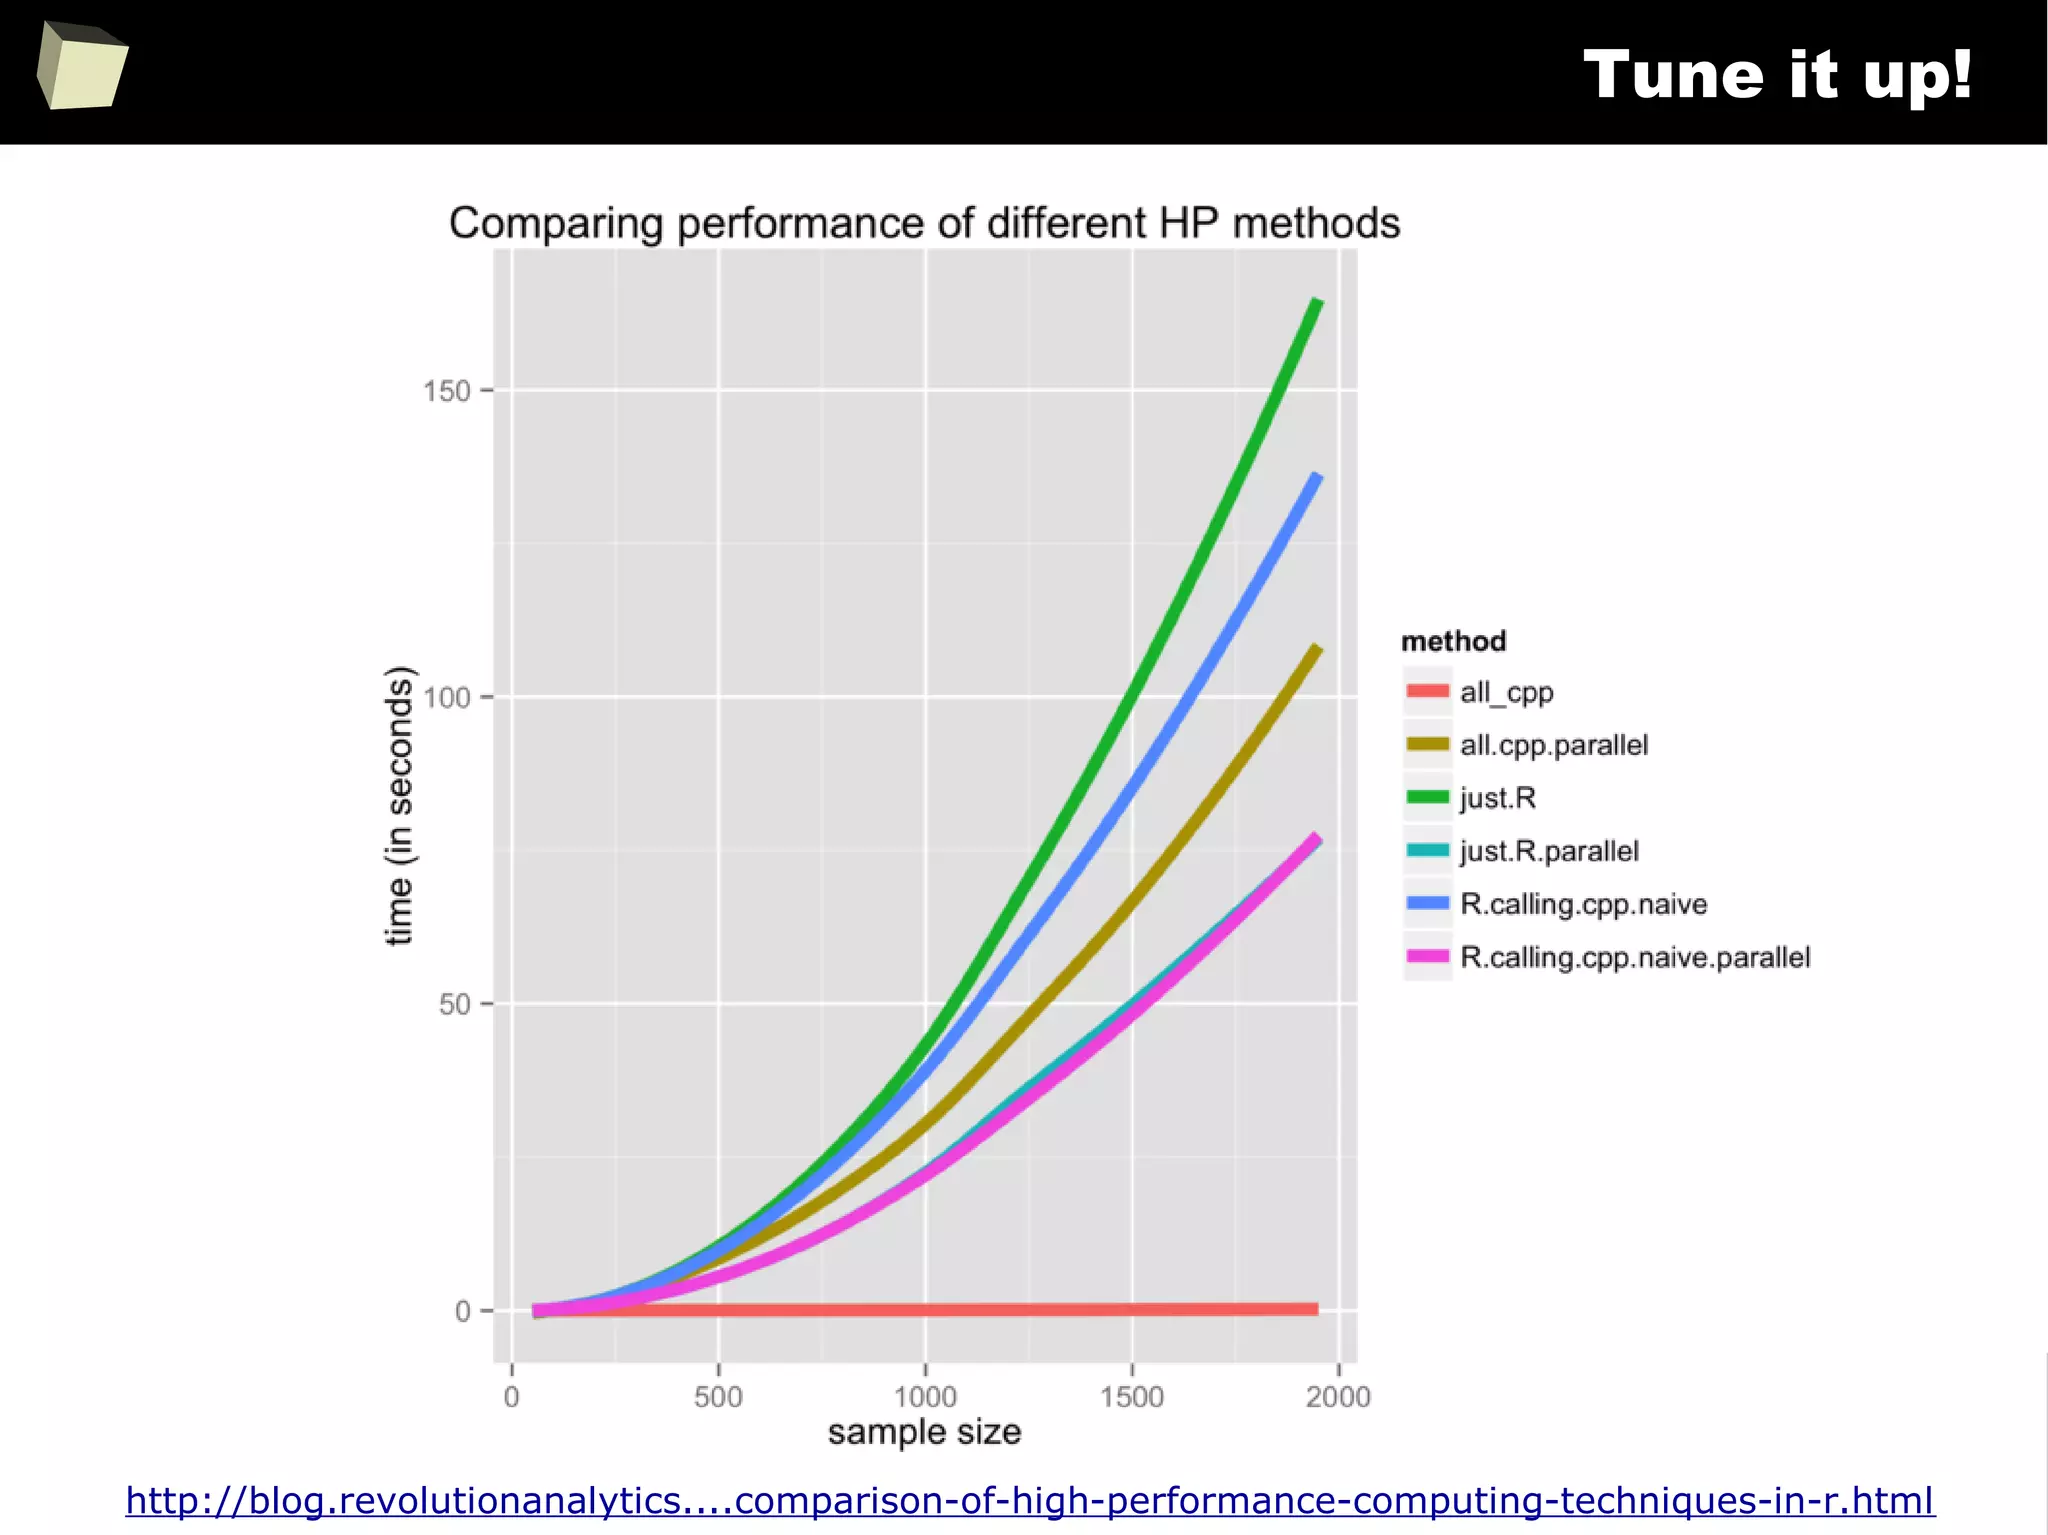
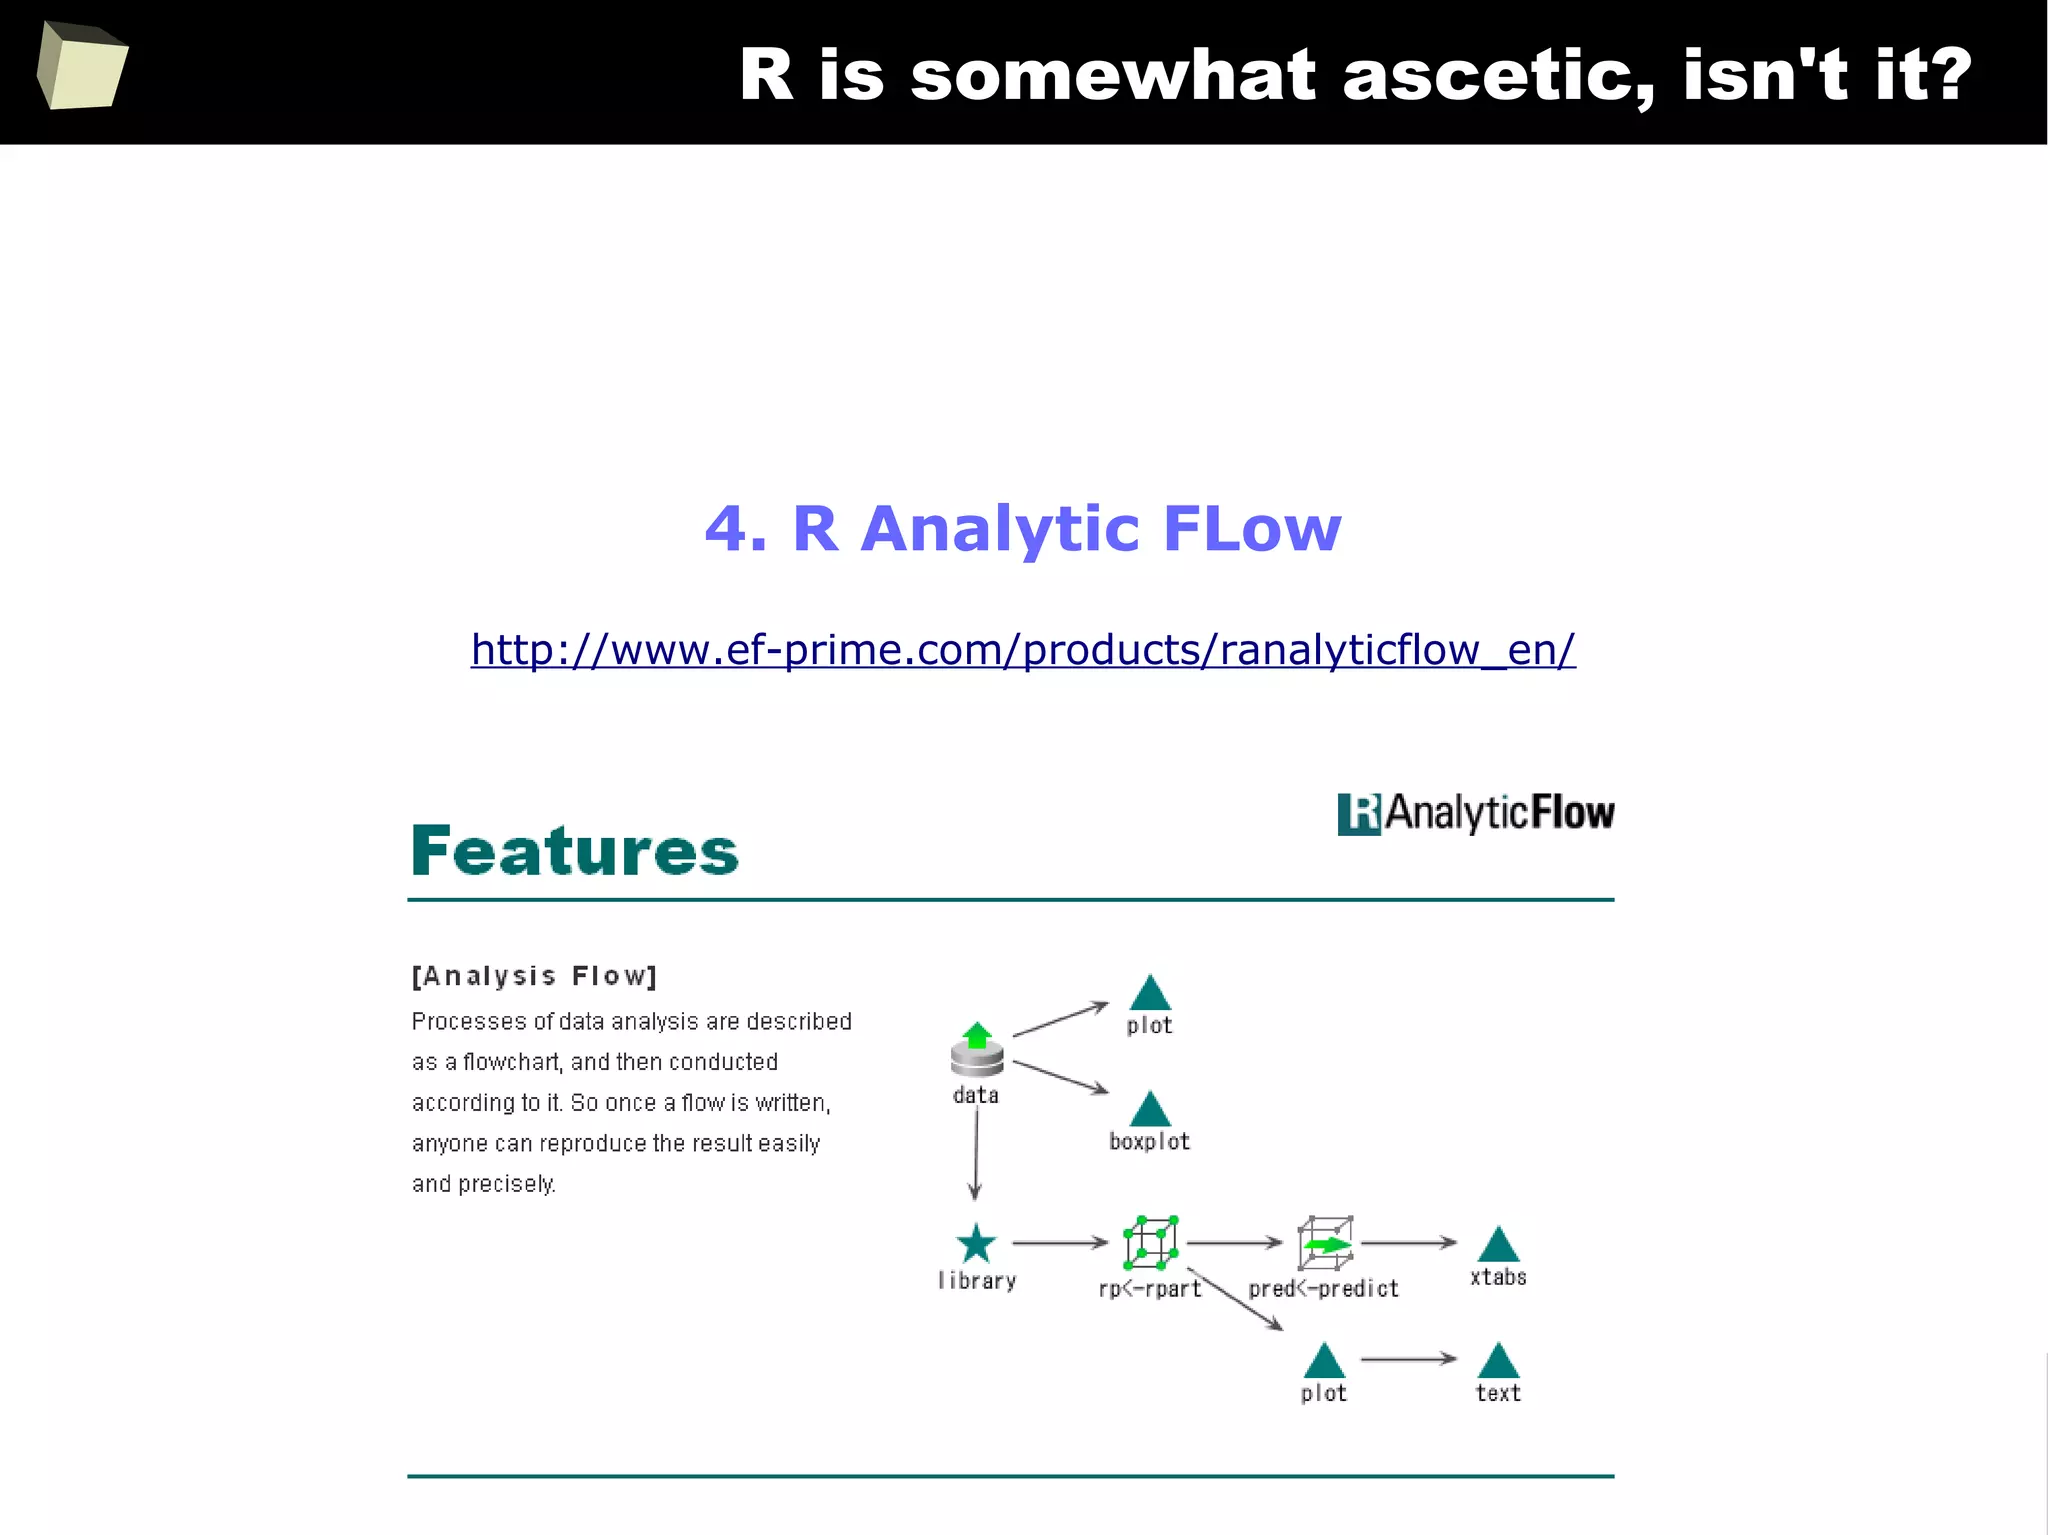
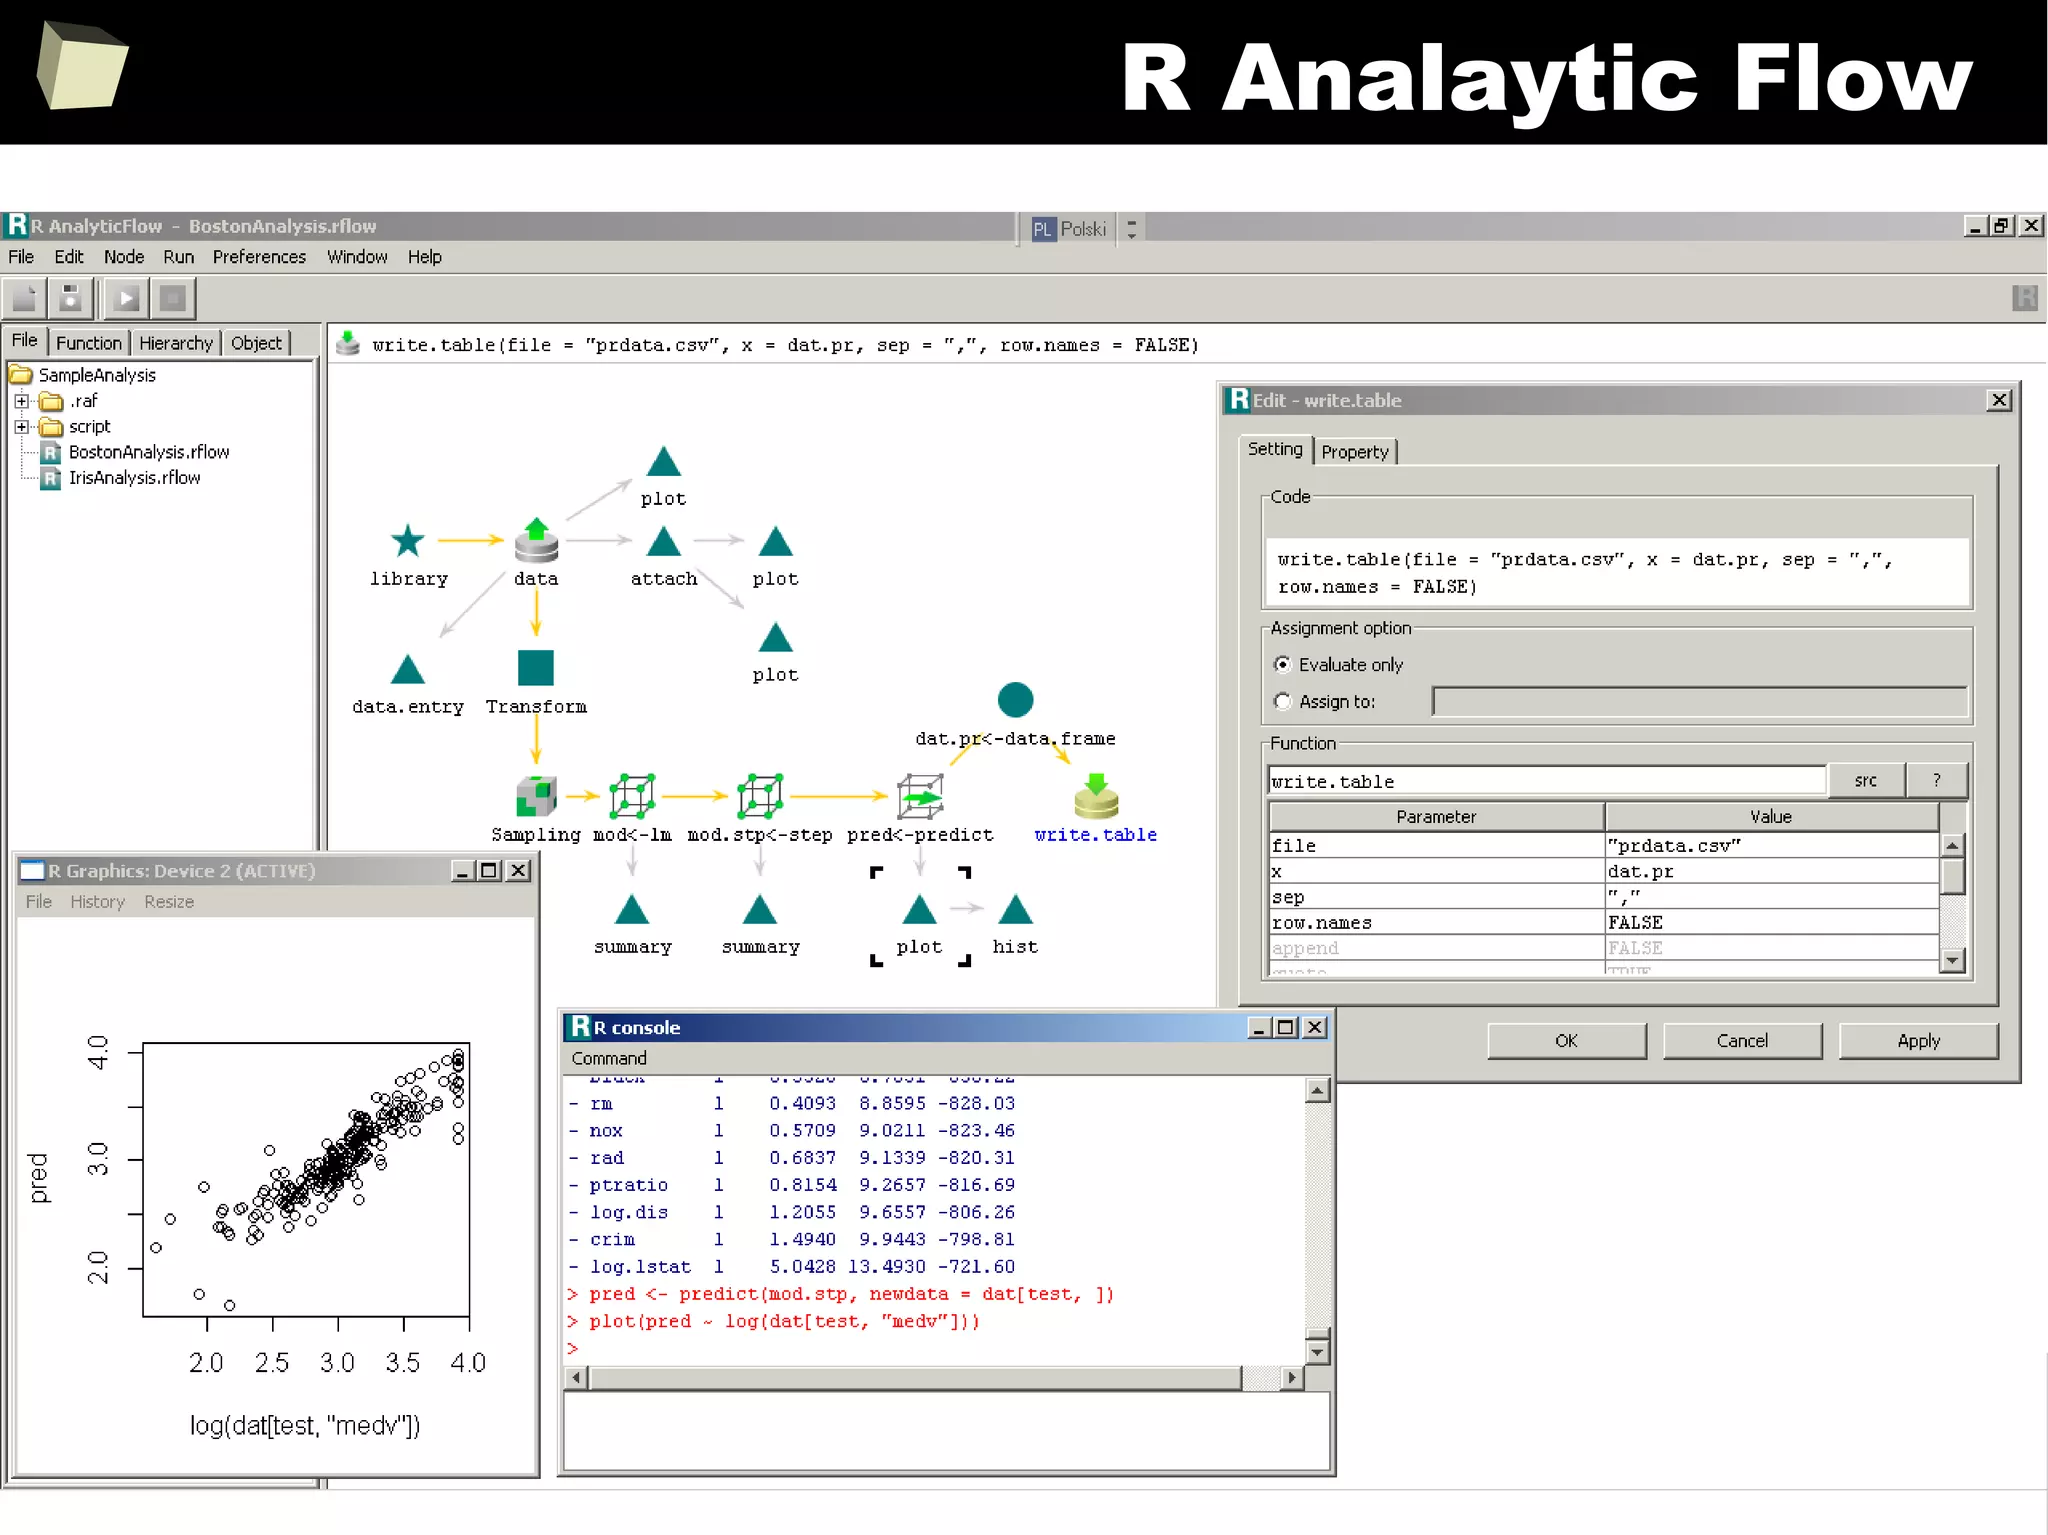
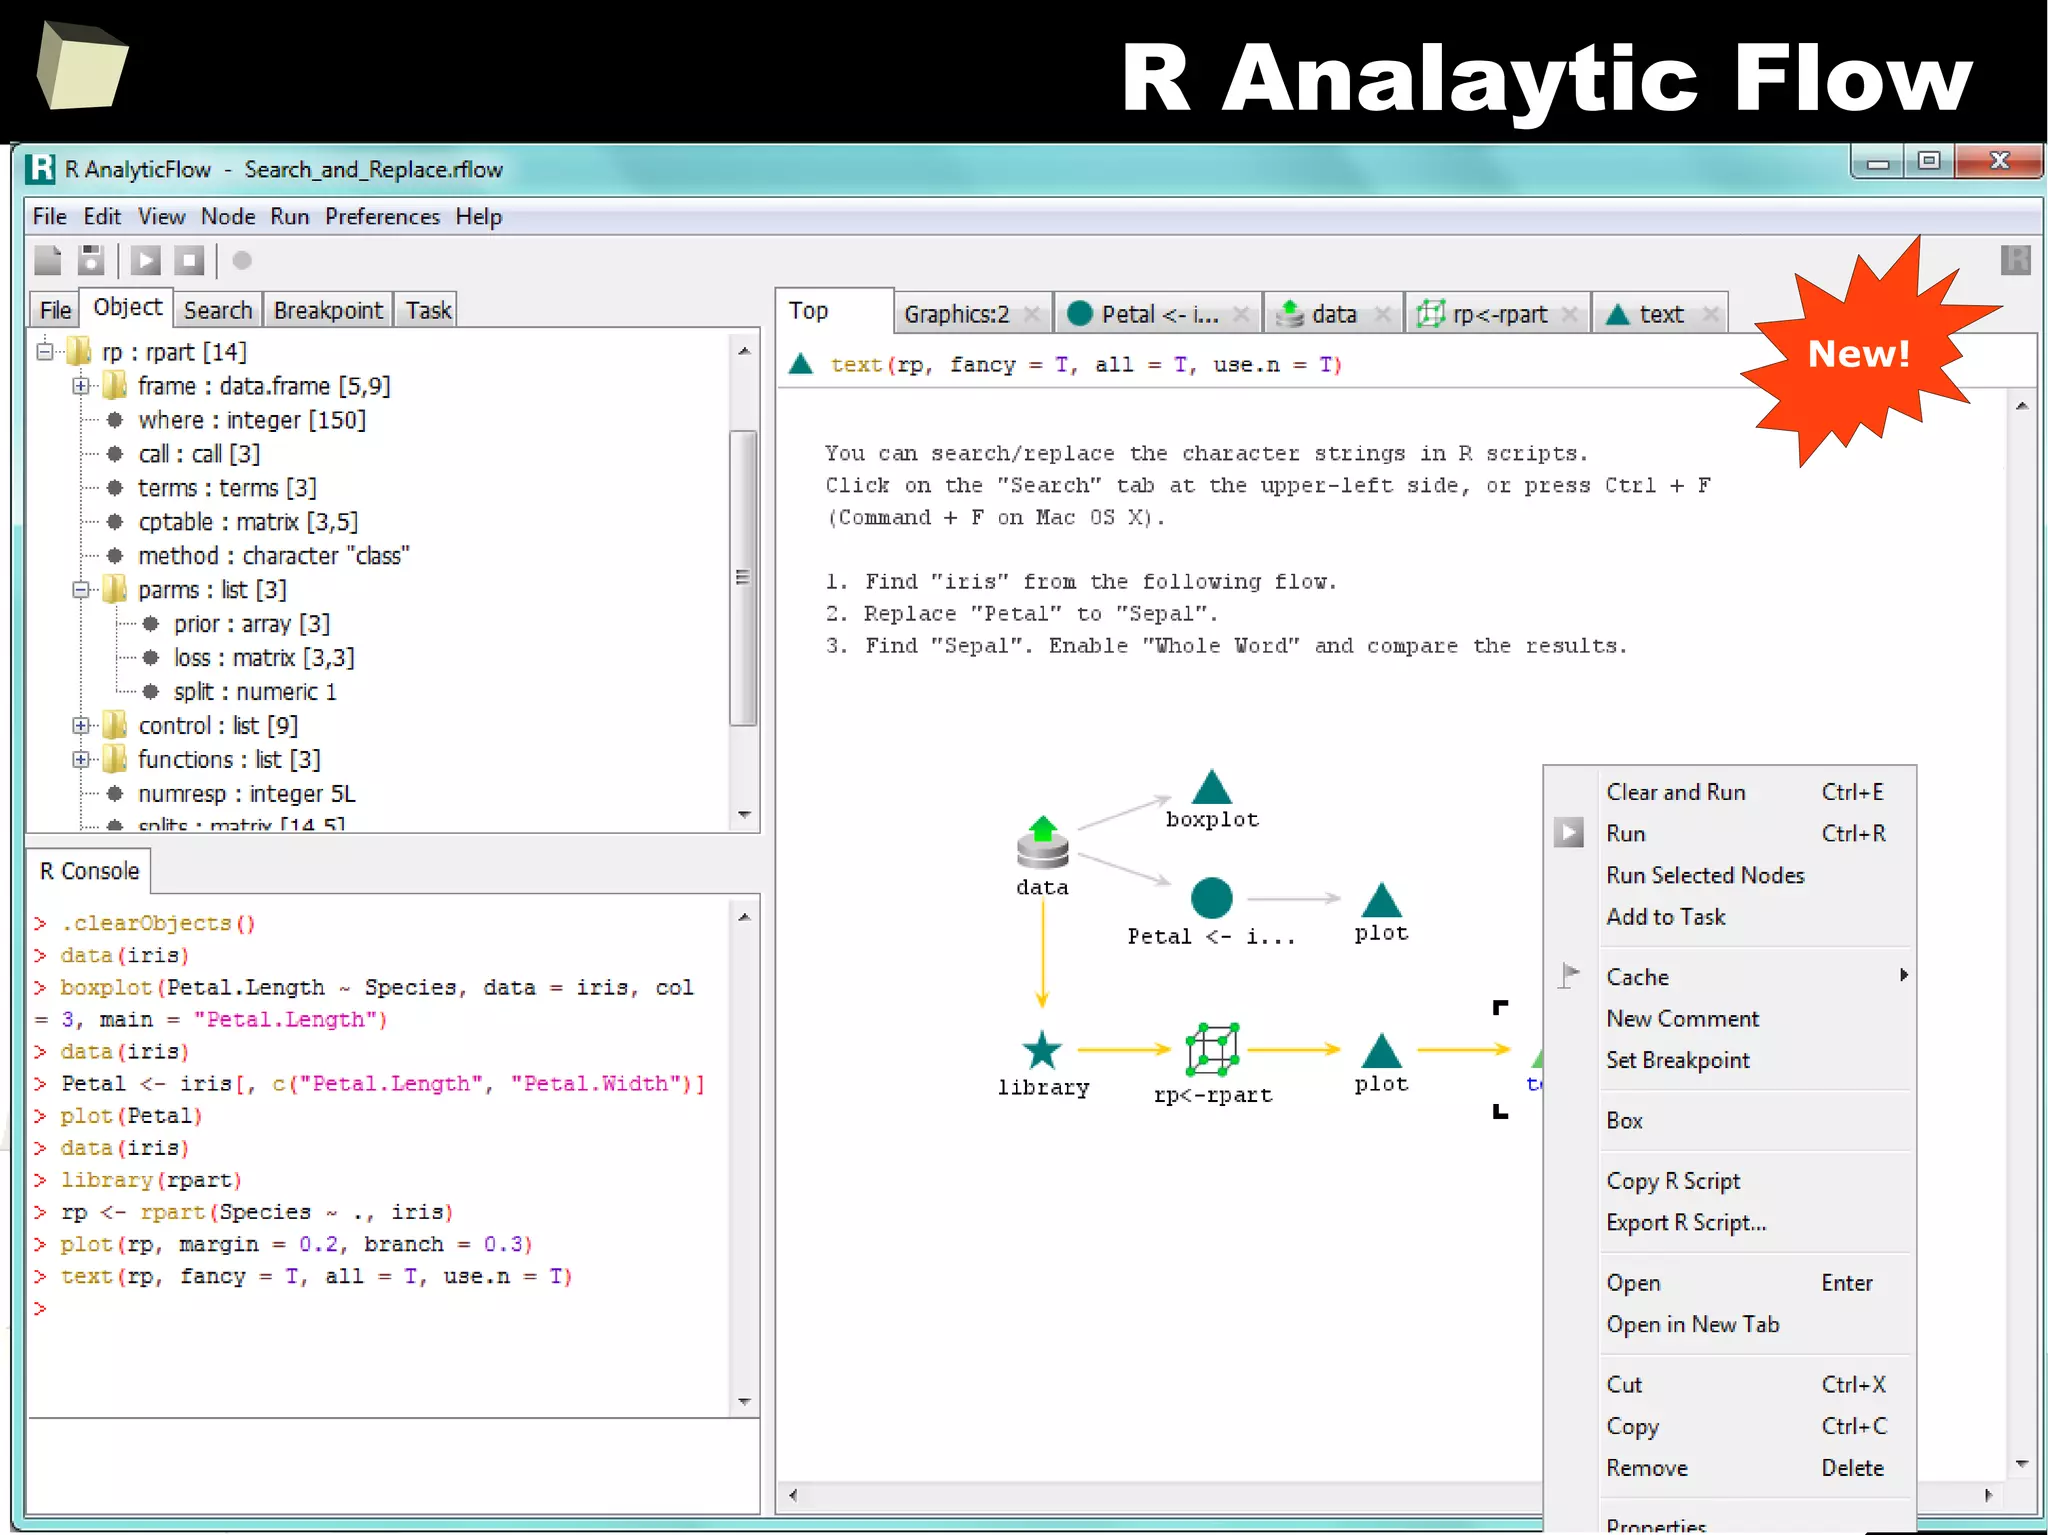
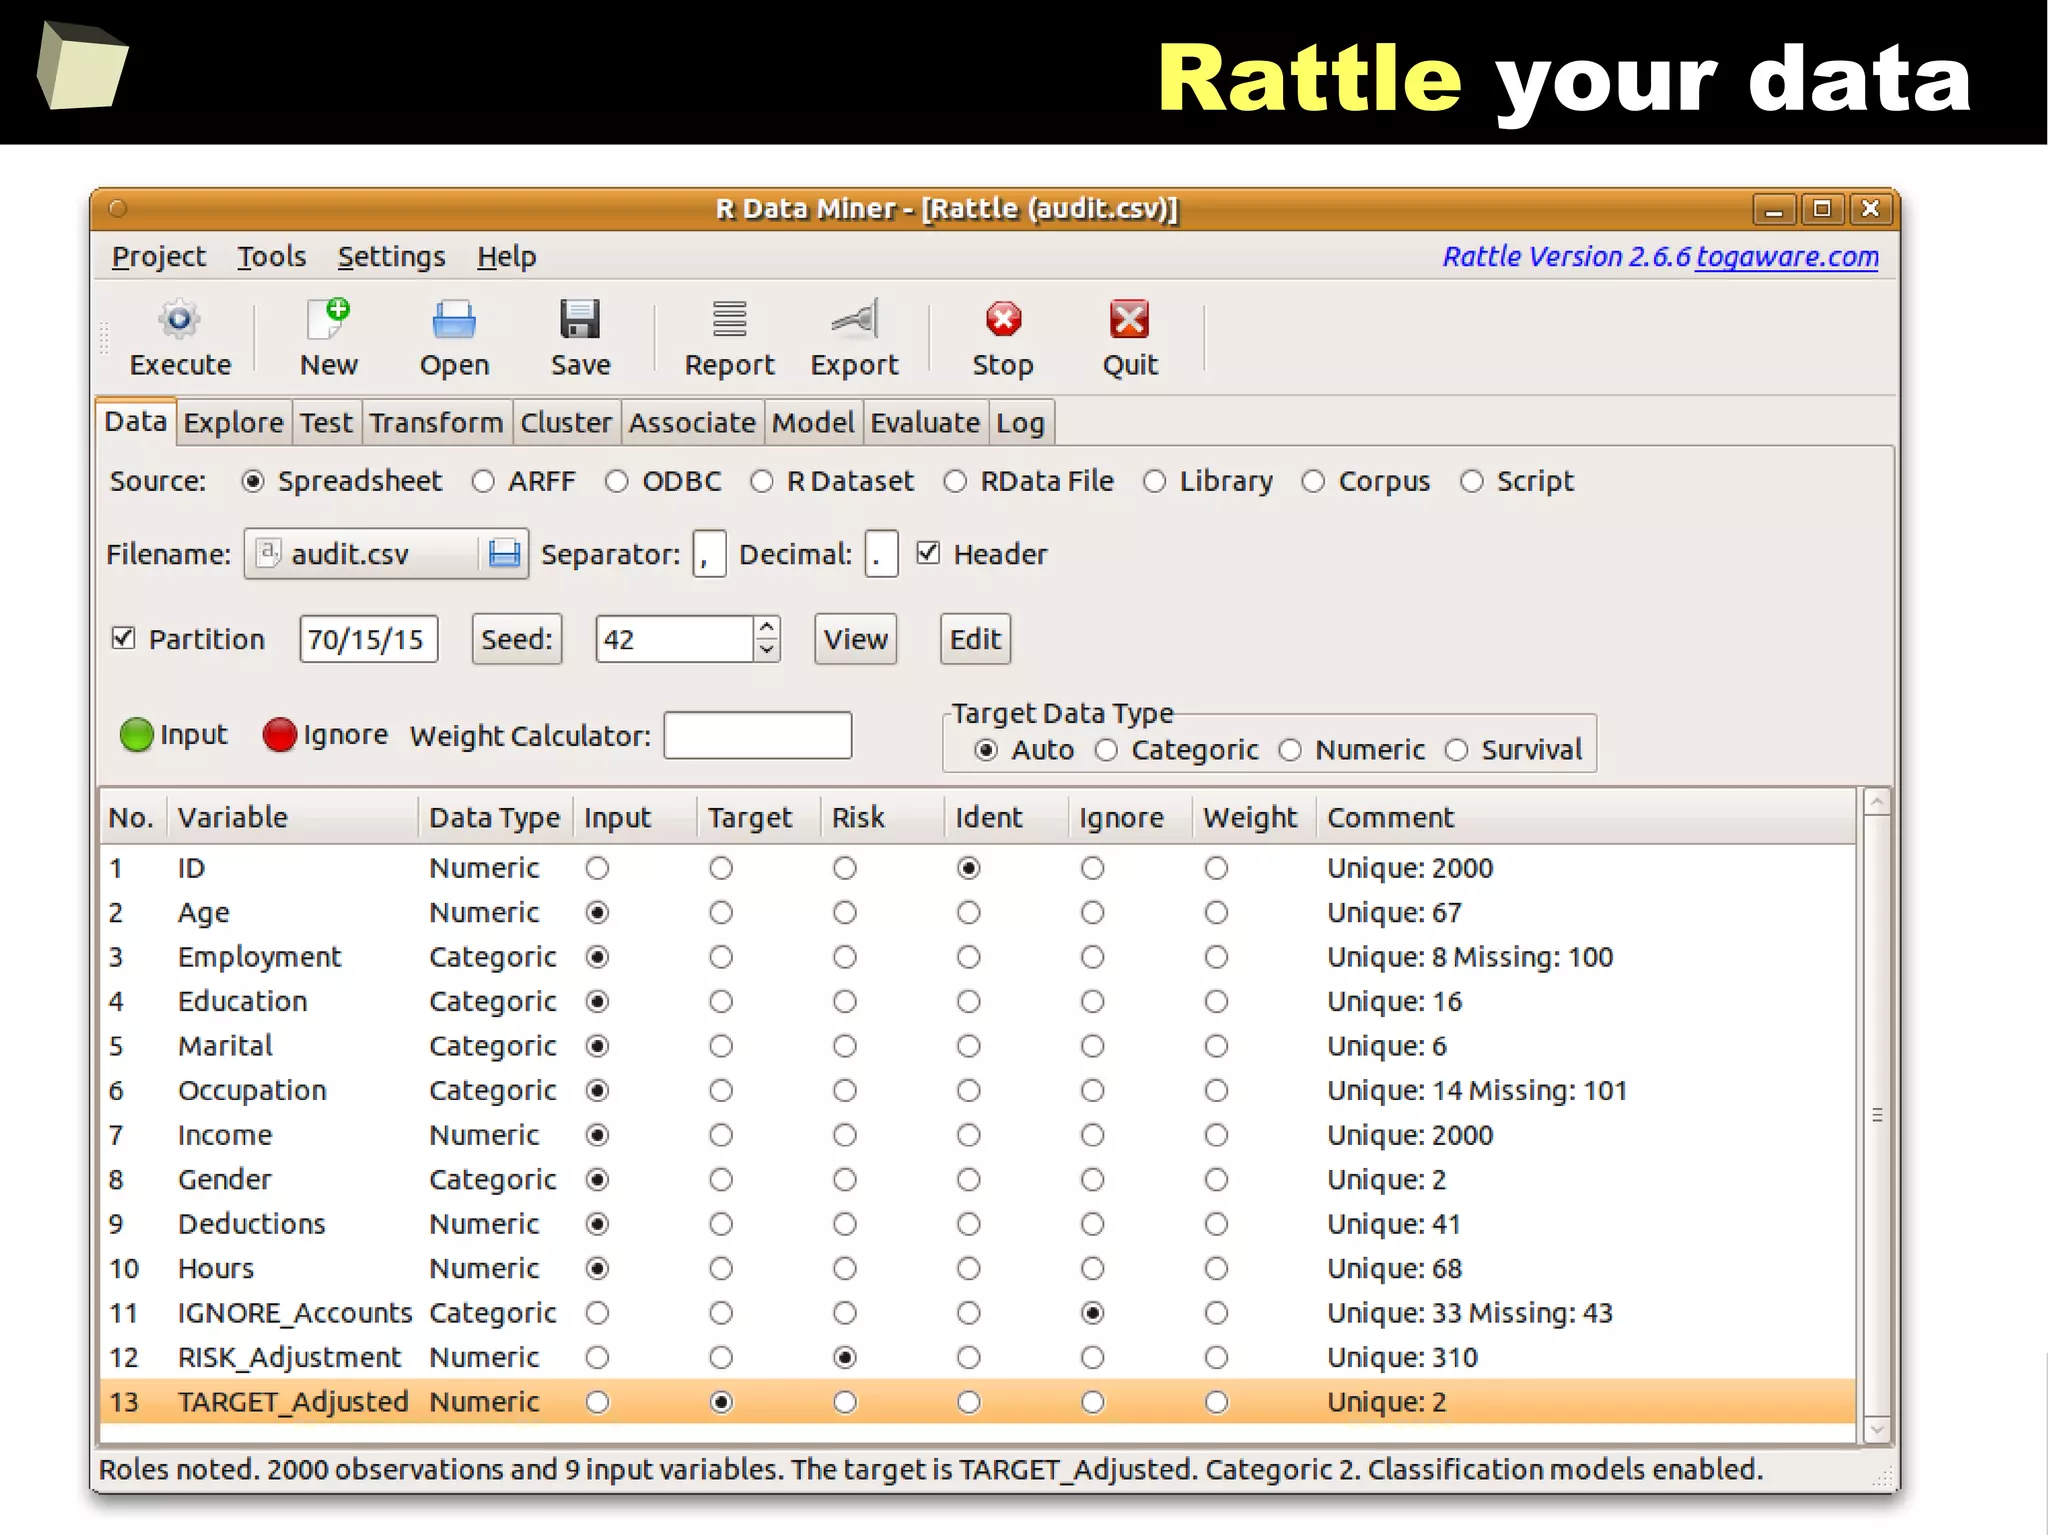
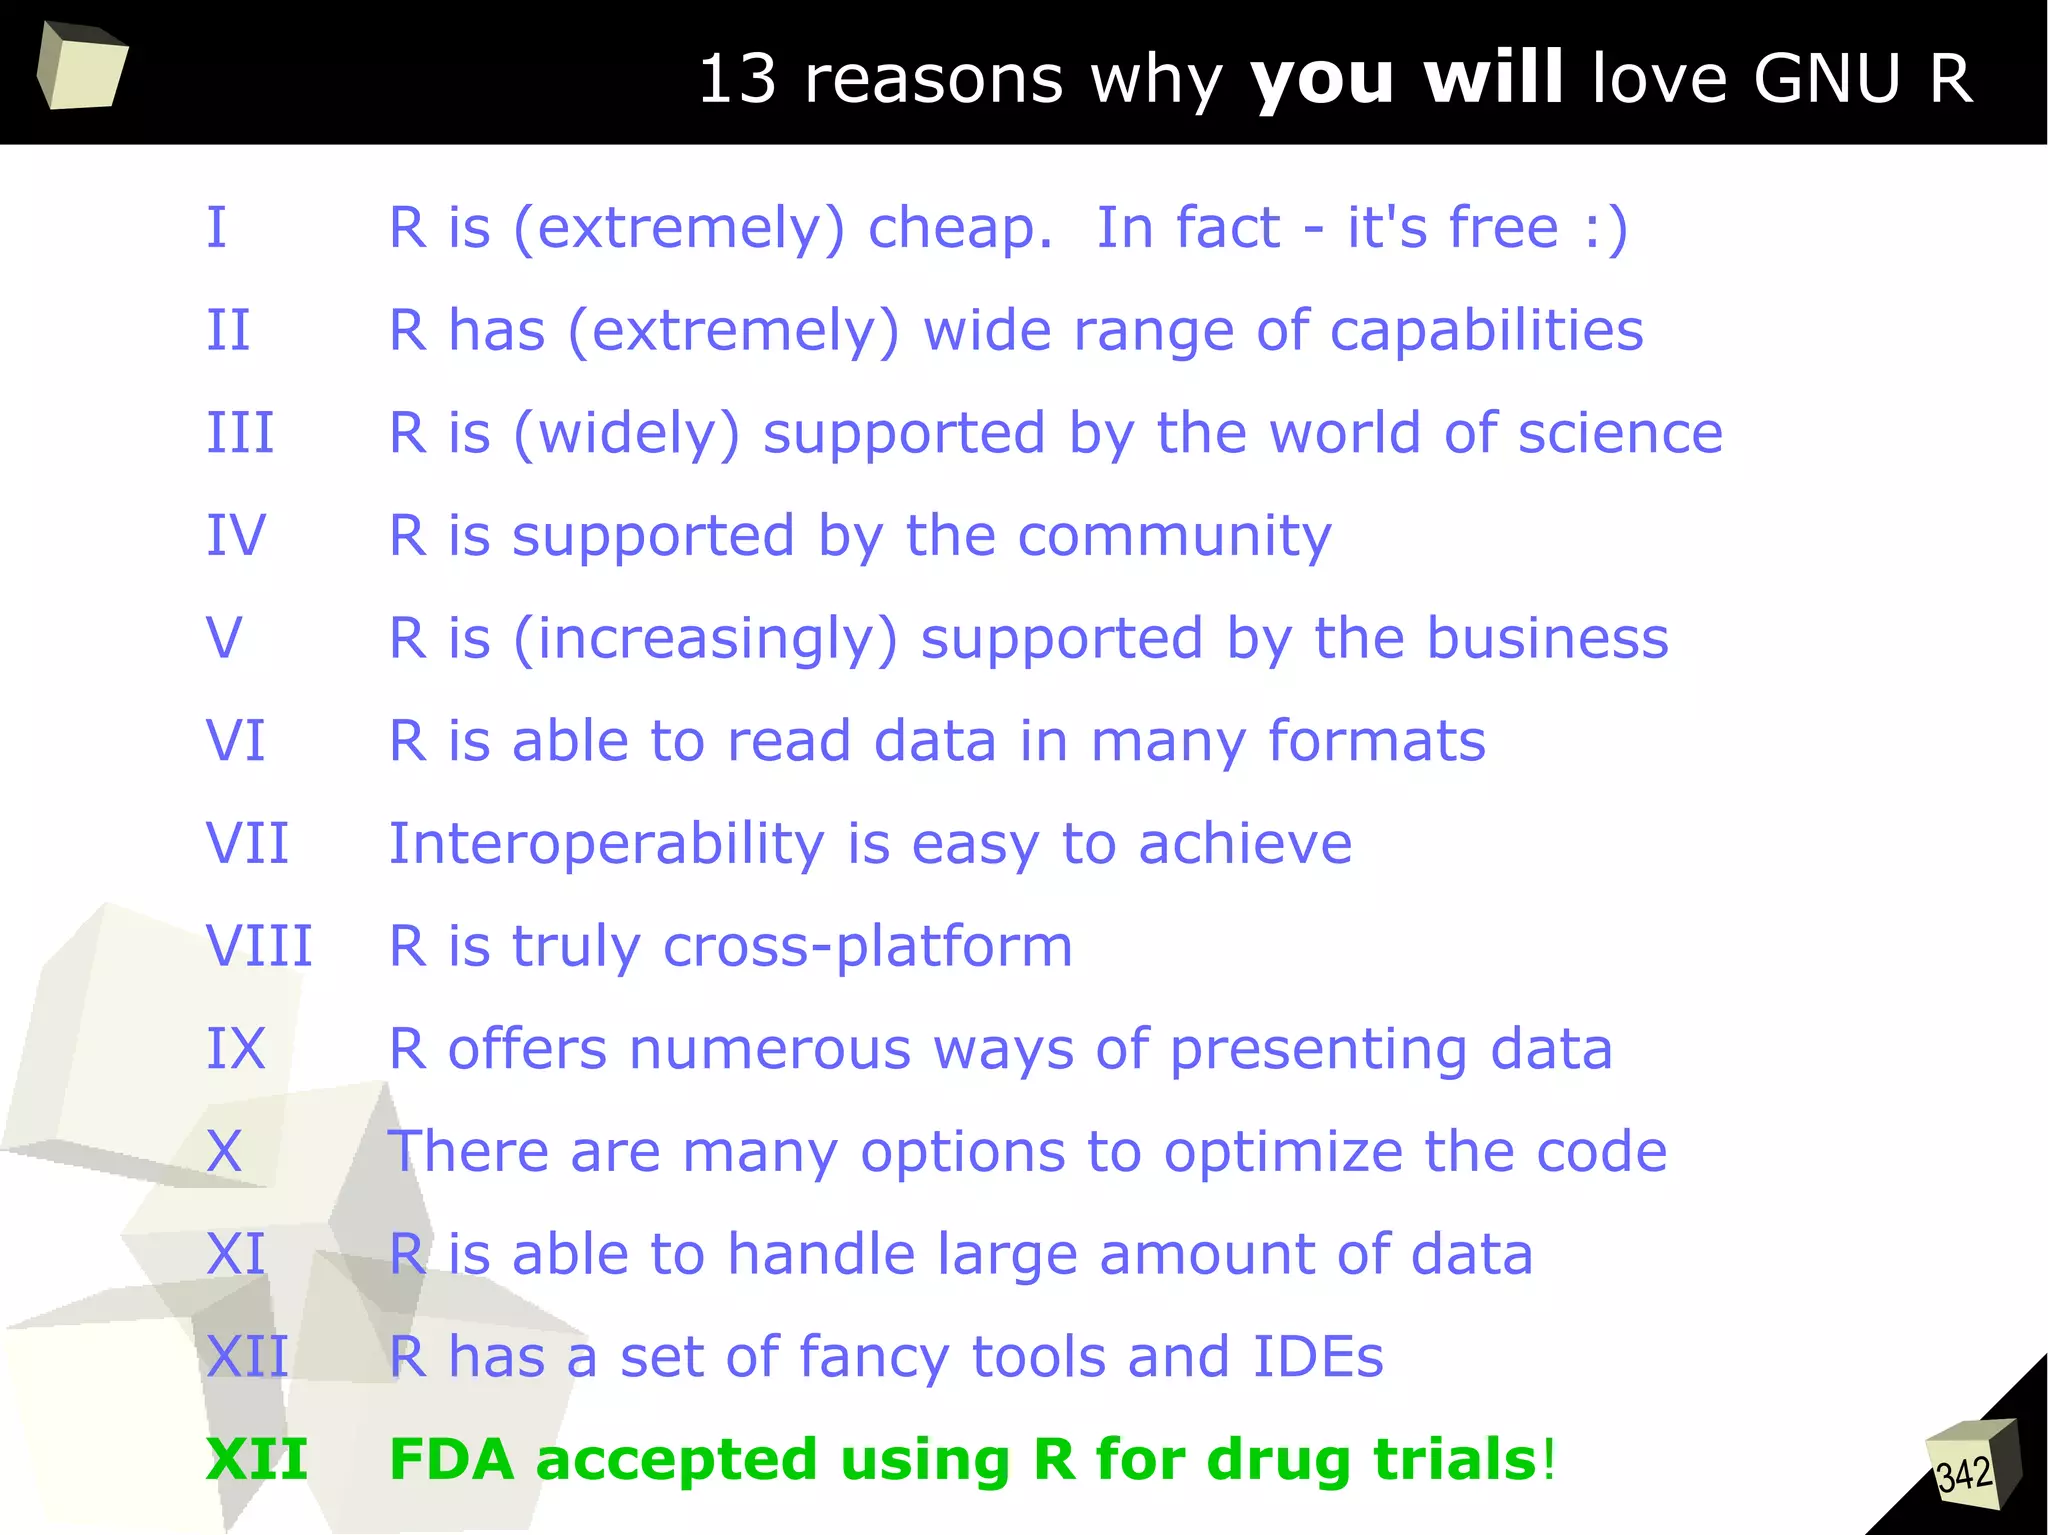
The document discusses the software R, emphasizing its suitability for biostatisticians in clinical research, its capabilities, and its growing popularity as a statistical tool in various domains. It highlights 13 reasons to love R, including its cost-effectiveness, extensive capabilities, and support within the scientific and business communities. Additionally, it presents a list of organizations that utilize R and emphasizes its use in drug trials and clinical research analyses.


![9
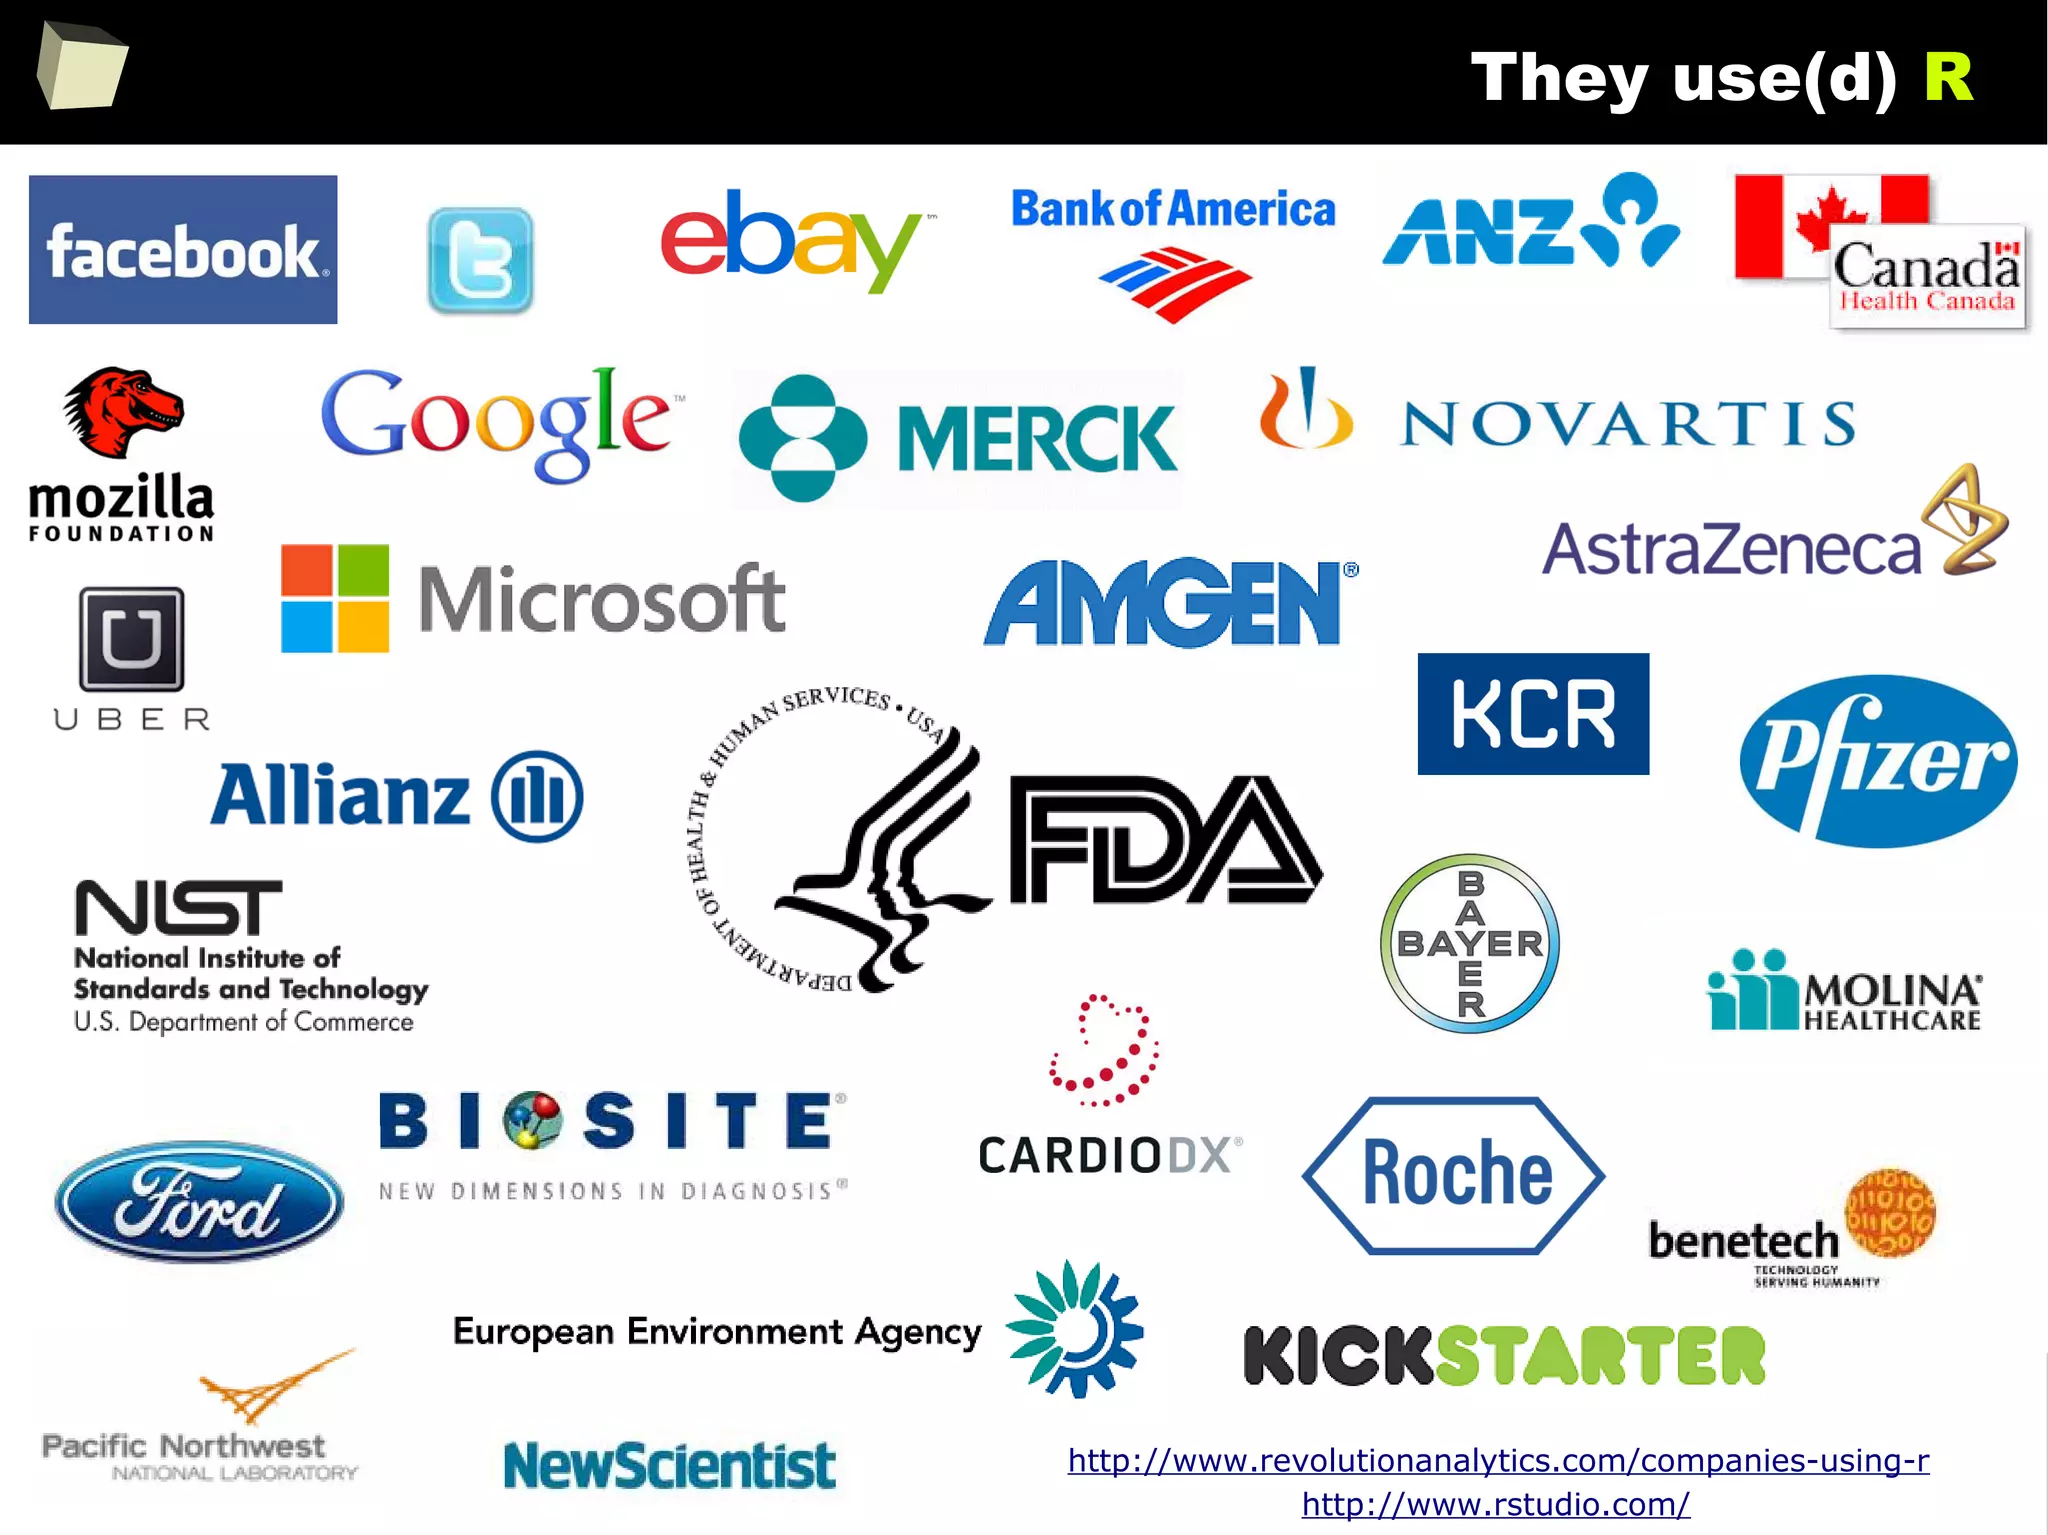
is it a popular softwaRe ?
[…] R is also the name of a popular programming language used by
a growing number of data analysts inside corporations and
academia. It is becoming their lingua franca partly because data
mining has entered a golden age, whether being used to set ad
prices, find new drugs more quickly or fine-tune financial models.
Companies as diverse as Google, Pfizer, Merck, Bank of America,
the InterContinental Hotels Group and Shell use it.
Data Analysts Captivated by R’s Power (The New York Times)
http://tinyurl.com/captivated-by-r](https://image.slidesharecdn.com/is-r-suitable-enough-for-clinical-research-160113193220/75/GNU-R-in-Clinical-Research-and-Evidence-Based-Medicine-9-2048.jpg)


![56
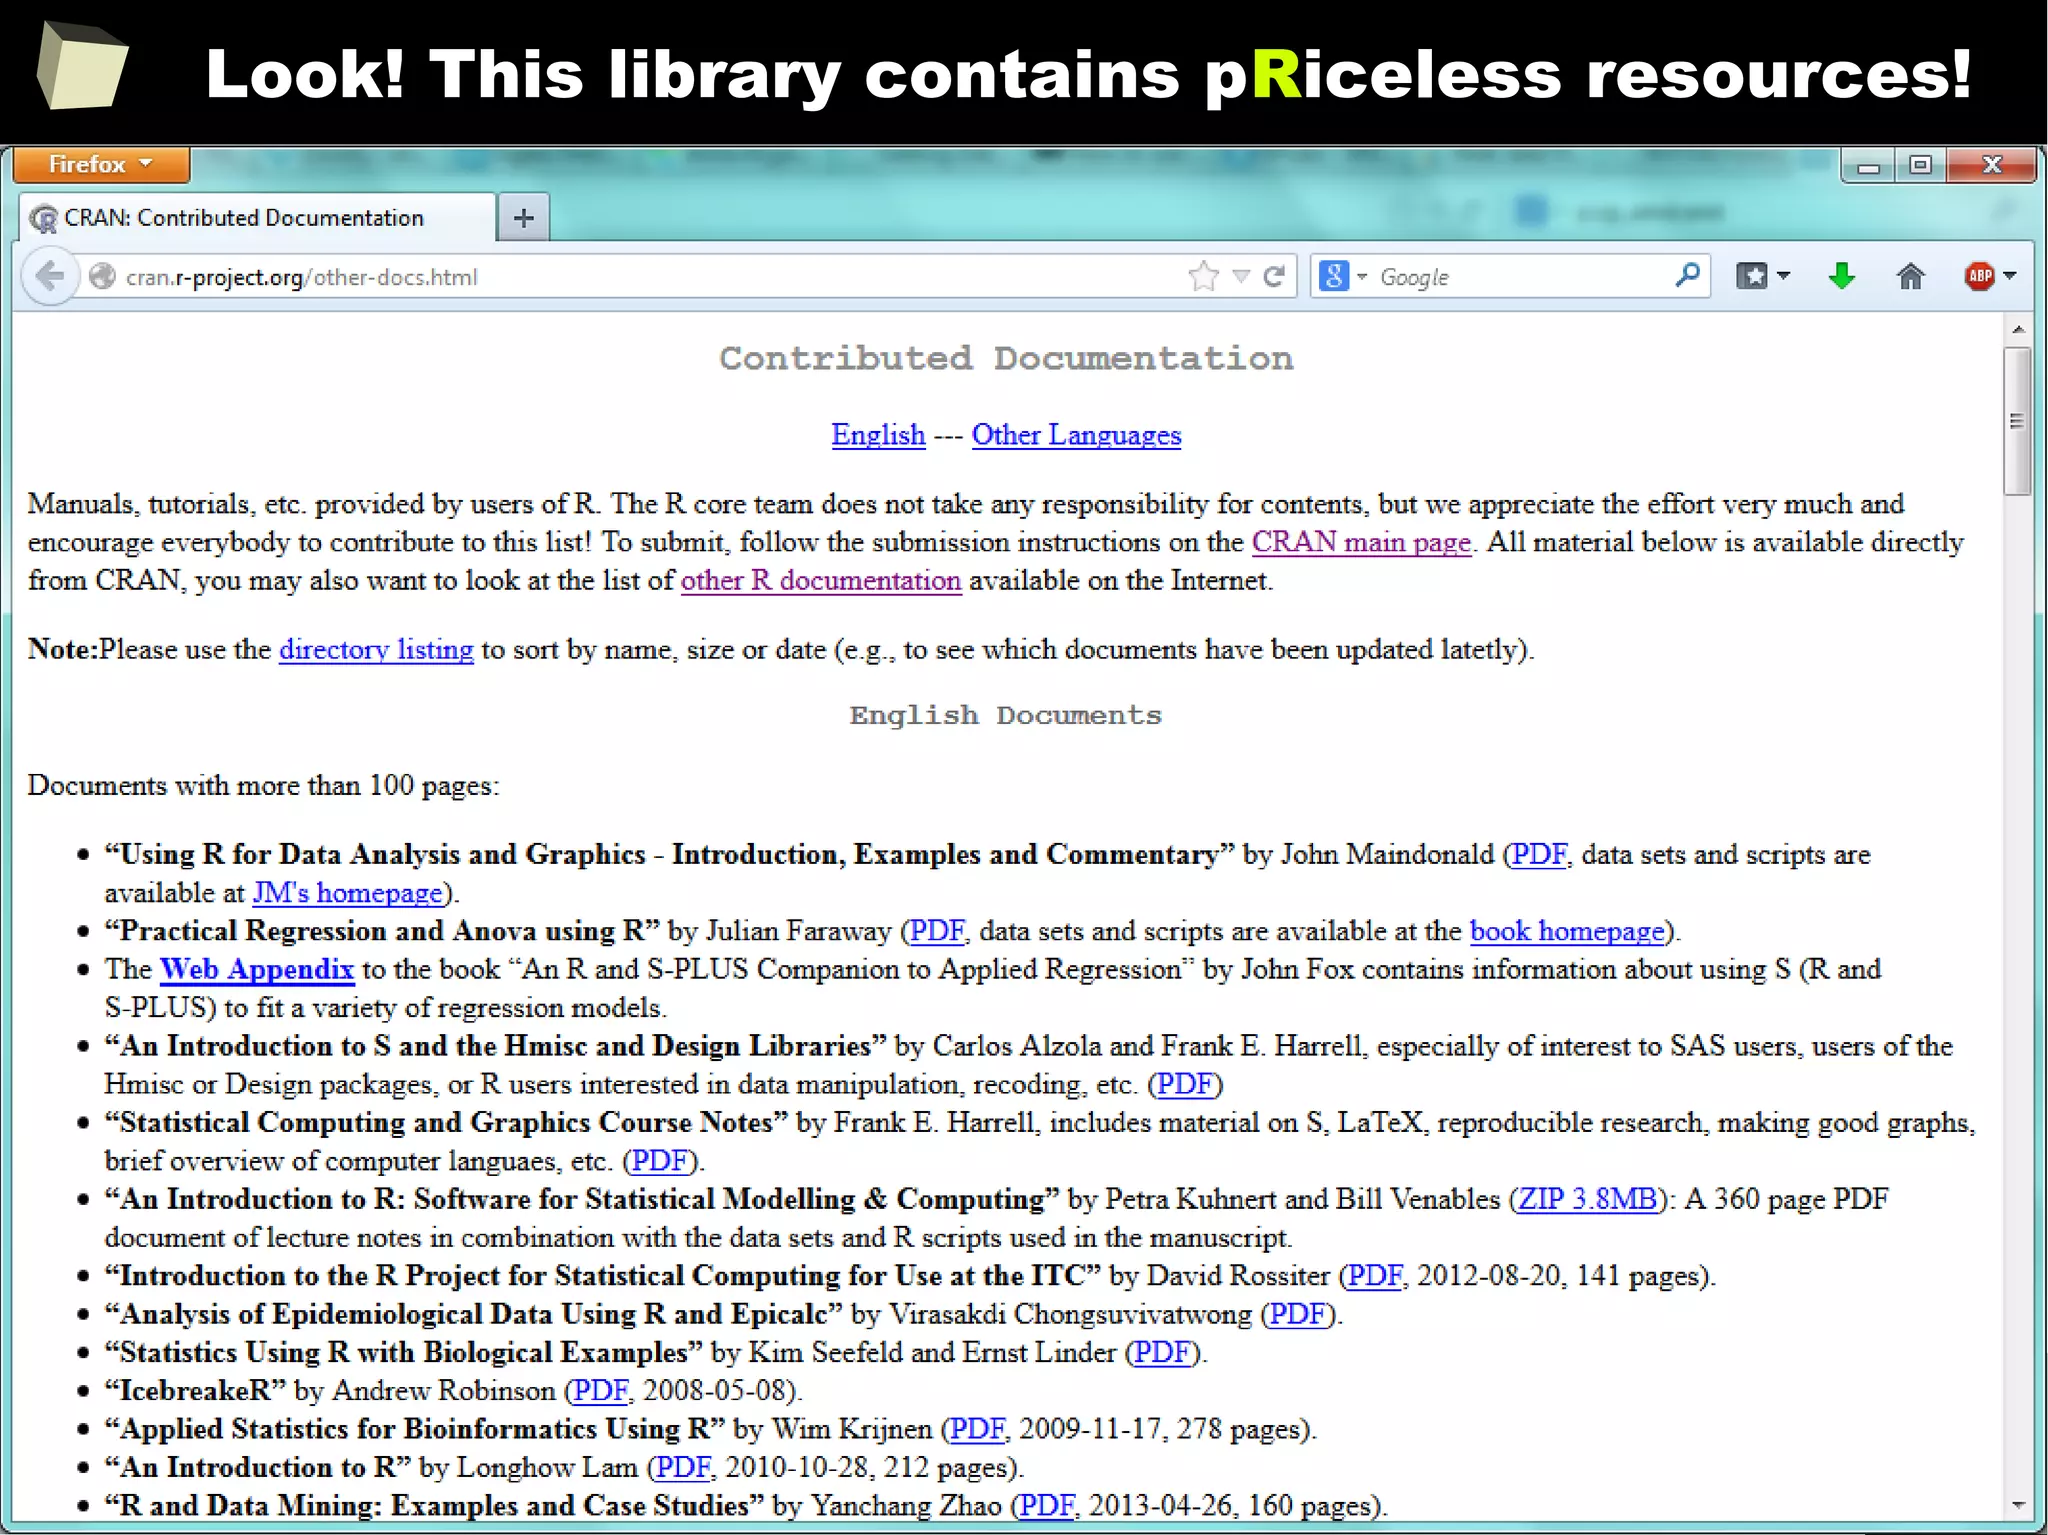
CRAN [biostatistics]
A list of thematic sections covered by the CRAN repository:
●
Bayesian Inference
●
Chemometrics and Computational Physics
●
Clinical Trial Design, Monitoring, and Analysis
●
Cluster Analysis & Finite Mixture Models
●
Differential Equations
●
Probability Distributions
●
Computational Econometrics
●
Analysis of Ecological and Environmental Data
●
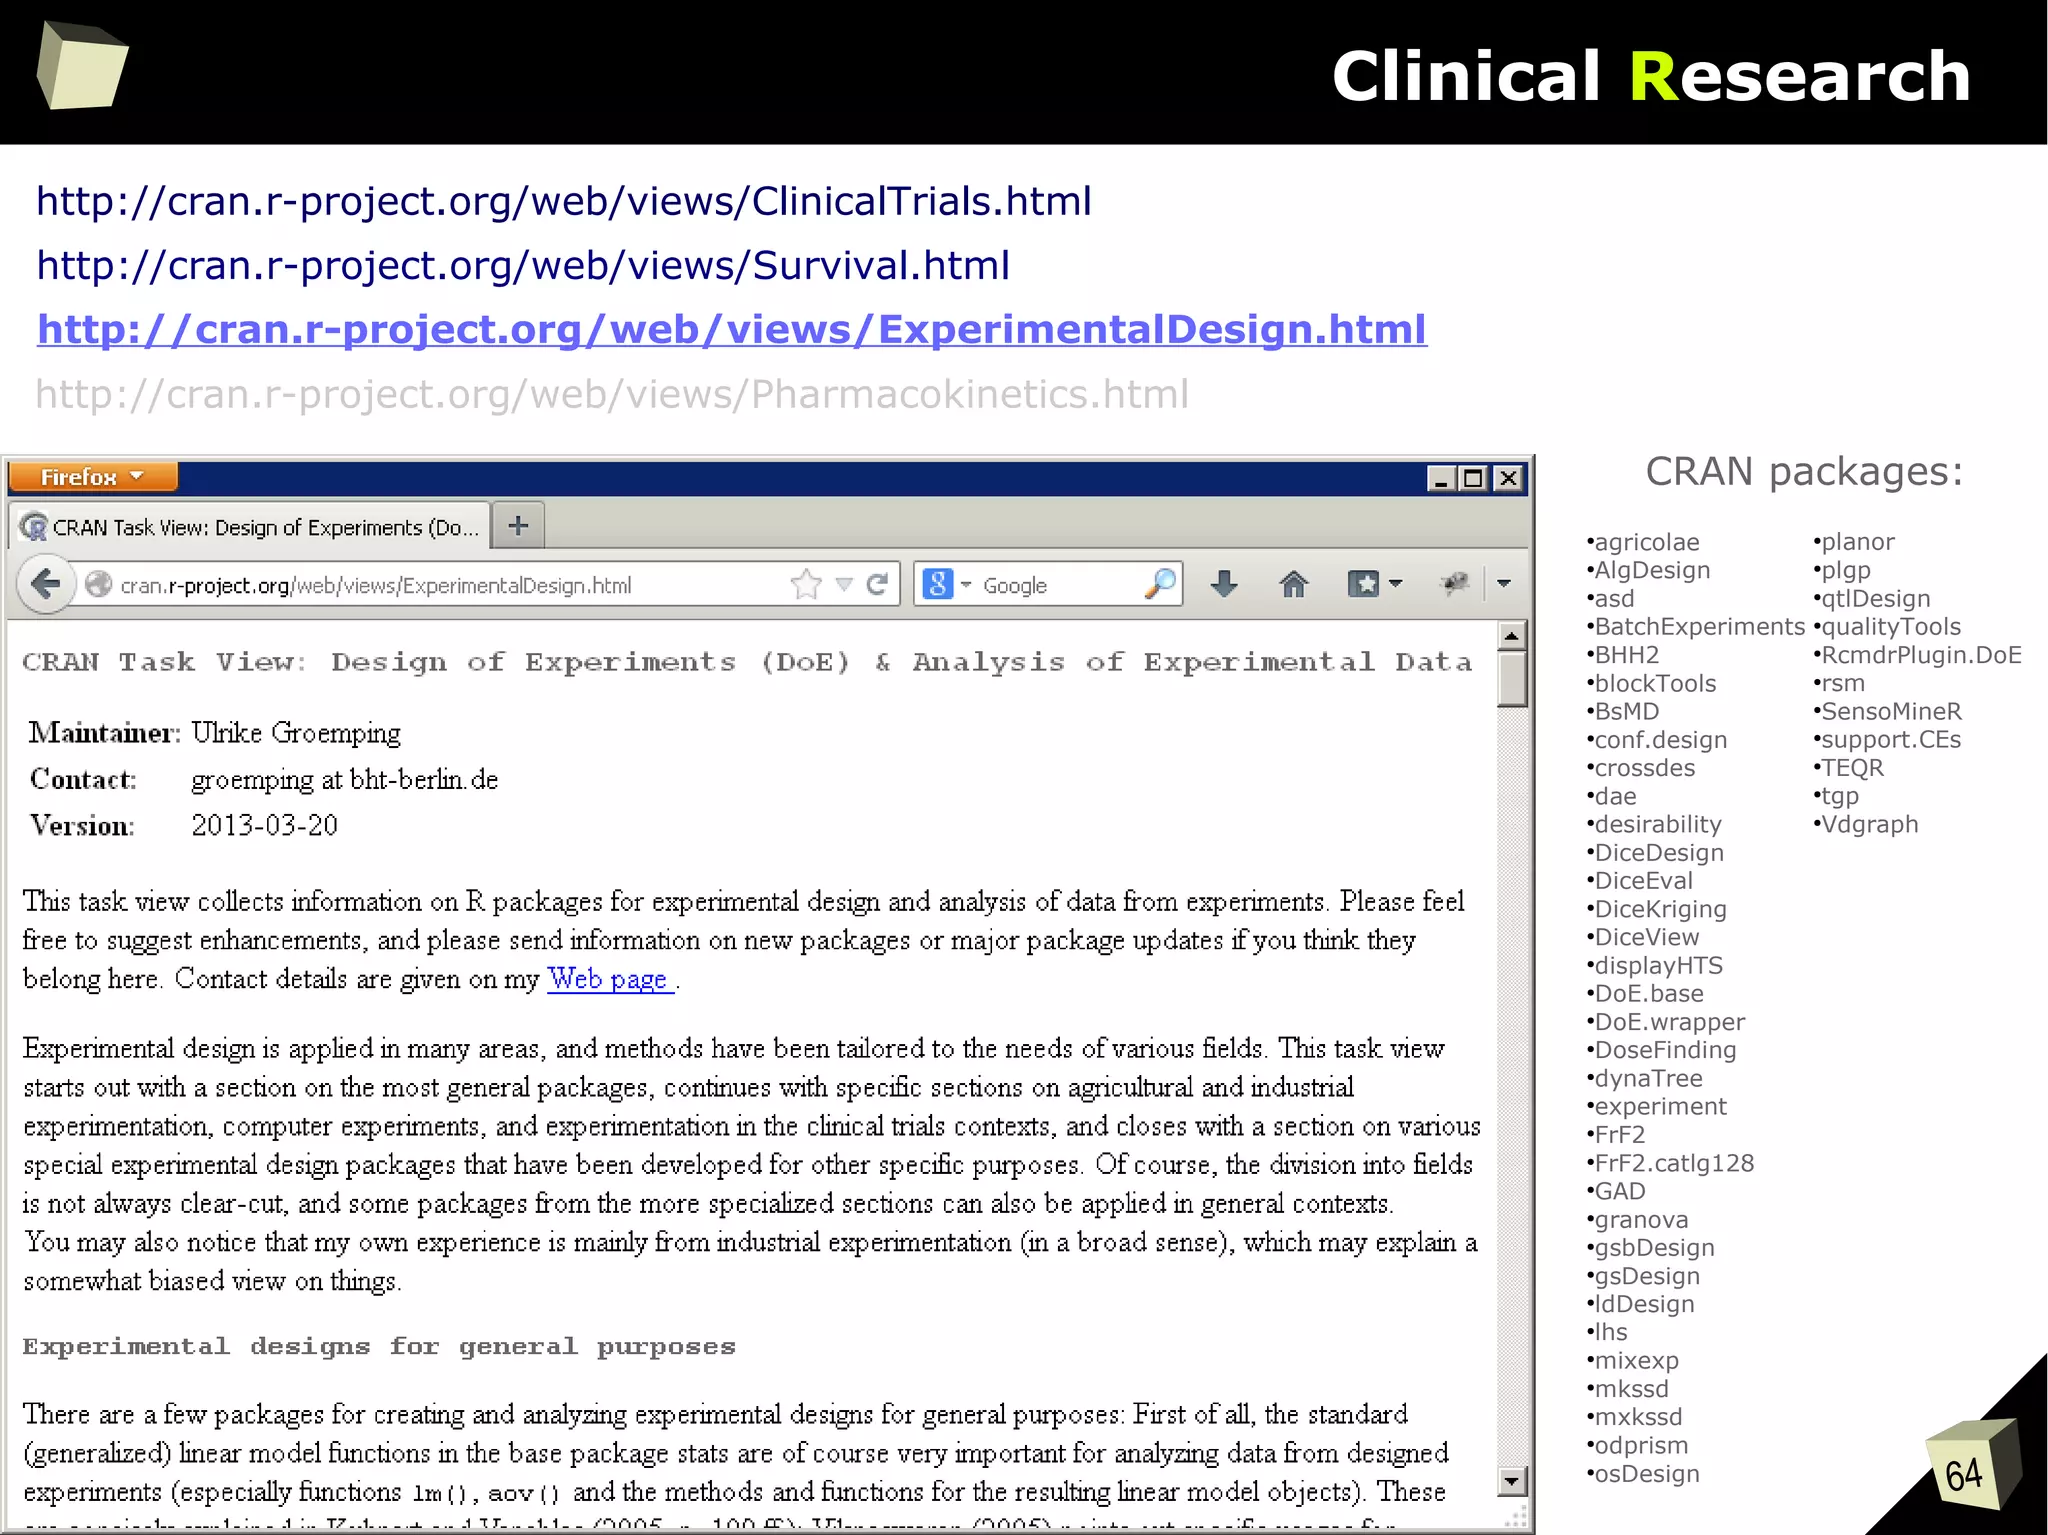
Design of Experiments (DoE) & Analysis of Experimental Data
●
Empirical Finance
●
Statistical Genetics
●
Graphic Displays & Dynamic Graphics & Graphic Devices &
Visualization
●
High-Performance and Parallel Computing with R
●
Machine Learning & Statistical Learning
●
Medical Image Analysis
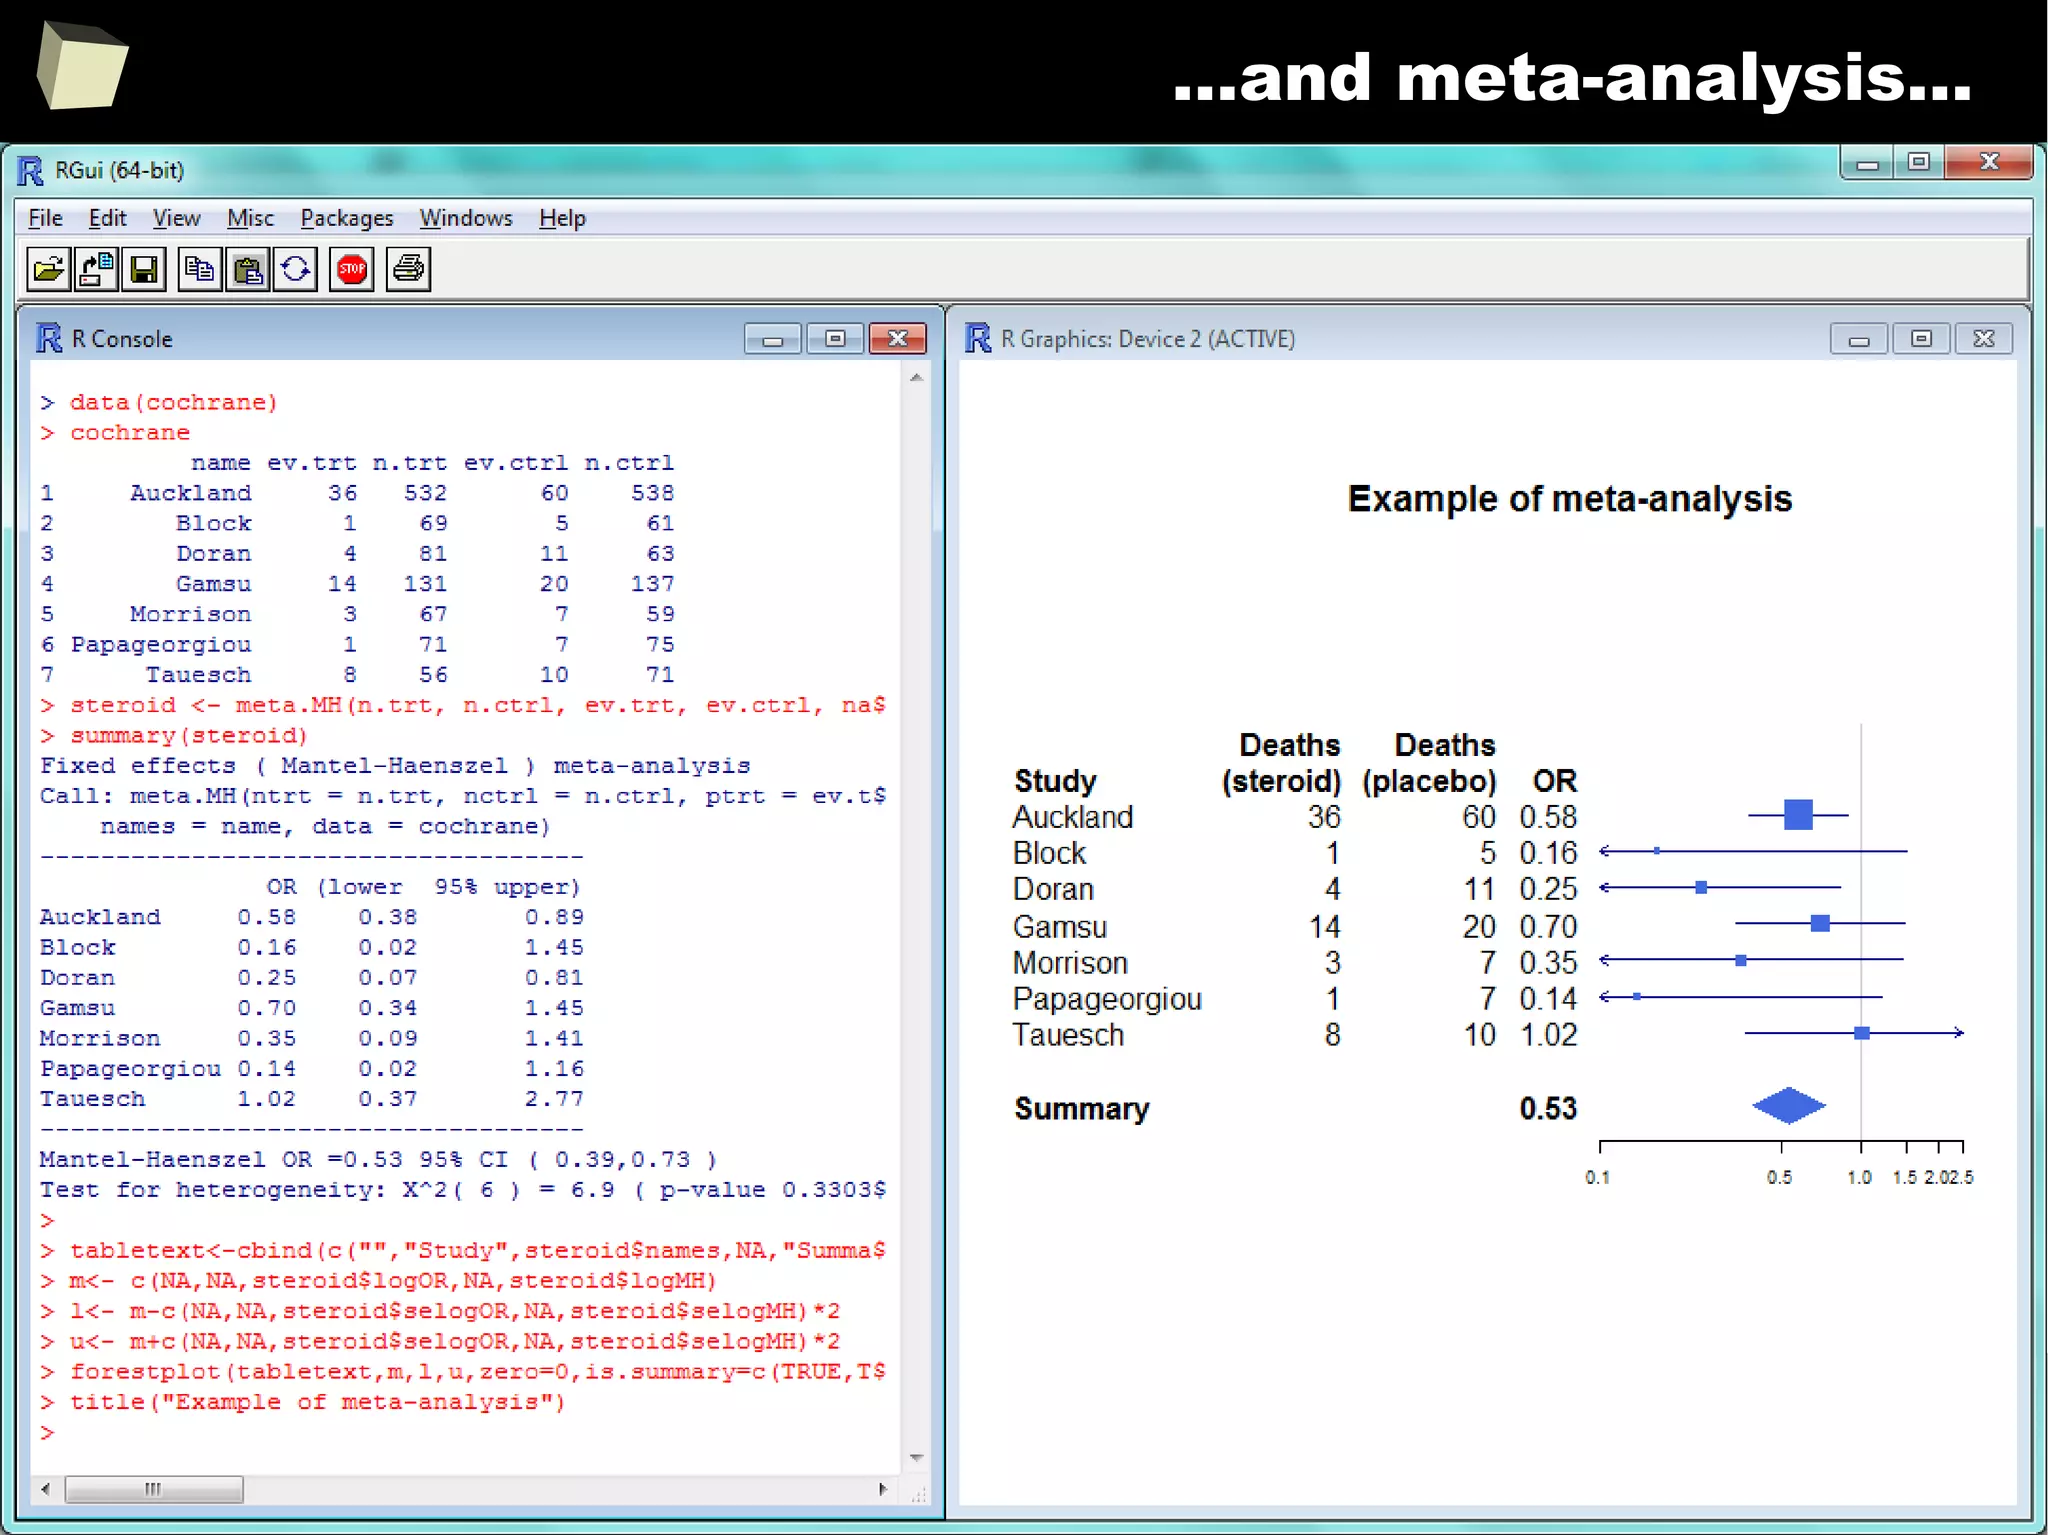
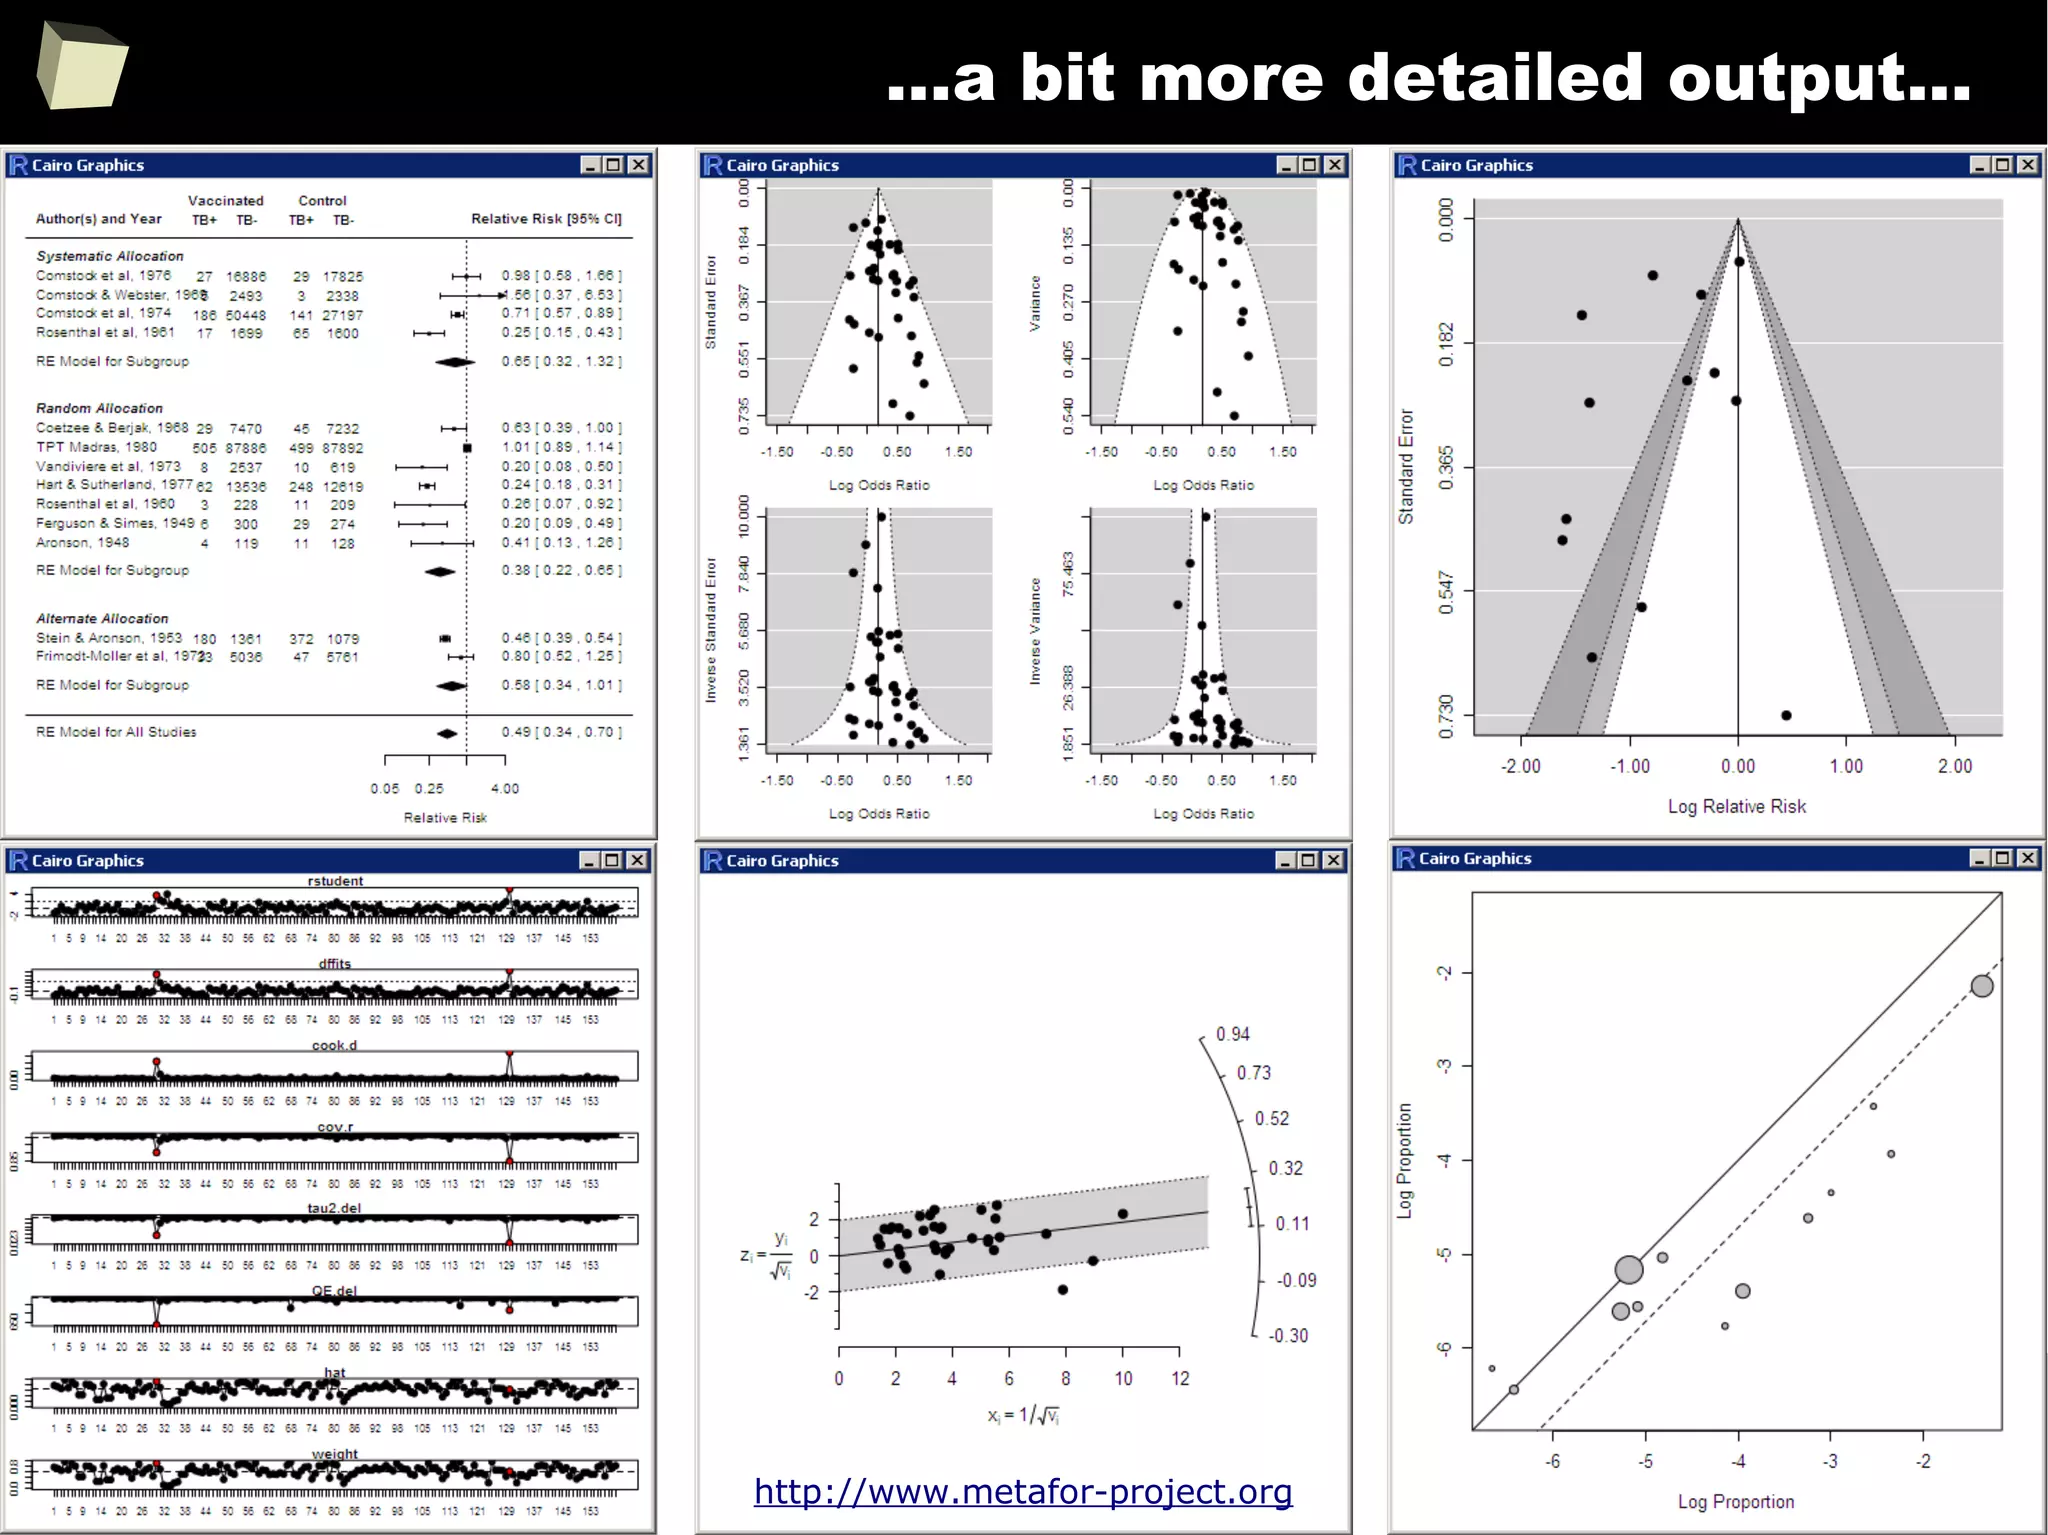
●
Meta-Analysis
●
Multivariate Statistics
●
Natural Language Processing
●
Numerical Mathematics
●
Official Statistics & Survey Methodology
●
Optimization and Mathematical Programming
●
Analysis of Pharmacokinetic Data
●
Phylogenetics, Especially Comparative Methods
●
Psychometric Models and Methods
●
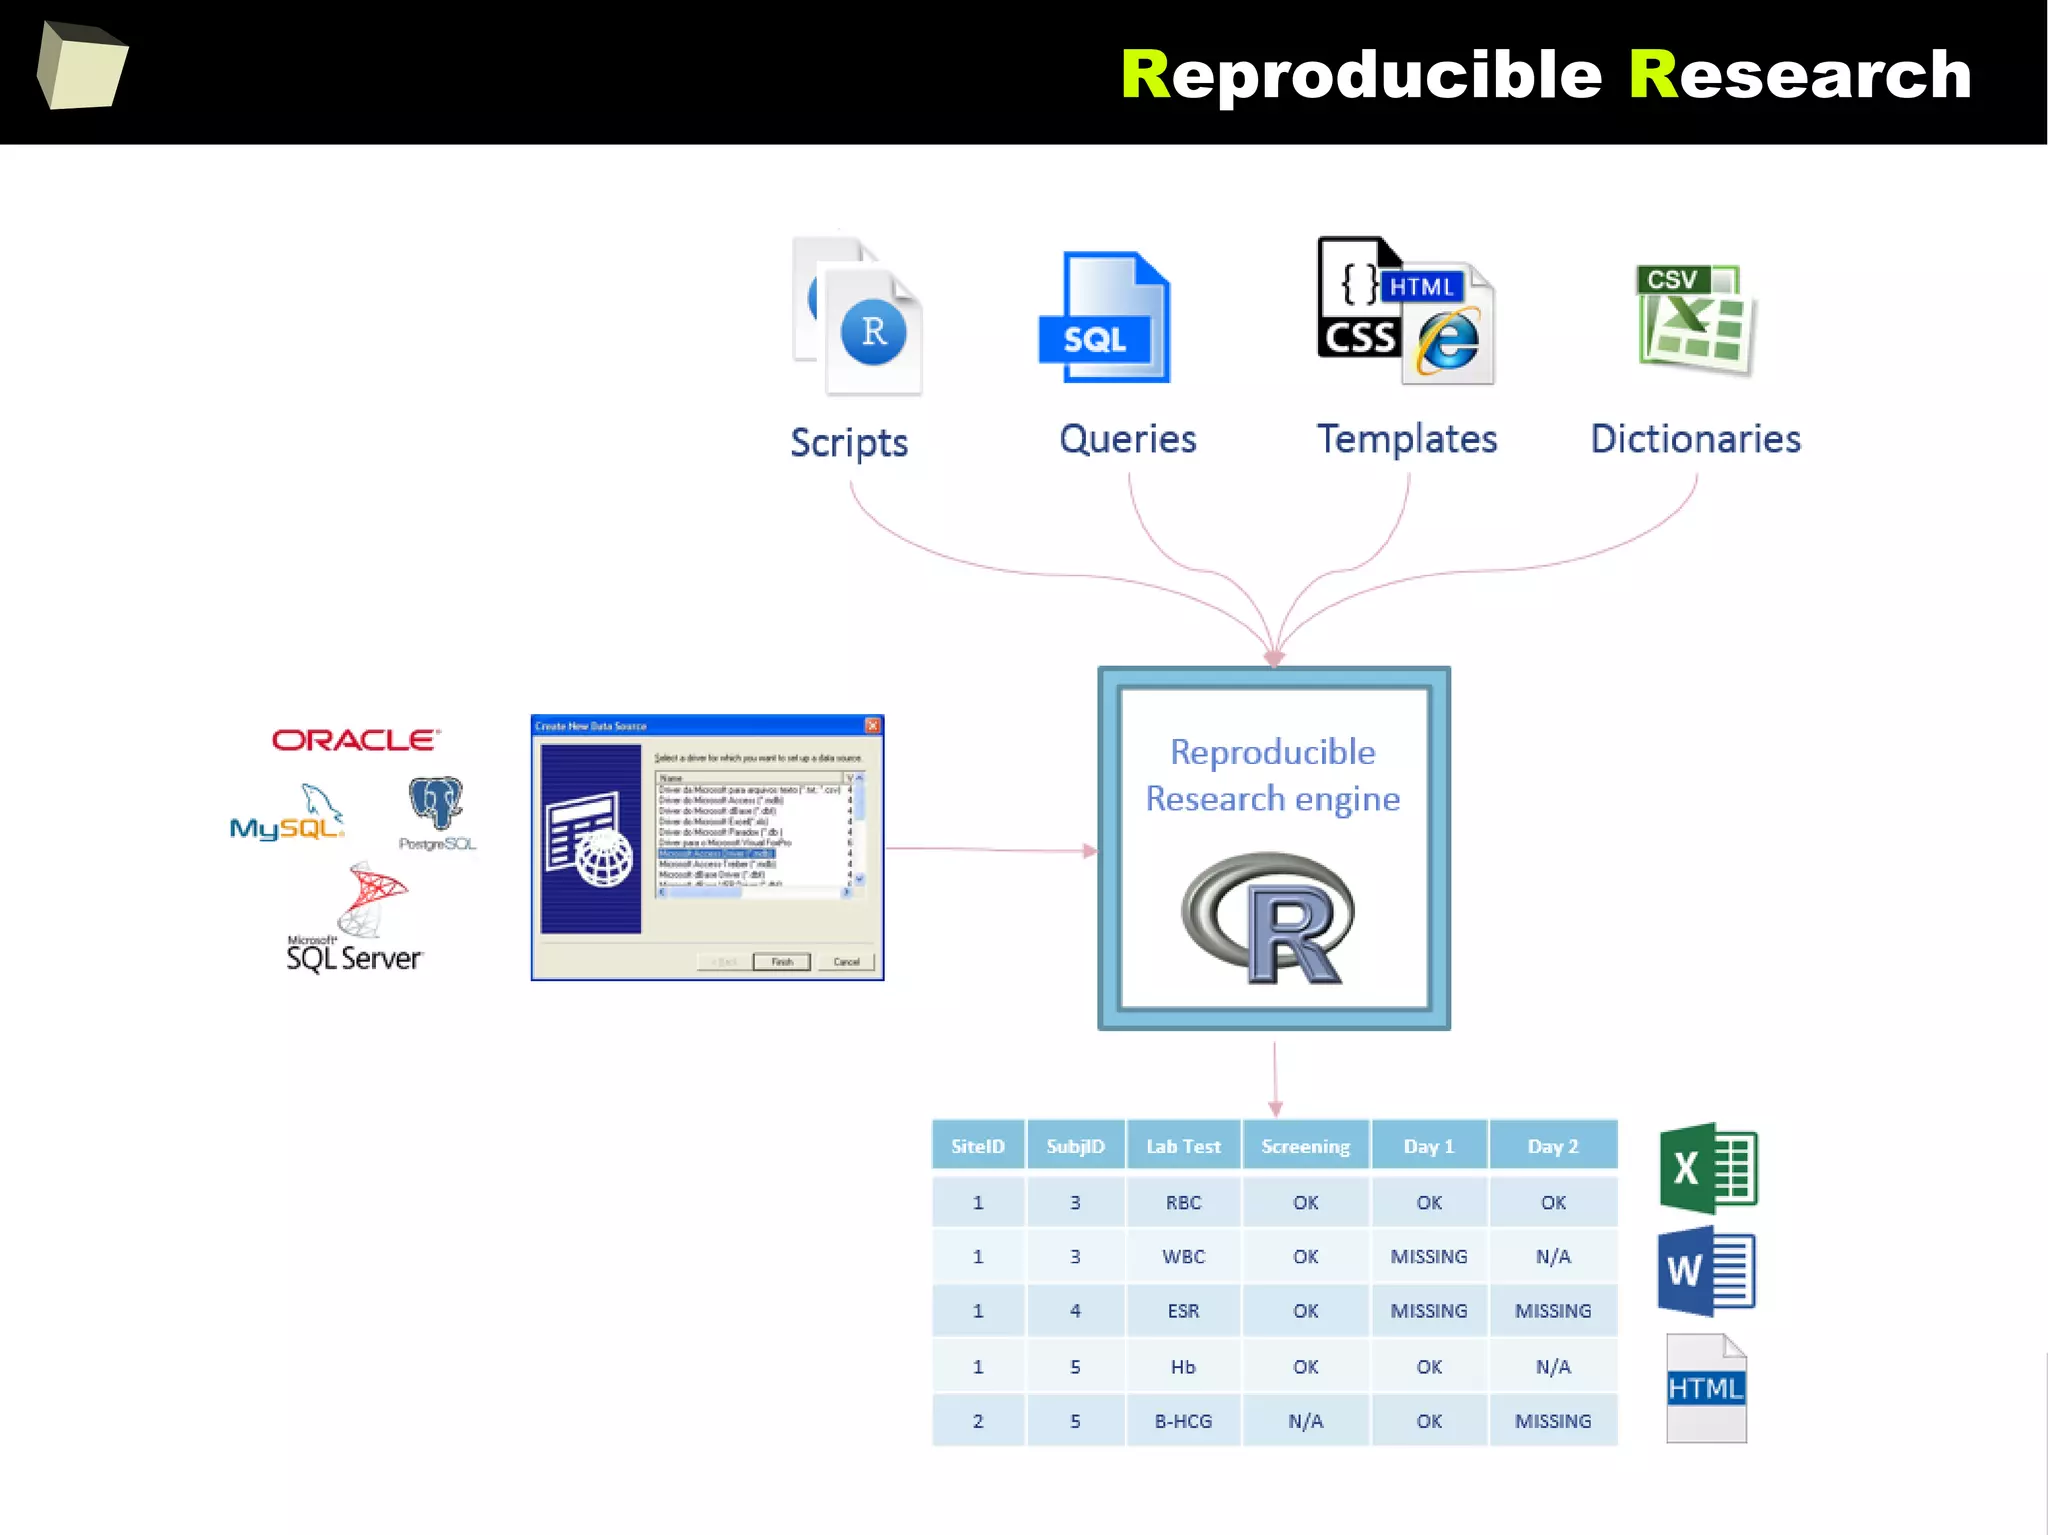
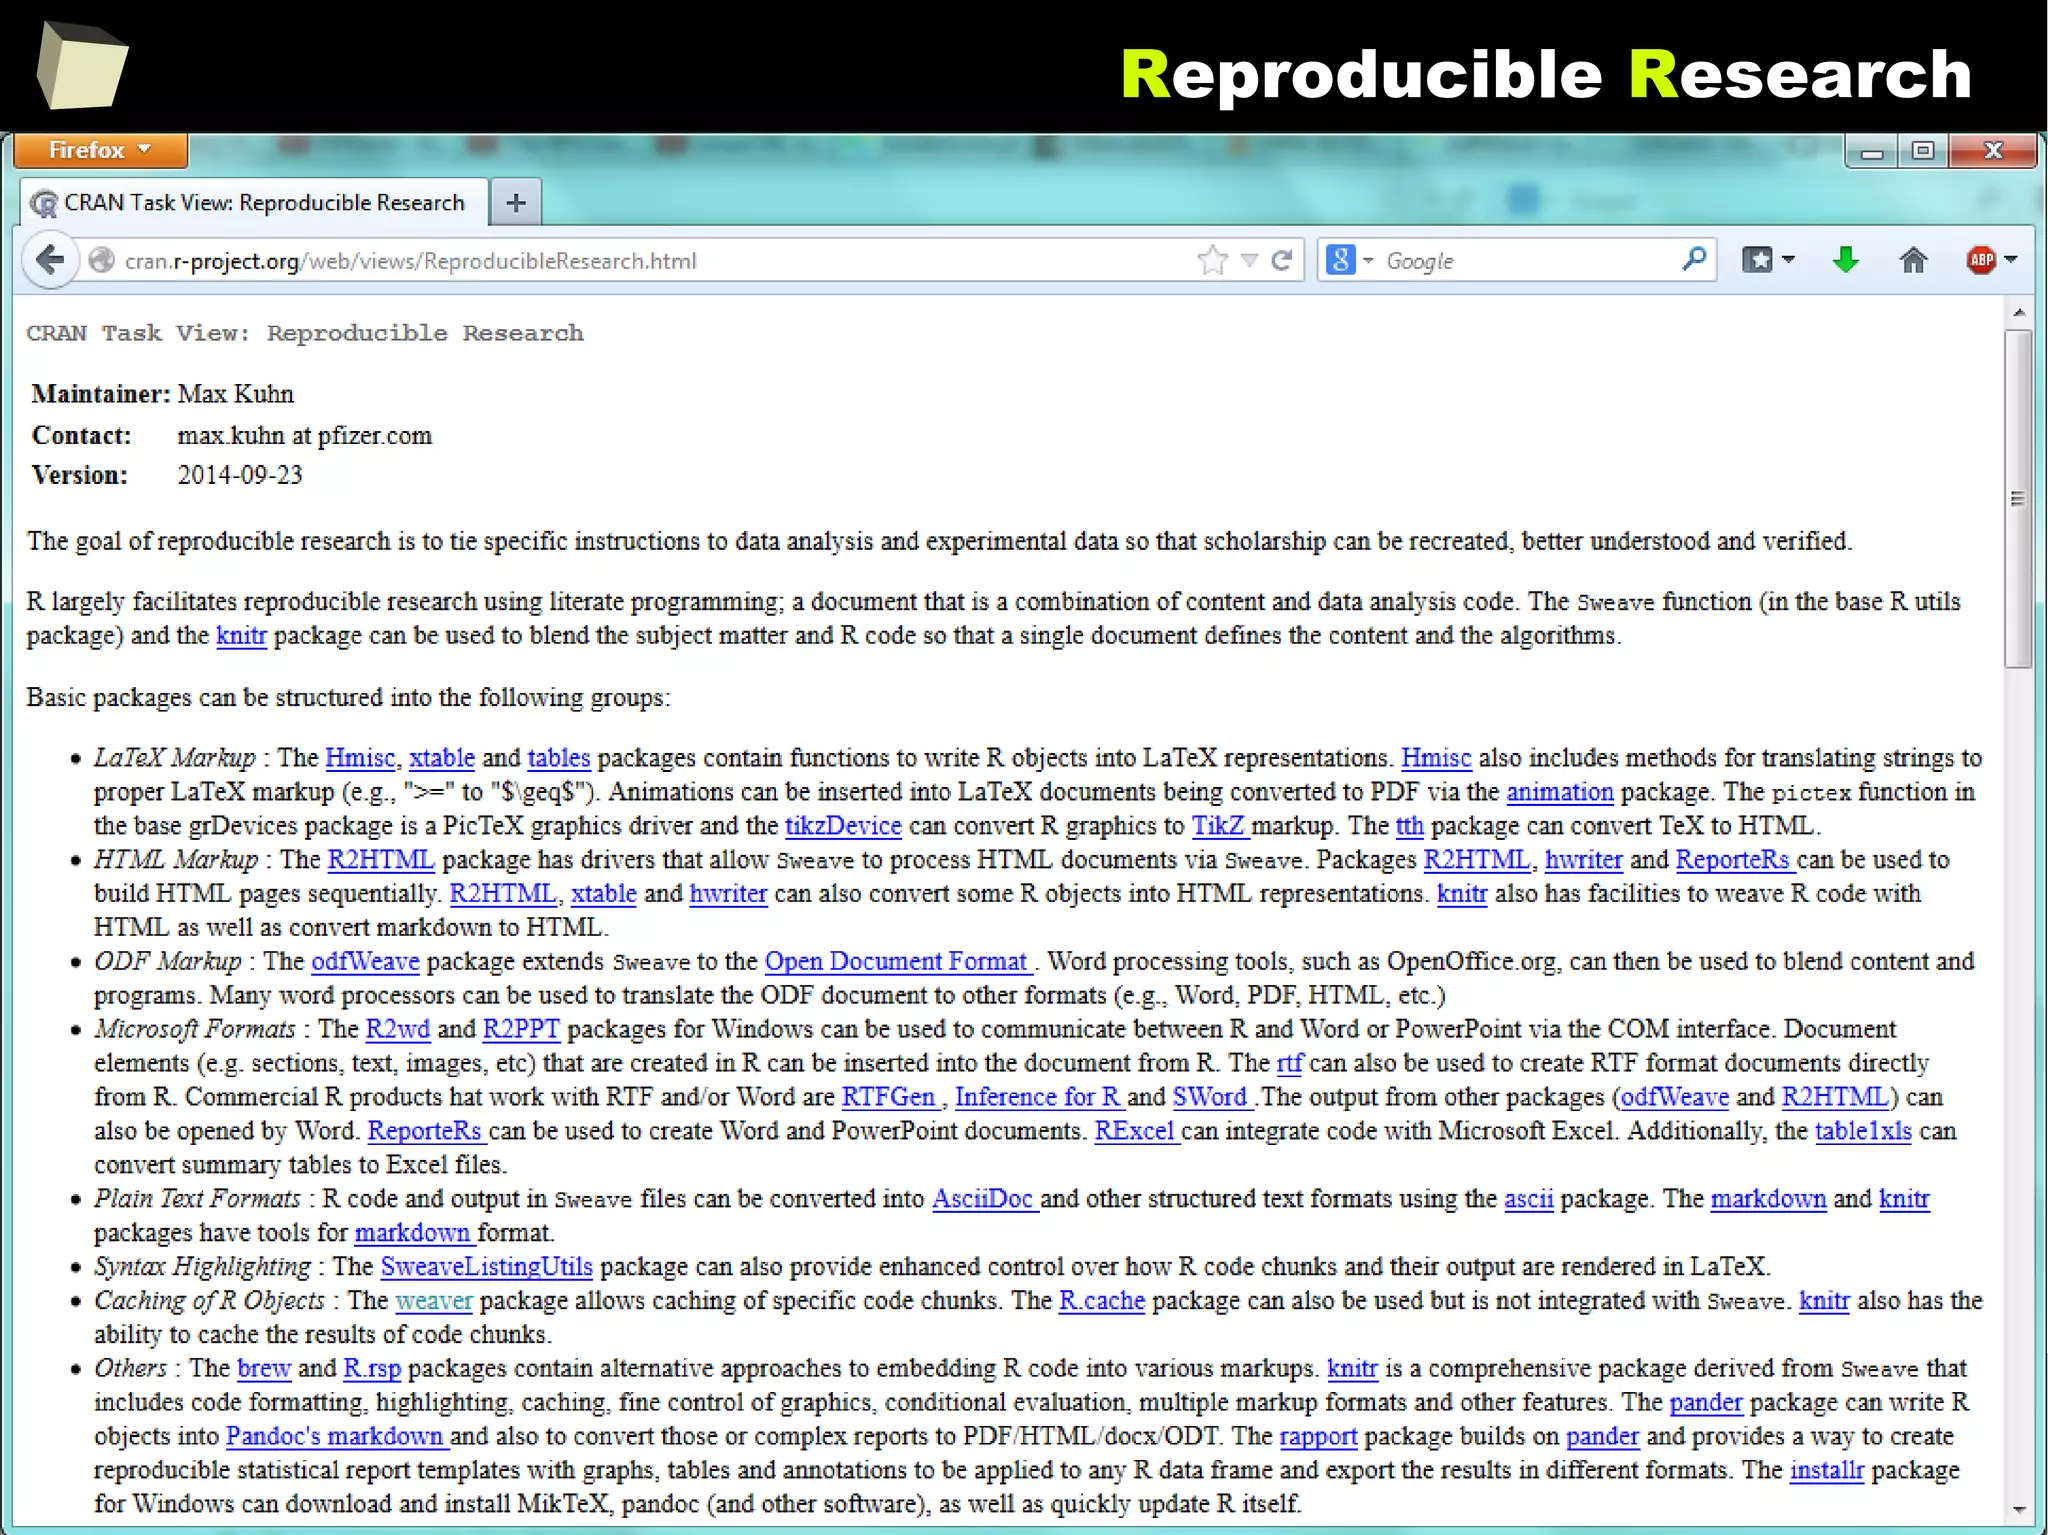
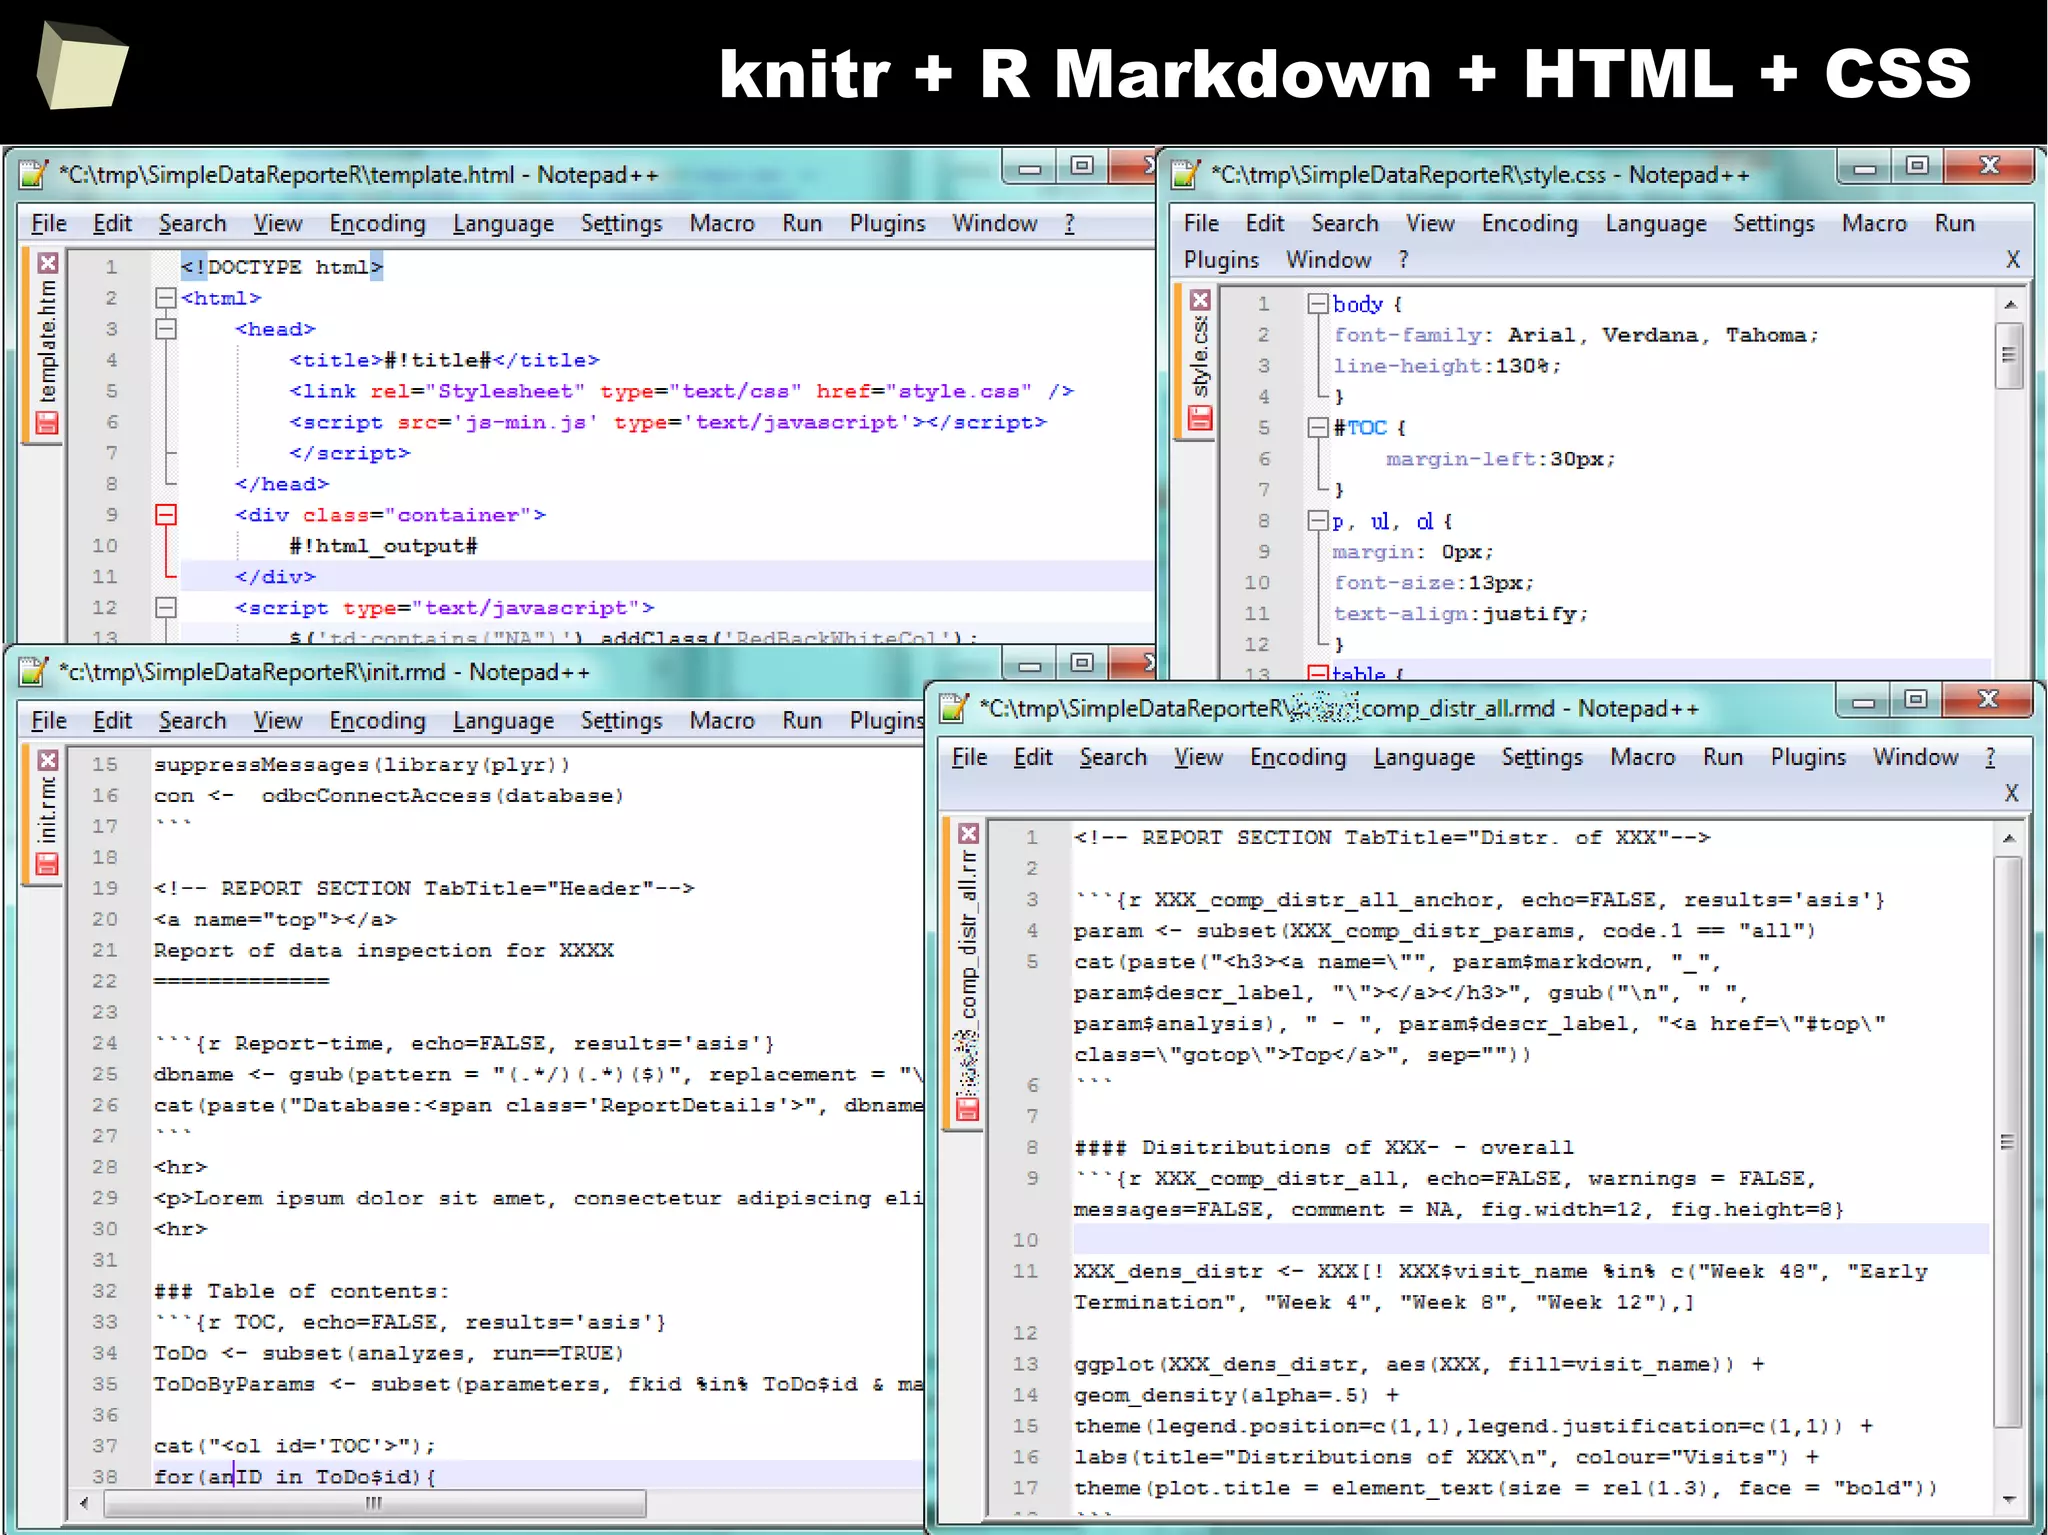
Reproducible Research
●
Robust Statistical Methods
●
Statistics for the Social Sciences
●
Analysis of Spatial Data
●
Handling and Analyzing Spatio-Temporal Data
●
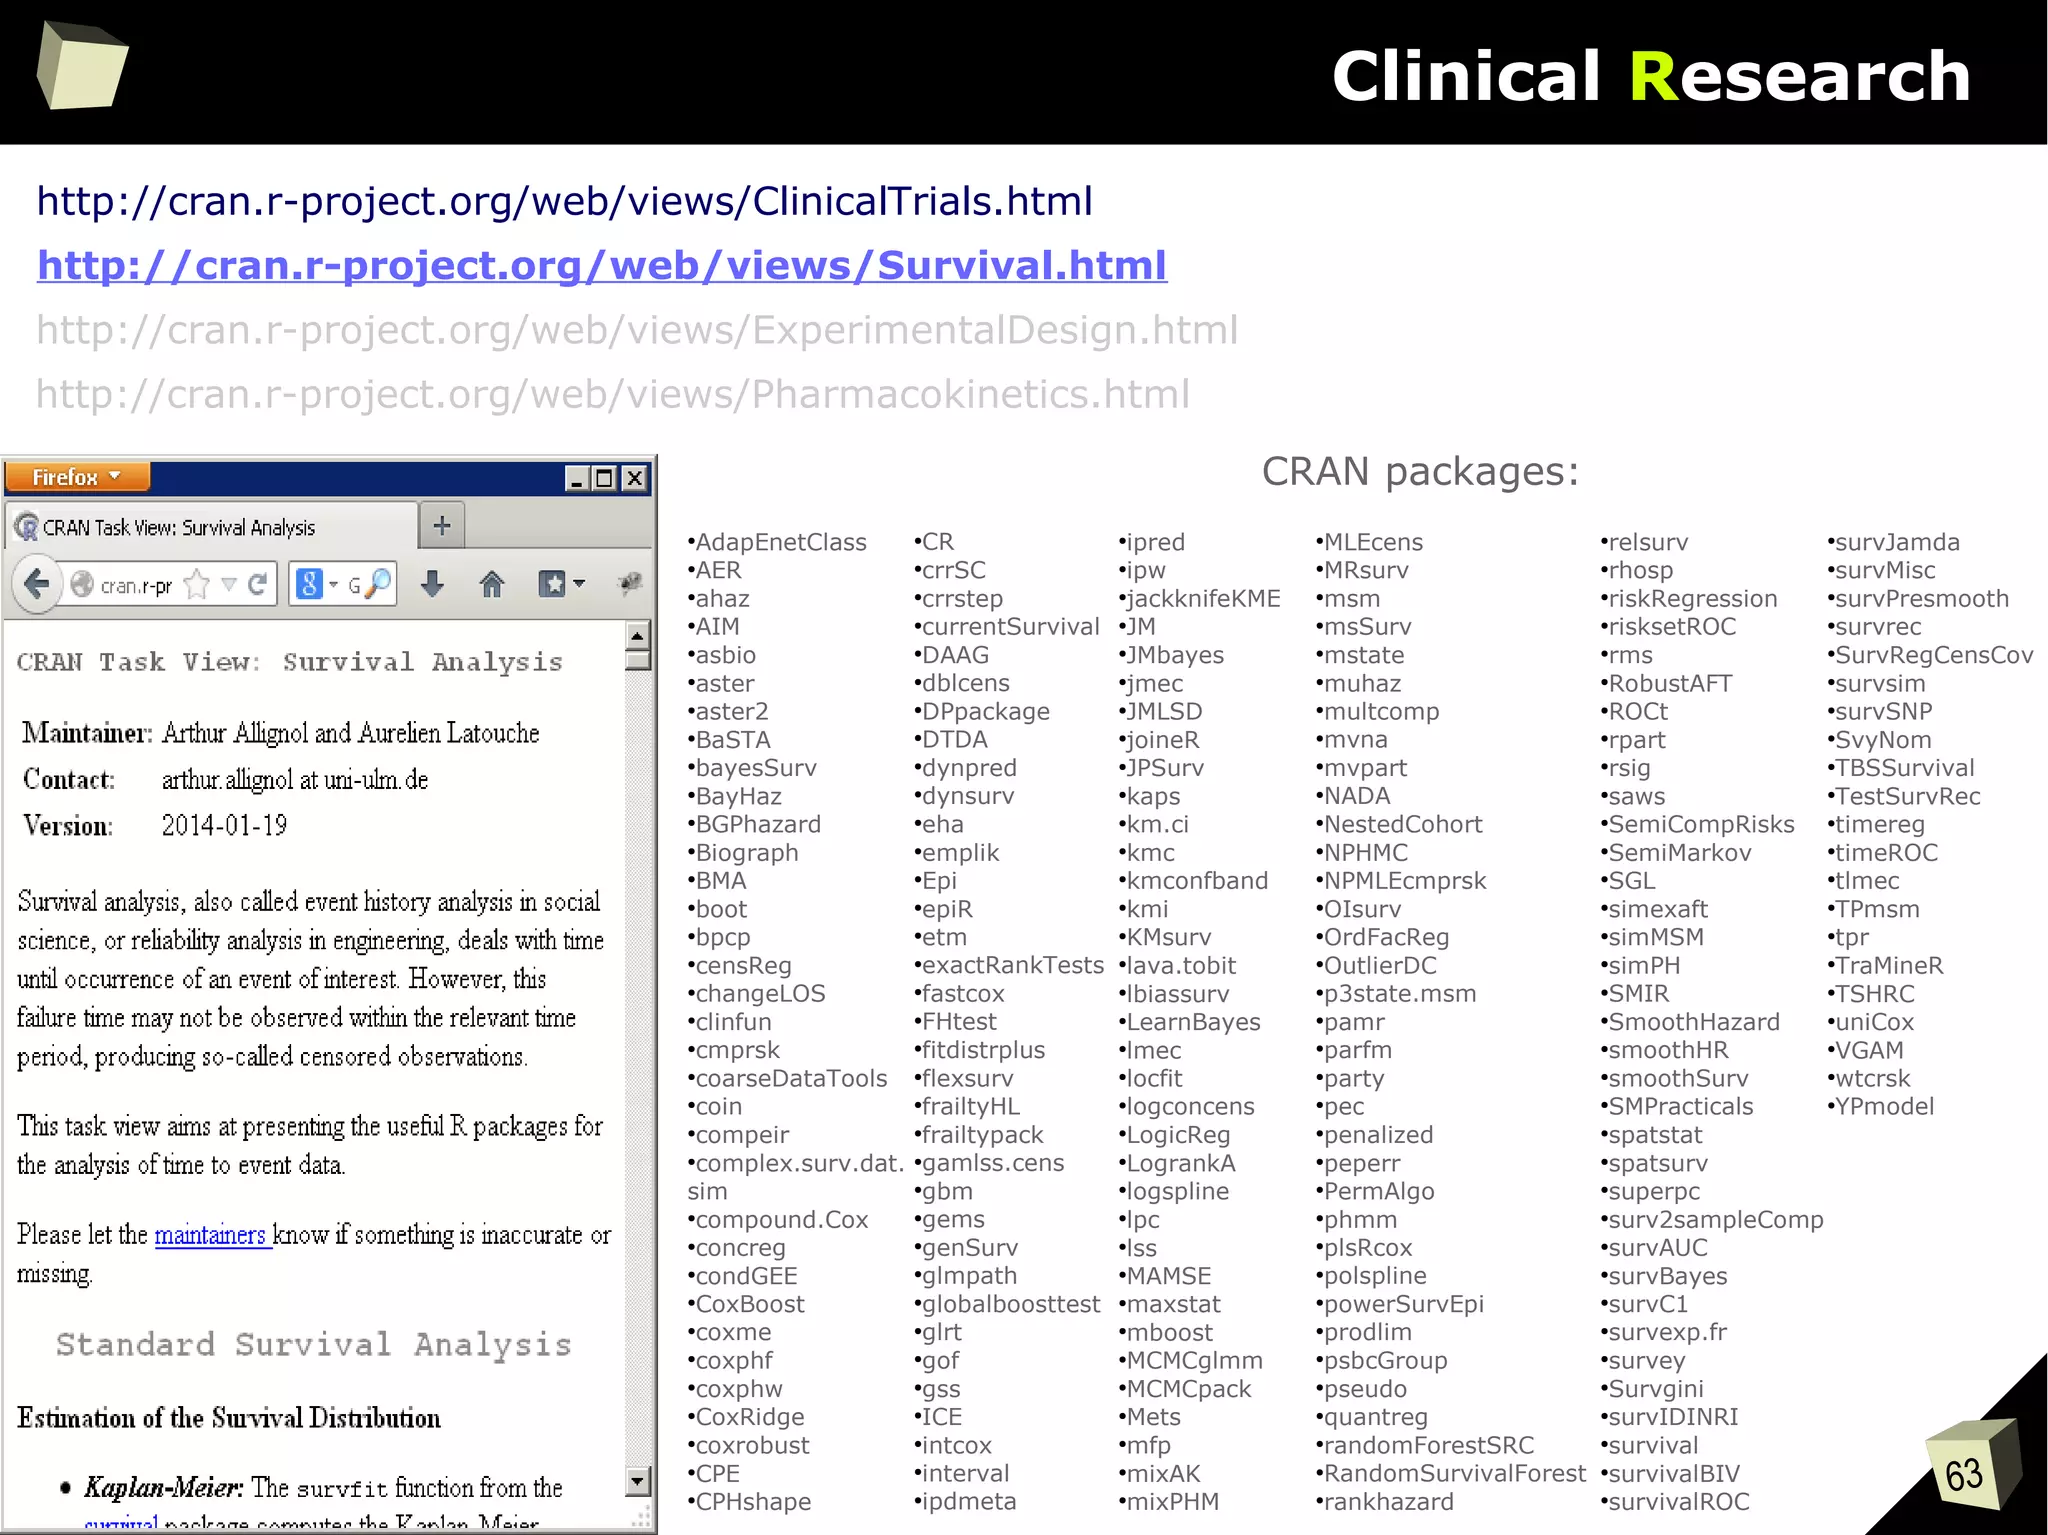
Survival Analysis
●
Time Series Analysis
●
Web Technologies and Services
●
gRaphical Models in R](https://image.slidesharecdn.com/is-r-suitable-enough-for-clinical-research-160113193220/75/GNU-R-in-Clinical-Research-and-Evidence-Based-Medicine-56-2048.jpg)


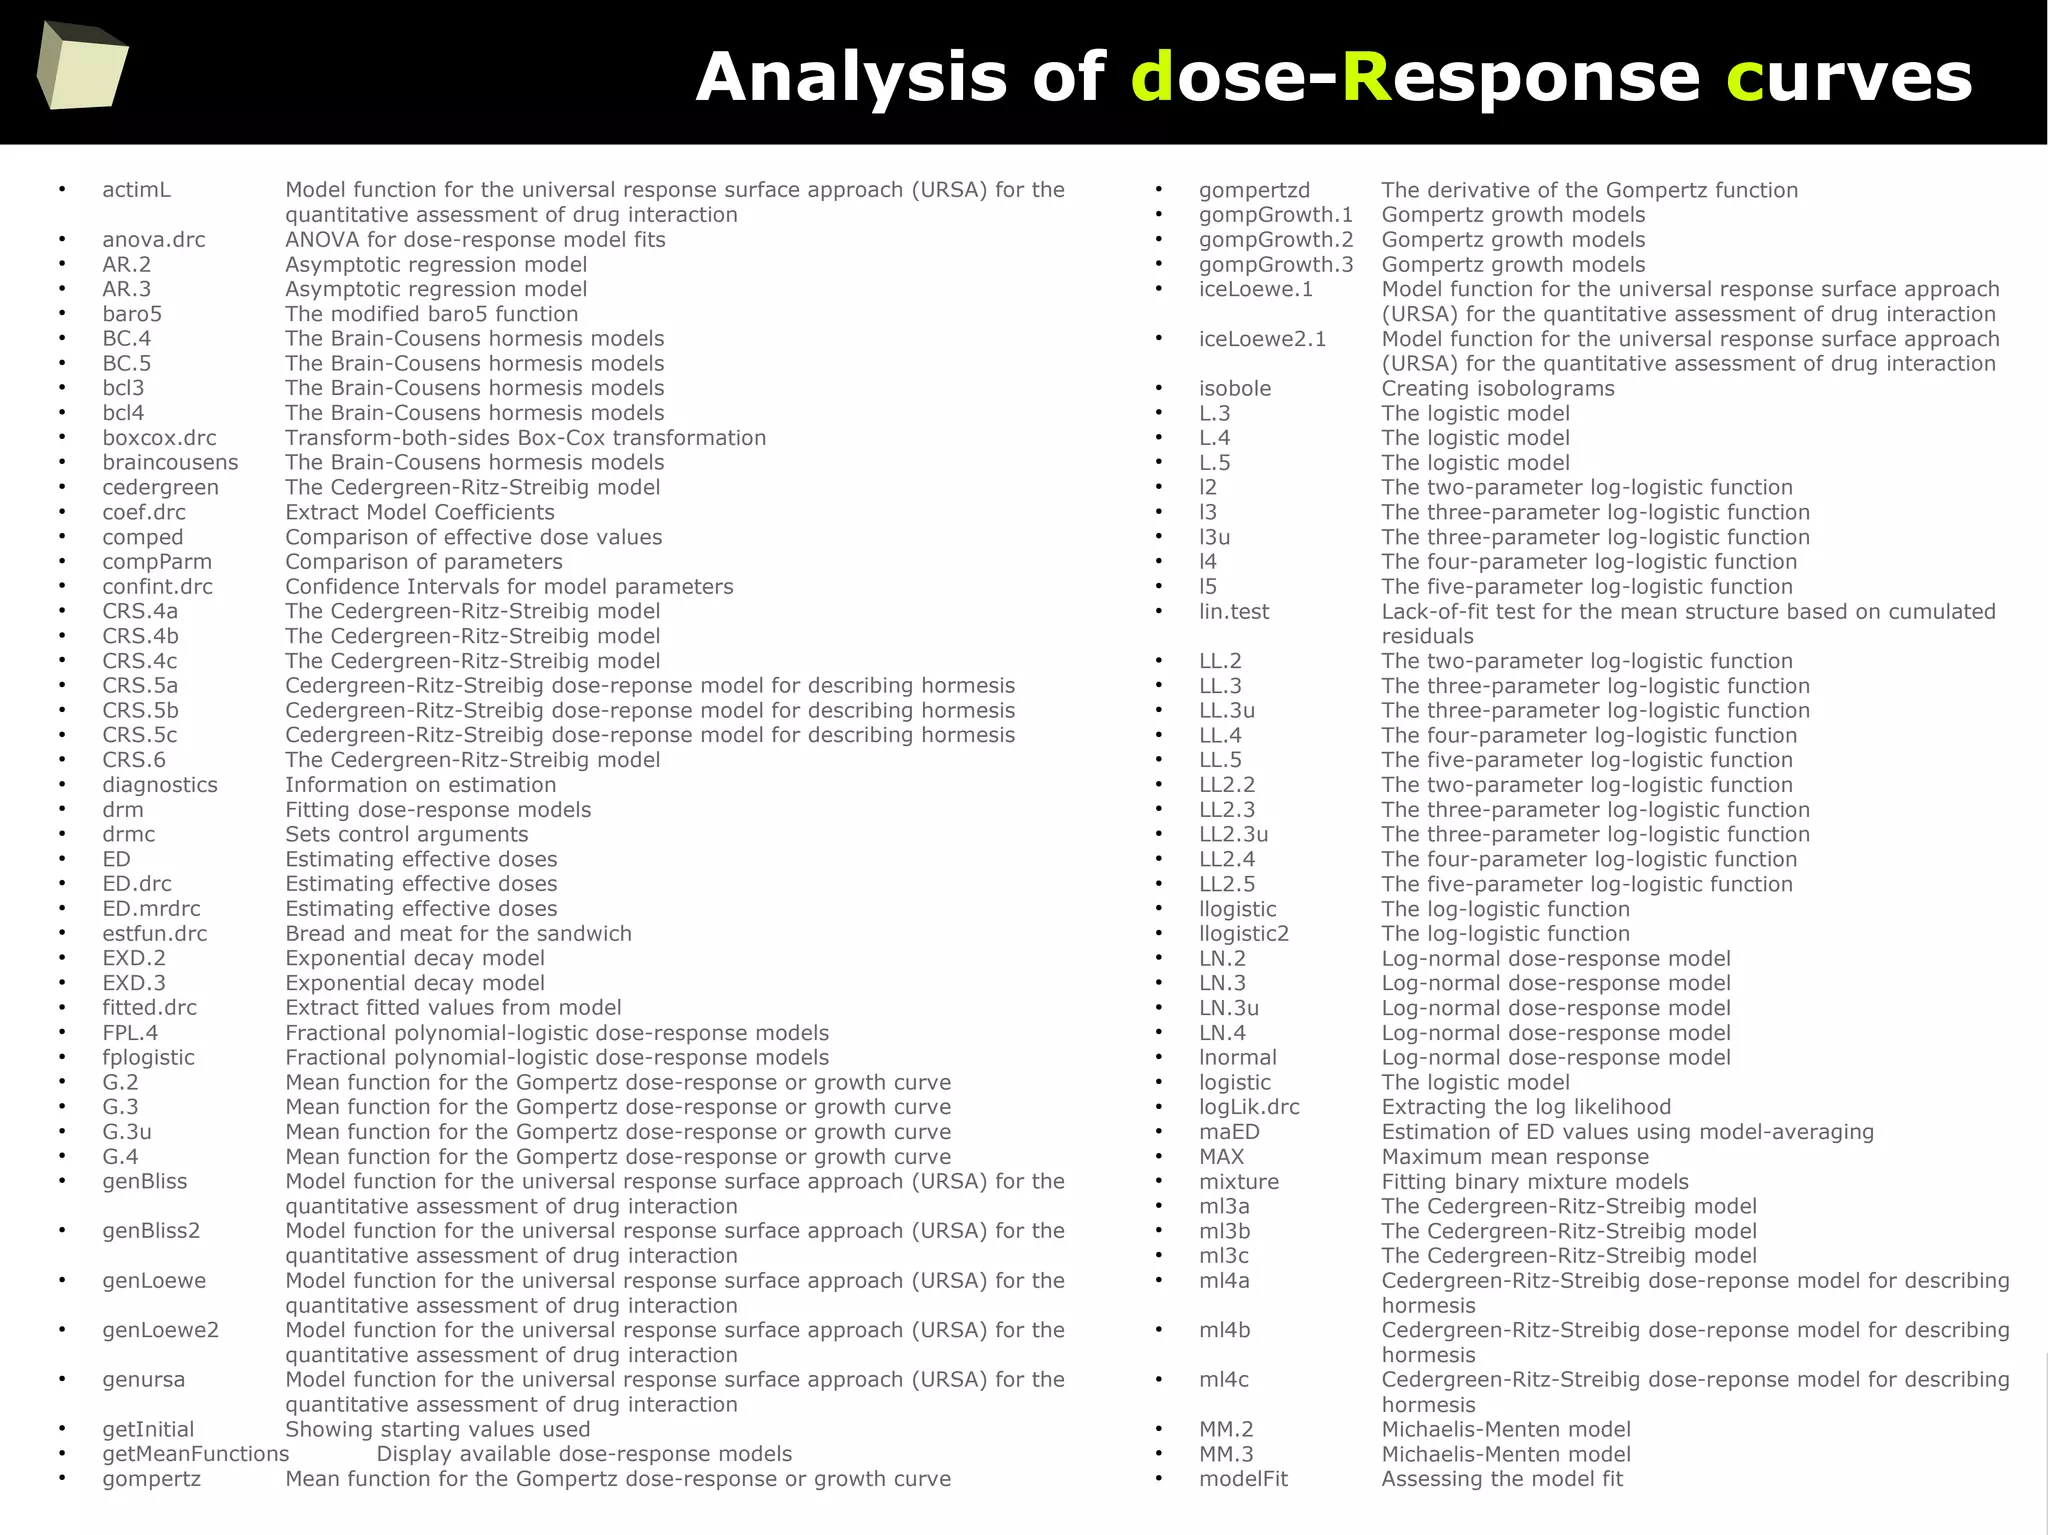
![71
Analysis of dose-Response curves [cont'd]
●
mr.test Mizon-Richard test for dose-response models
●
mrdrm Model-robust dose-response modelling
●
mselect Model selection
●
NEC Dose-response model for estimation of no effect concentration (NEC).
●
NEC.2 Dose-response model for estimation of no effect concentration (NEC).
●
NEC.3 Dose-response model for estimation of no effect concentration (NEC).
●
NEC.4 Dose-response model for estimation of no effect concentration (NEC).
●
neill.test Neill's lack-of-fit test for dose-response models
●
plot.drc Plotting fitted curves for a 'drc' or 'mrdrc' object
●
plot.mrdrc Plotting fitted curves for a 'drc' or 'mrdrc' object
●
PR Expected or predicted response
●
predict.drc Prediction
●
predict.mrdrc Prediction
●
print.drc Printing key features
●
print.mrdrc Printing key features
●
print.summary.drc Printing summary of non-linear model fits
●
rdrm Simulating a dose-response curve
●
relpot Comparing selectivity indices across curves
●
residuals.drc Extracting residuals from model
●
ryegrass Effect of ferulic acid on growth of ryegrass
●
S.capricornutum Effect of cadmium on growth of green alga
●
searchdrc Searching through a range of initial parameter values to obtain
convergence
●
secalonic Root length measurements
●
SI Comparing selectivity indices across curves
●
simDR Simulating ED values under various scenarios
●
summary.drc Summarising non-linear model fits
●
twophase Two-phase dose-response model
●
ucedergreen The Cedergreen-Ritz-Streibig model
●
UCRS.4a The Cedergreen-Ritz-Streibig model
●
UCRS.4b The Cedergreen-Ritz-Streibig model
●
UCRS.4c The Cedergreen-Ritz-Streibig model
●
UCRS.5a Cedergreen-Ritz-Streibig dose-reponse model for describing hormesis
●
UCRS.5b Cedergreen-Ritz-Streibig dose-reponse model for describing hormesis
●
UCRS.5c Cedergreen-Ritz-Streibig dose-reponse model for describing hormesis
●
uml3a The Cedergreen-Ritz-Streibig model
●
uml3b The Cedergreen-Ritz-Streibig model
●
uml3c The Cedergreen-Ritz-Streibig model
●
uml4a Cedergreen-Ritz-Streibig dose-reponse model for describing hormesis
●
uml4b Cedergreen-Ritz-Streibig dose-reponse model for describing hormesis
●
uml4c Cedergreen-Ritz-Streibig dose-reponse model for describing hormesis
●
update.drc Updating and re-fitting a model
●
ursa Model function for the universal response surface approach (URSA) for the
quantitative assessment of drug interaction
●
vcov.drc Calculating variance-covariance matrix for objects of class 'drc'
●
W1.2 The two-parameter Weibull functions
●
W1.3 The three-parameter Weibull functions
●
W1.3u The three-parameter Weibull functions
●
W1.4 The four-parameter Weibull functions
●
w2 The two-parameter Weibull functions
●
W2.2 The two-parameter Weibull functions
●
W2.3 The three-parameter Weibull functions
●
W2.3u The three-parameter Weibull functions
●
W2.4 The four-parameter Weibull functions
●
W2x.3 The three-parameter Weibull functions
●
W2x.4 The four-parameter Weibull functions
●
w3 The three-parameter Weibull functions
●
w4 The four-parameter Weibull functions
●
weibull1 Weibull model functions
●
weibull2 Weibull model functions
●
weibull2x Weibull model functions
●
yieldLoss Calculating yield loss parameters](https://image.slidesharecdn.com/is-r-suitable-enough-for-clinical-research-160113193220/75/GNU-R-in-Clinical-Research-and-Evidence-Based-Medicine-71-2048.jpg)
![72
Analysis of dose-Response curves [cont'd]
http://www.bioassay.dk/index-filer/start/DraftDrcManual.pdf](https://image.slidesharecdn.com/is-r-suitable-enough-for-clinical-research-160113193220/75/GNU-R-in-Clinical-Research-and-Evidence-Based-Medicine-72-2048.jpg)
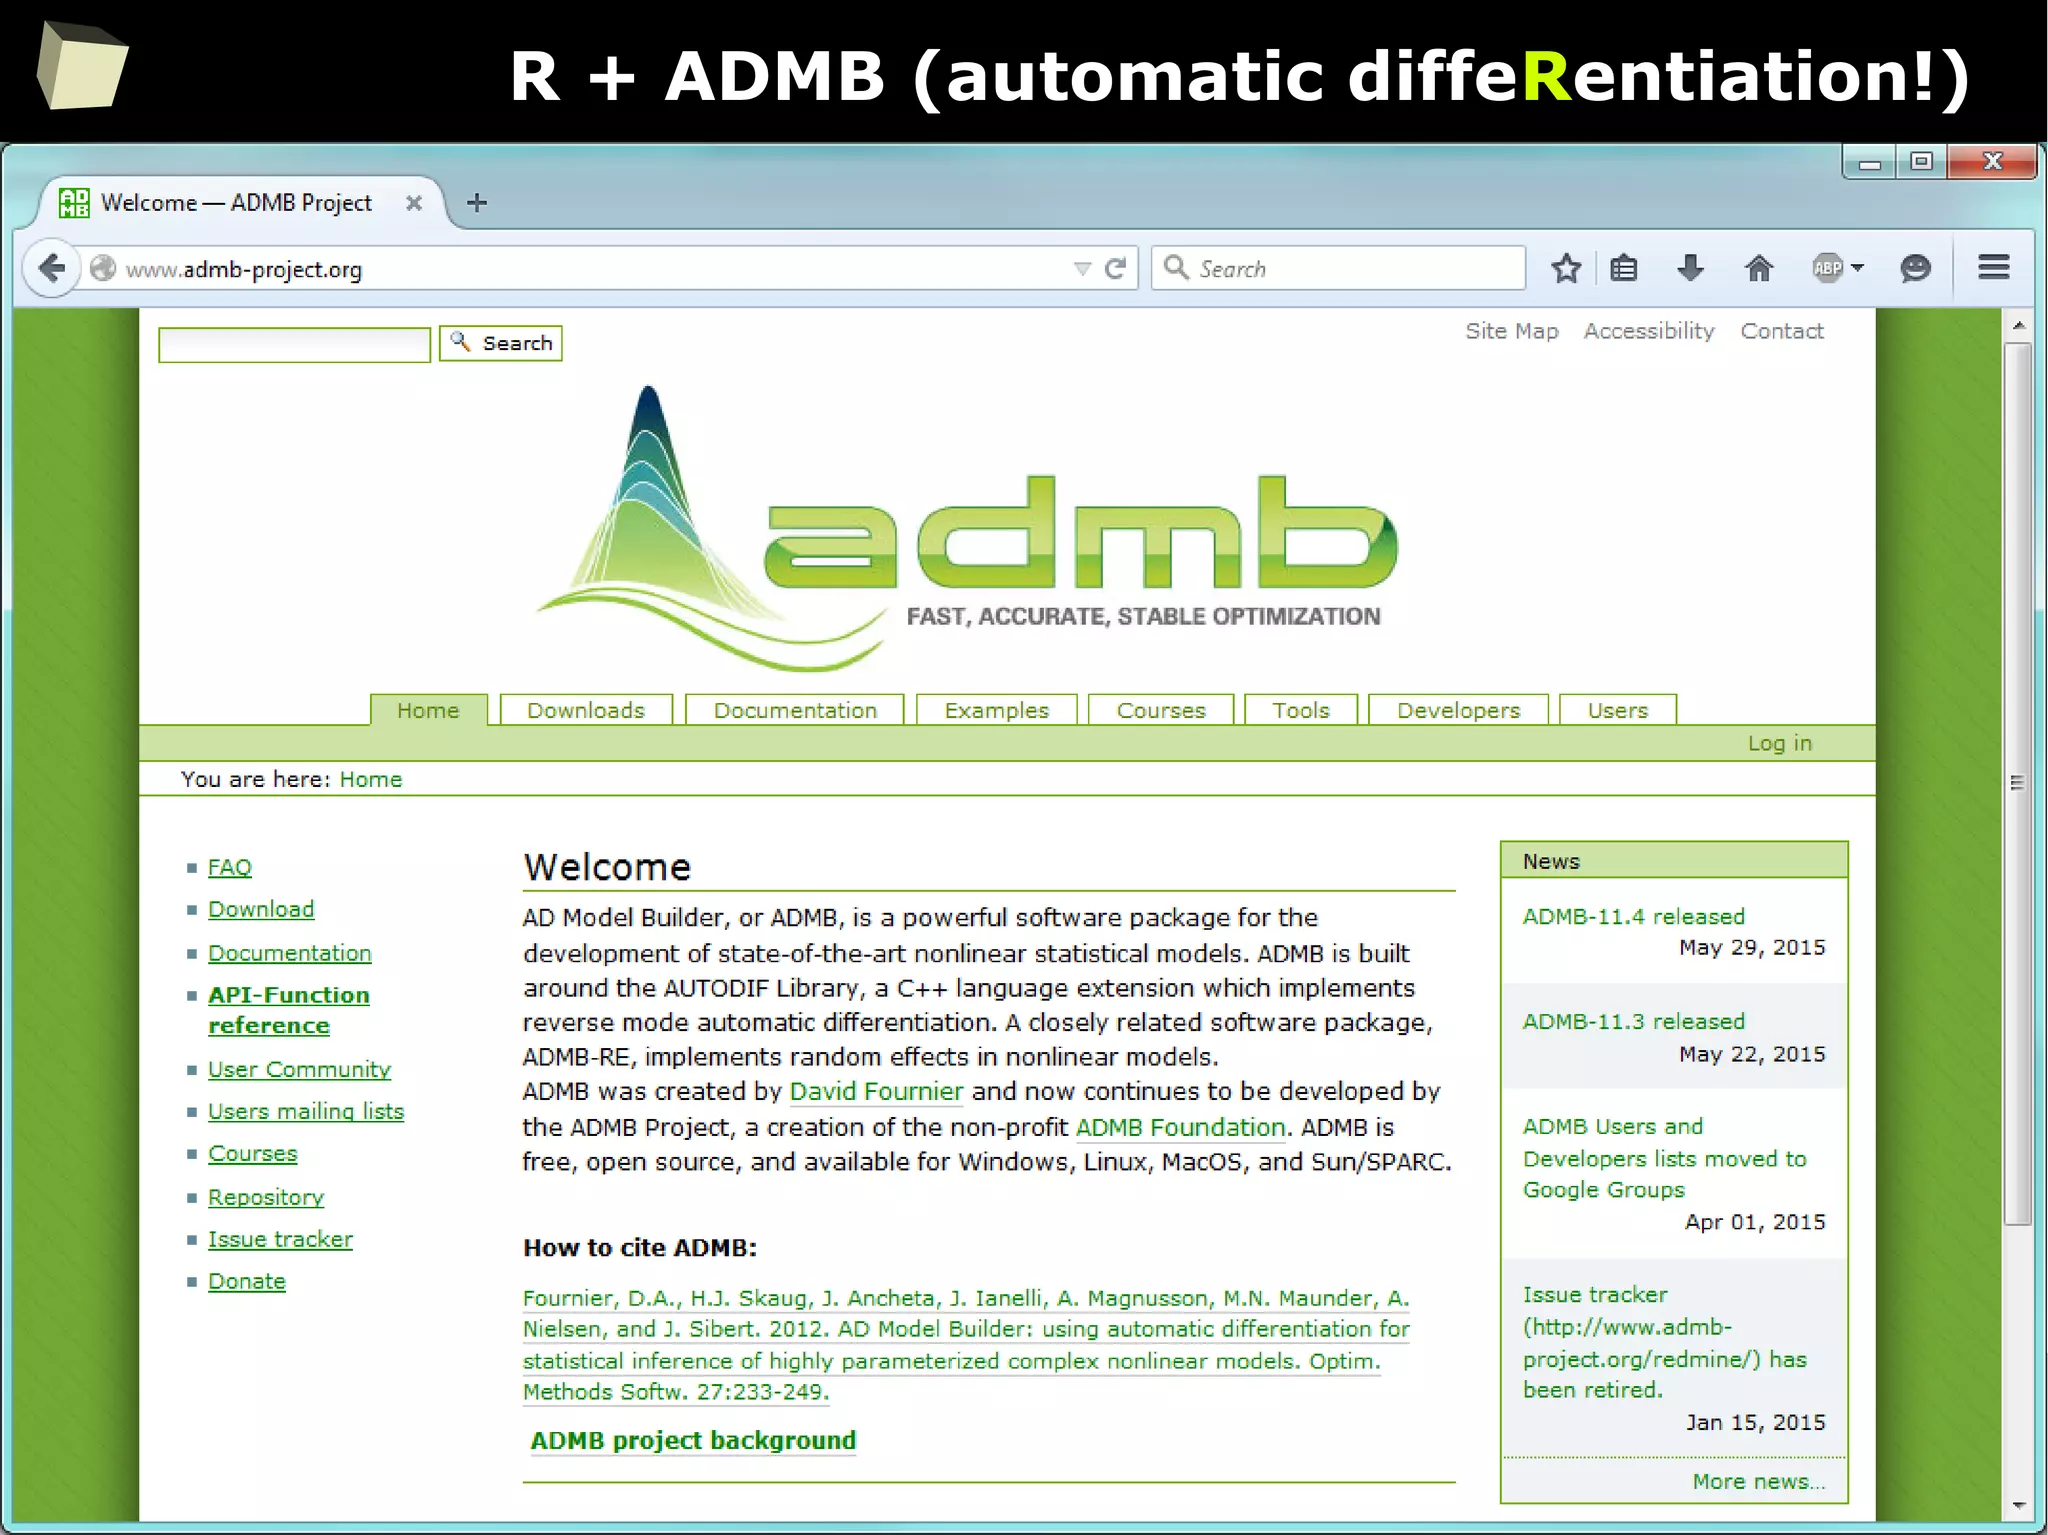
![73
Analysis of dose-Response curves [cont'd]
http://www.jstatsoft.org/v29/i07/paper](https://image.slidesharecdn.com/is-r-suitable-enough-for-clinical-research-160113193220/75/GNU-R-in-Clinical-Research-and-Evidence-Based-Medicine-73-2048.jpg)


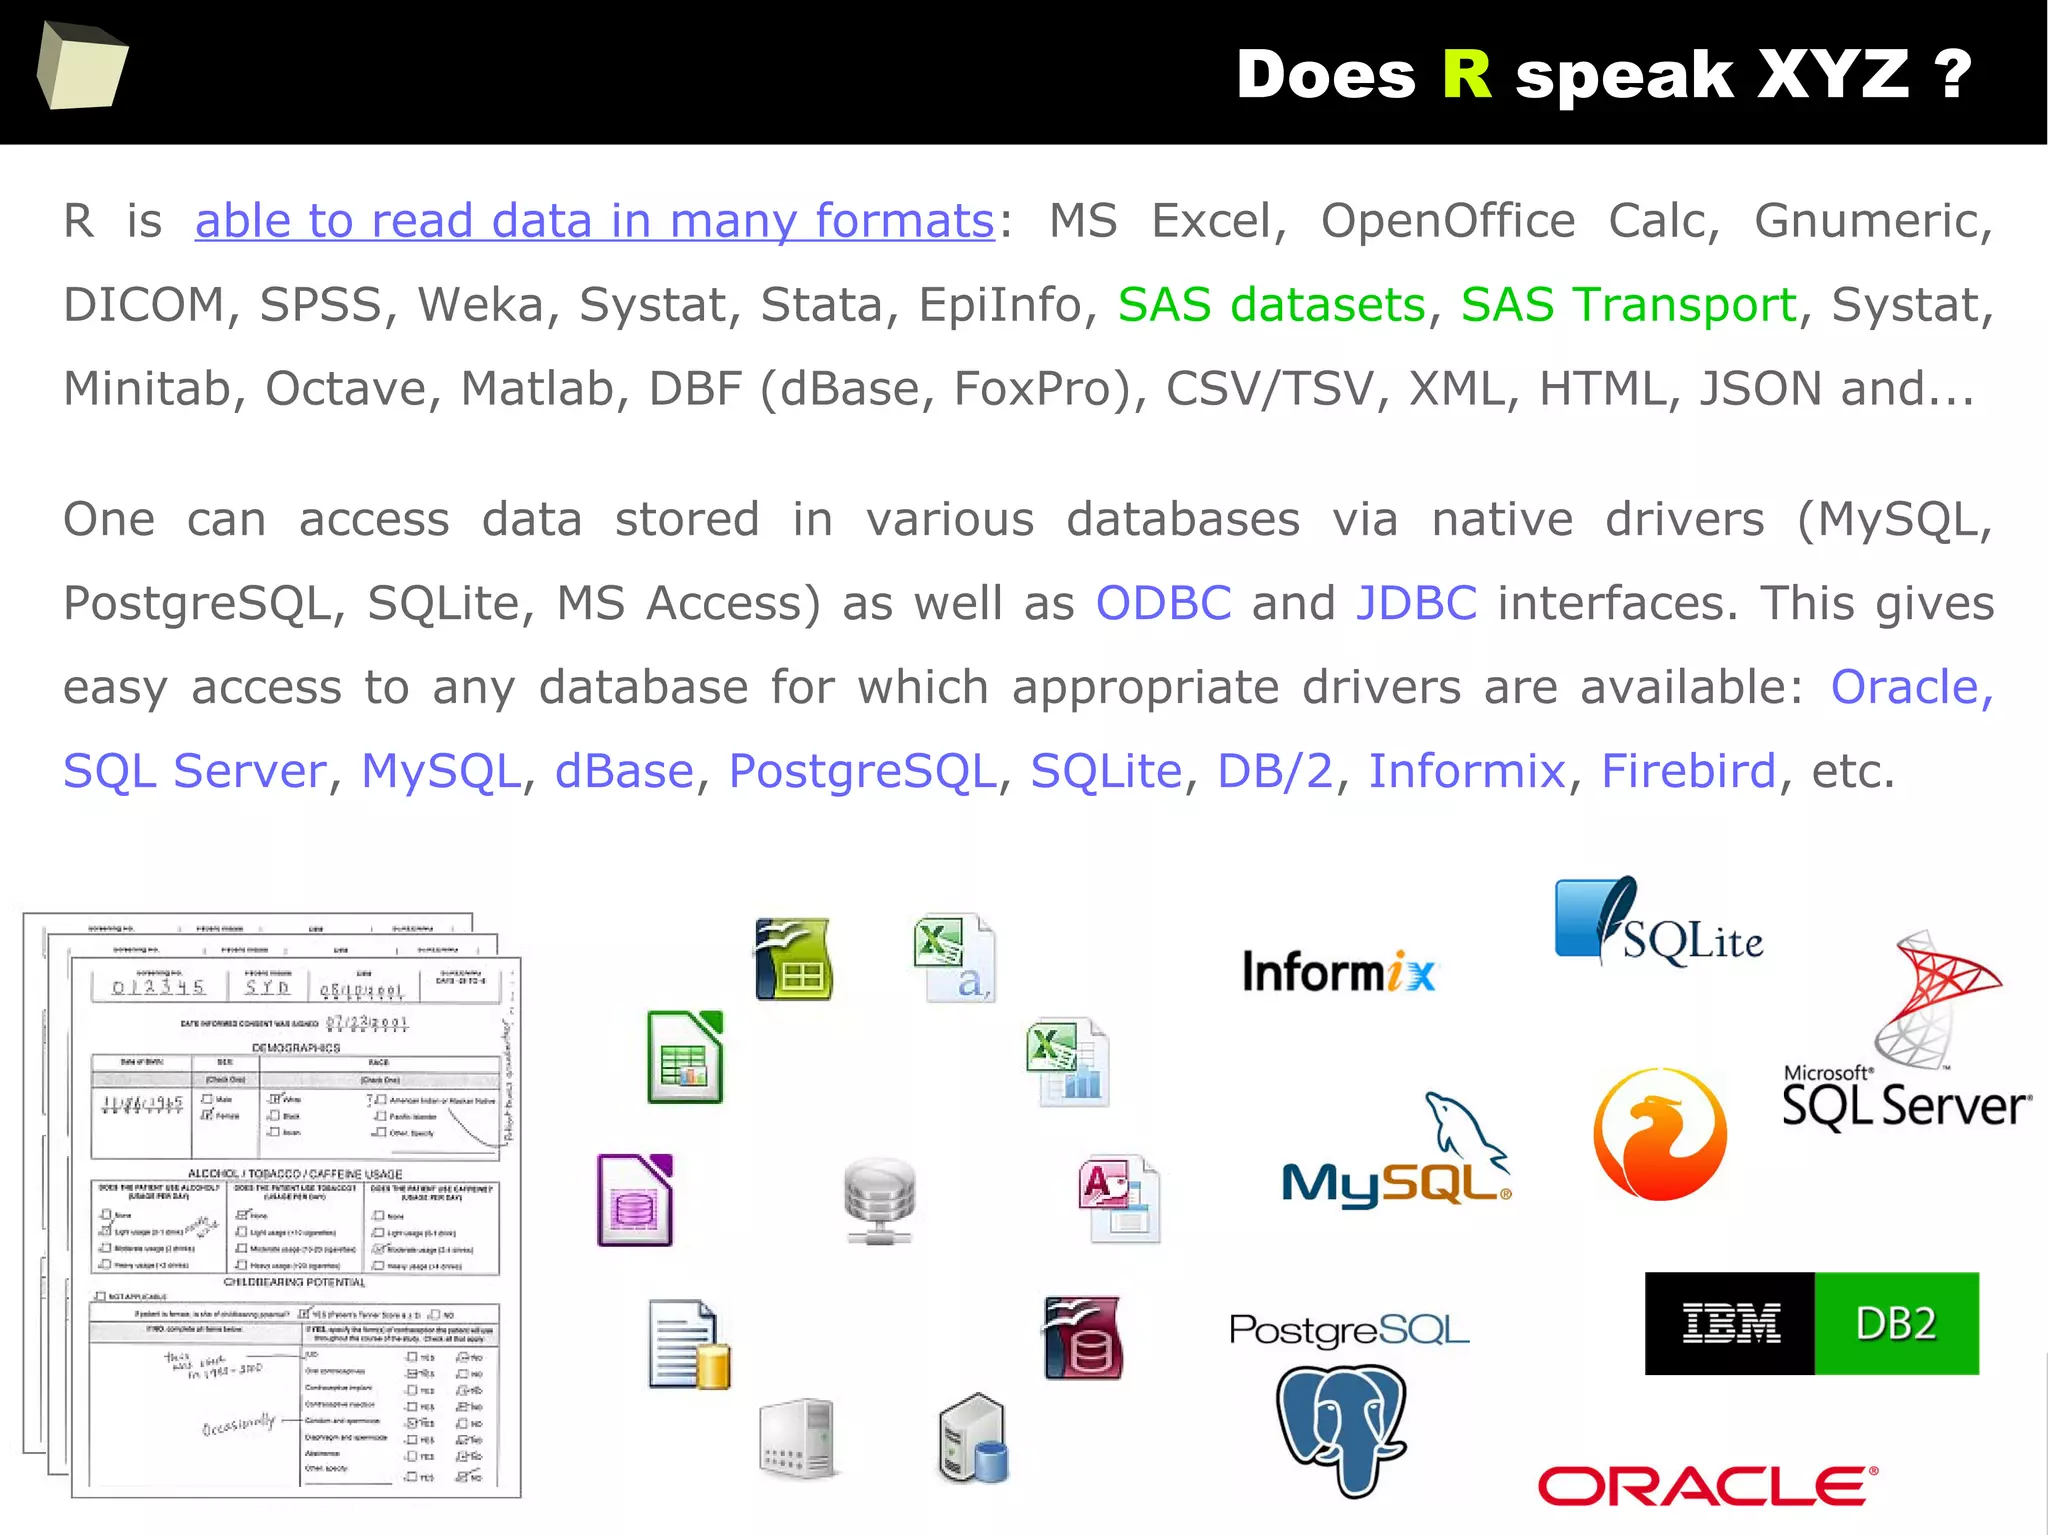
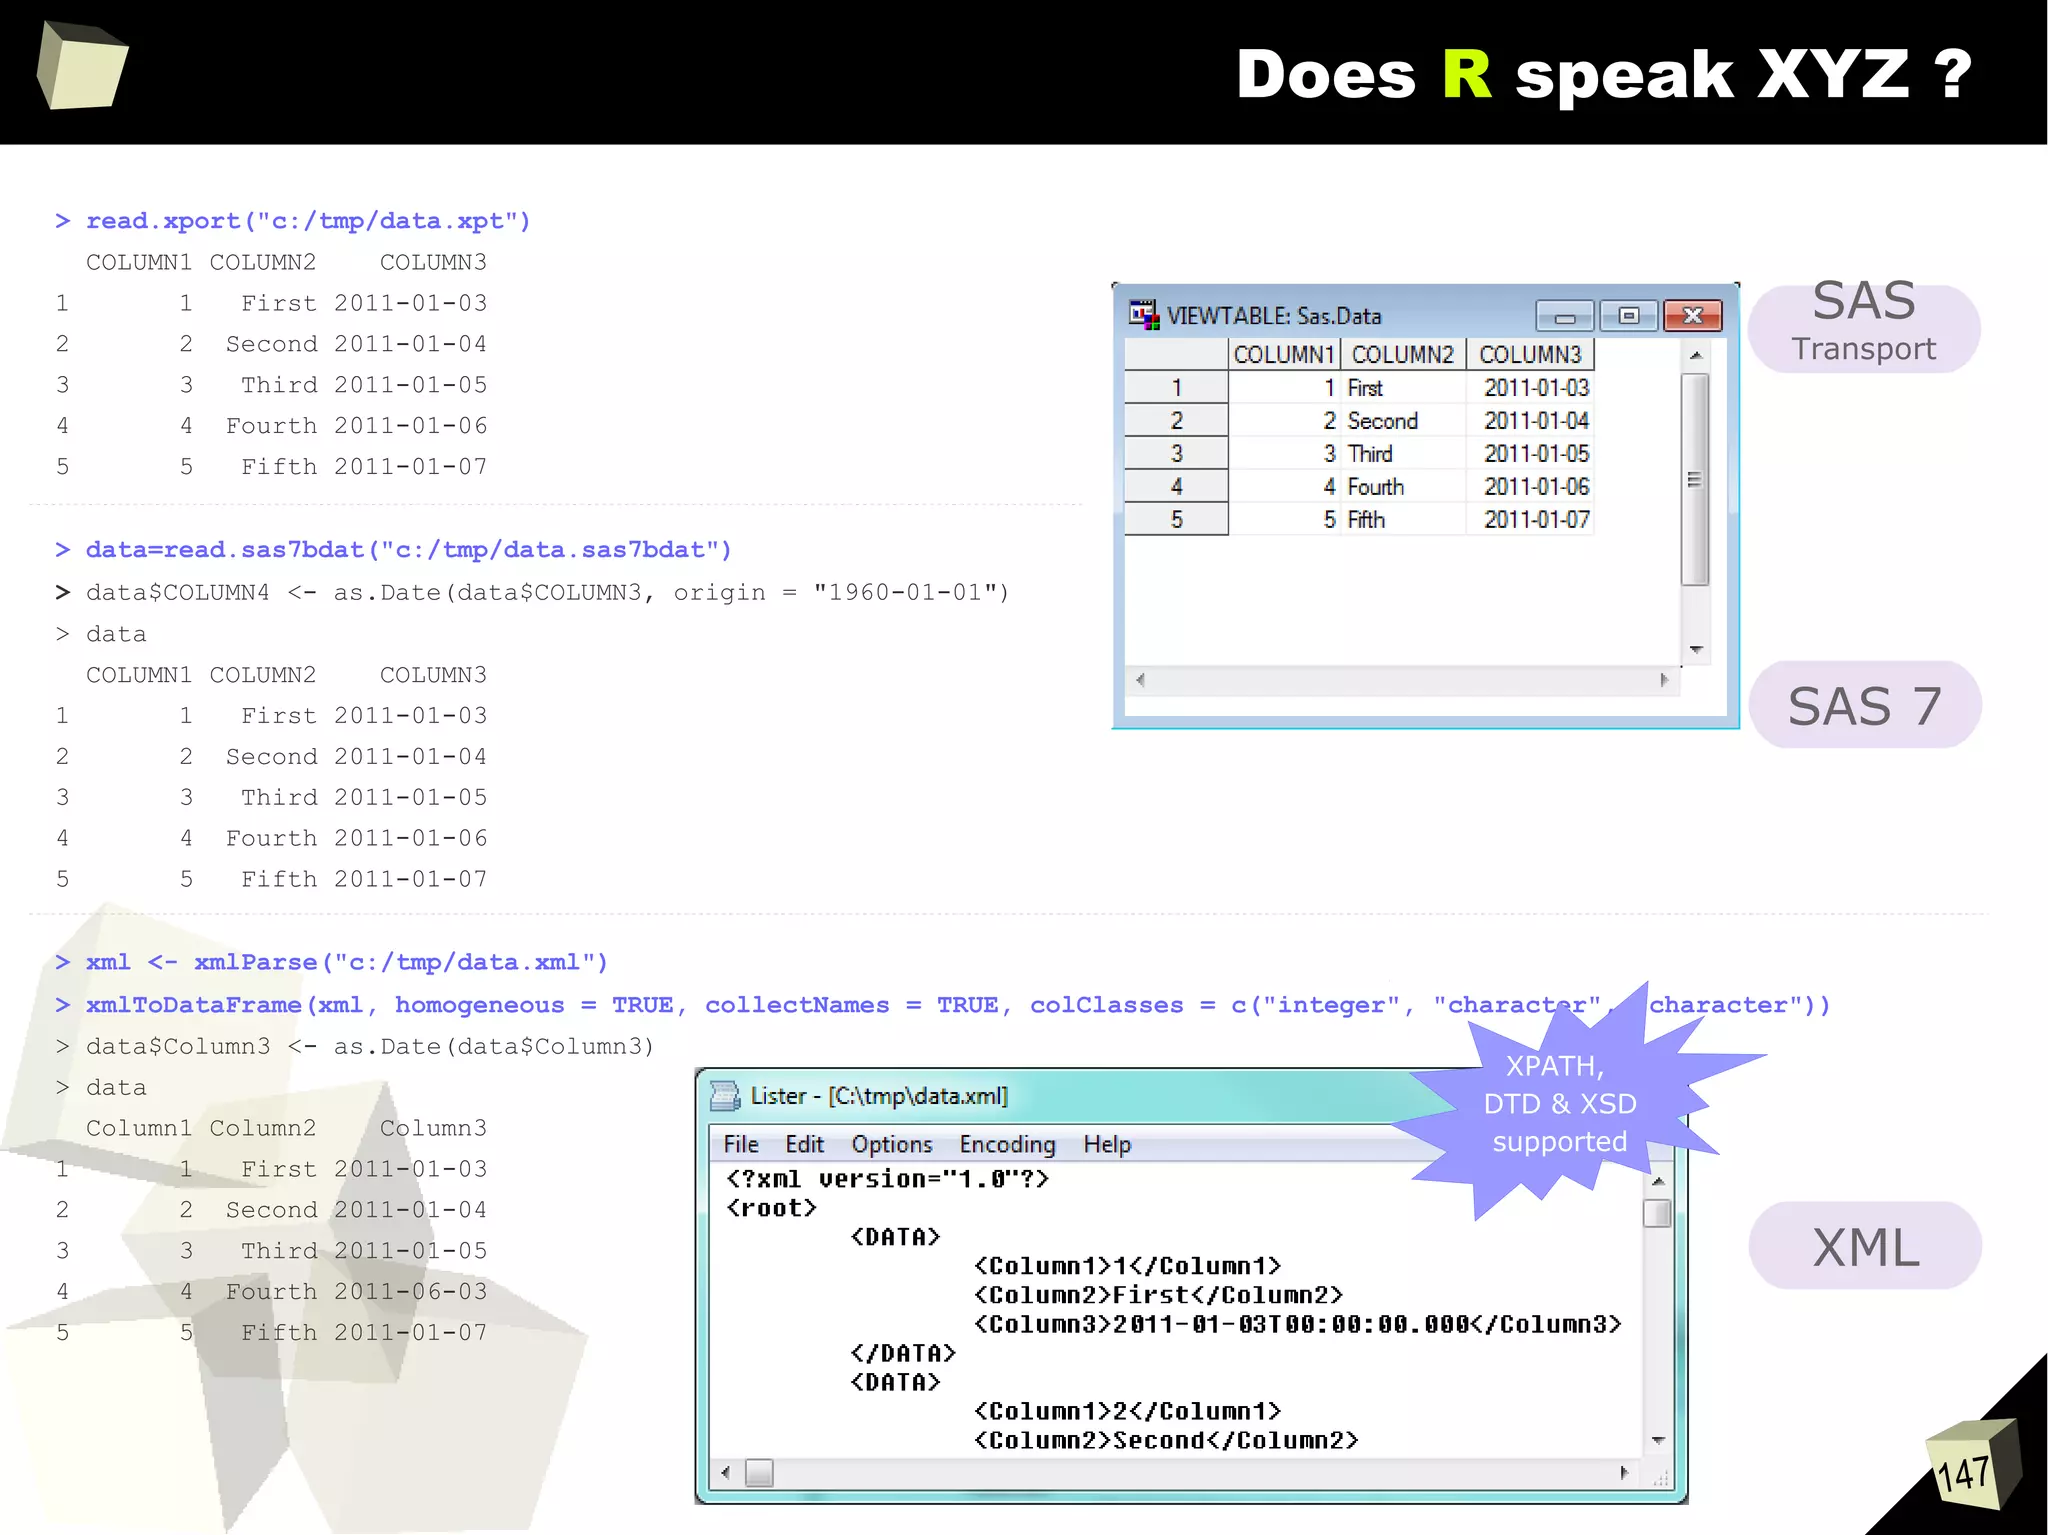
![146
Does R speak XYZ ?
> read.csv("c:/tmp/data.csv", header=TRUE, sep=";")
Column.1 Column.2 Column.3
1 1 First 2011-01-03
2 2 Second 2011-01-04
3 3 Third 2011-01-05
4 4 Fourth 2011-01-06
5 5 Fifth 2011-01-07
> sqldf::read.csv.sql("c:/tmp/data.csv", sql="SELECT * FROM file f WHERE f.`Column.1` BETWEEN 2 AND 3", sep=";")
Column.1 Column.2 Column.3
1 2 Second 2011-01-04
2 3 Third 2011-01-05
> openxlsx::read.xlsx("c:/tmp/data.xlsx", sheet=1, colNames=TRUE, detectDates = TRUE)
Column.1 Column.2 Column.3
1 1 First 2011-01-03
2 2 Second 2011-01-04
3 3 Third 2011-01-05
4 4 Fourth 2011-01-06
5 5 Fifth 2011-01-07
> data <- read.ods("c:/tmp/data.ods", sheet=1)
> colnames(data) <- data[1, ]
> data[-1, ]
Column 1 Column 2 Column 3
2 1 First 2011-01-03
3 2 Second 2011-01-04
4 3 Third 2011-01-05
5 4 Fourth 2011-01-06
6 5 Fifth 2011-01-0
CSV
CSVSQL
Excel
Calc](https://image.slidesharecdn.com/is-r-suitable-enough-for-clinical-research-160113193220/75/GNU-R-in-Clinical-Research-and-Evidence-Based-Medicine-146-2048.jpg)
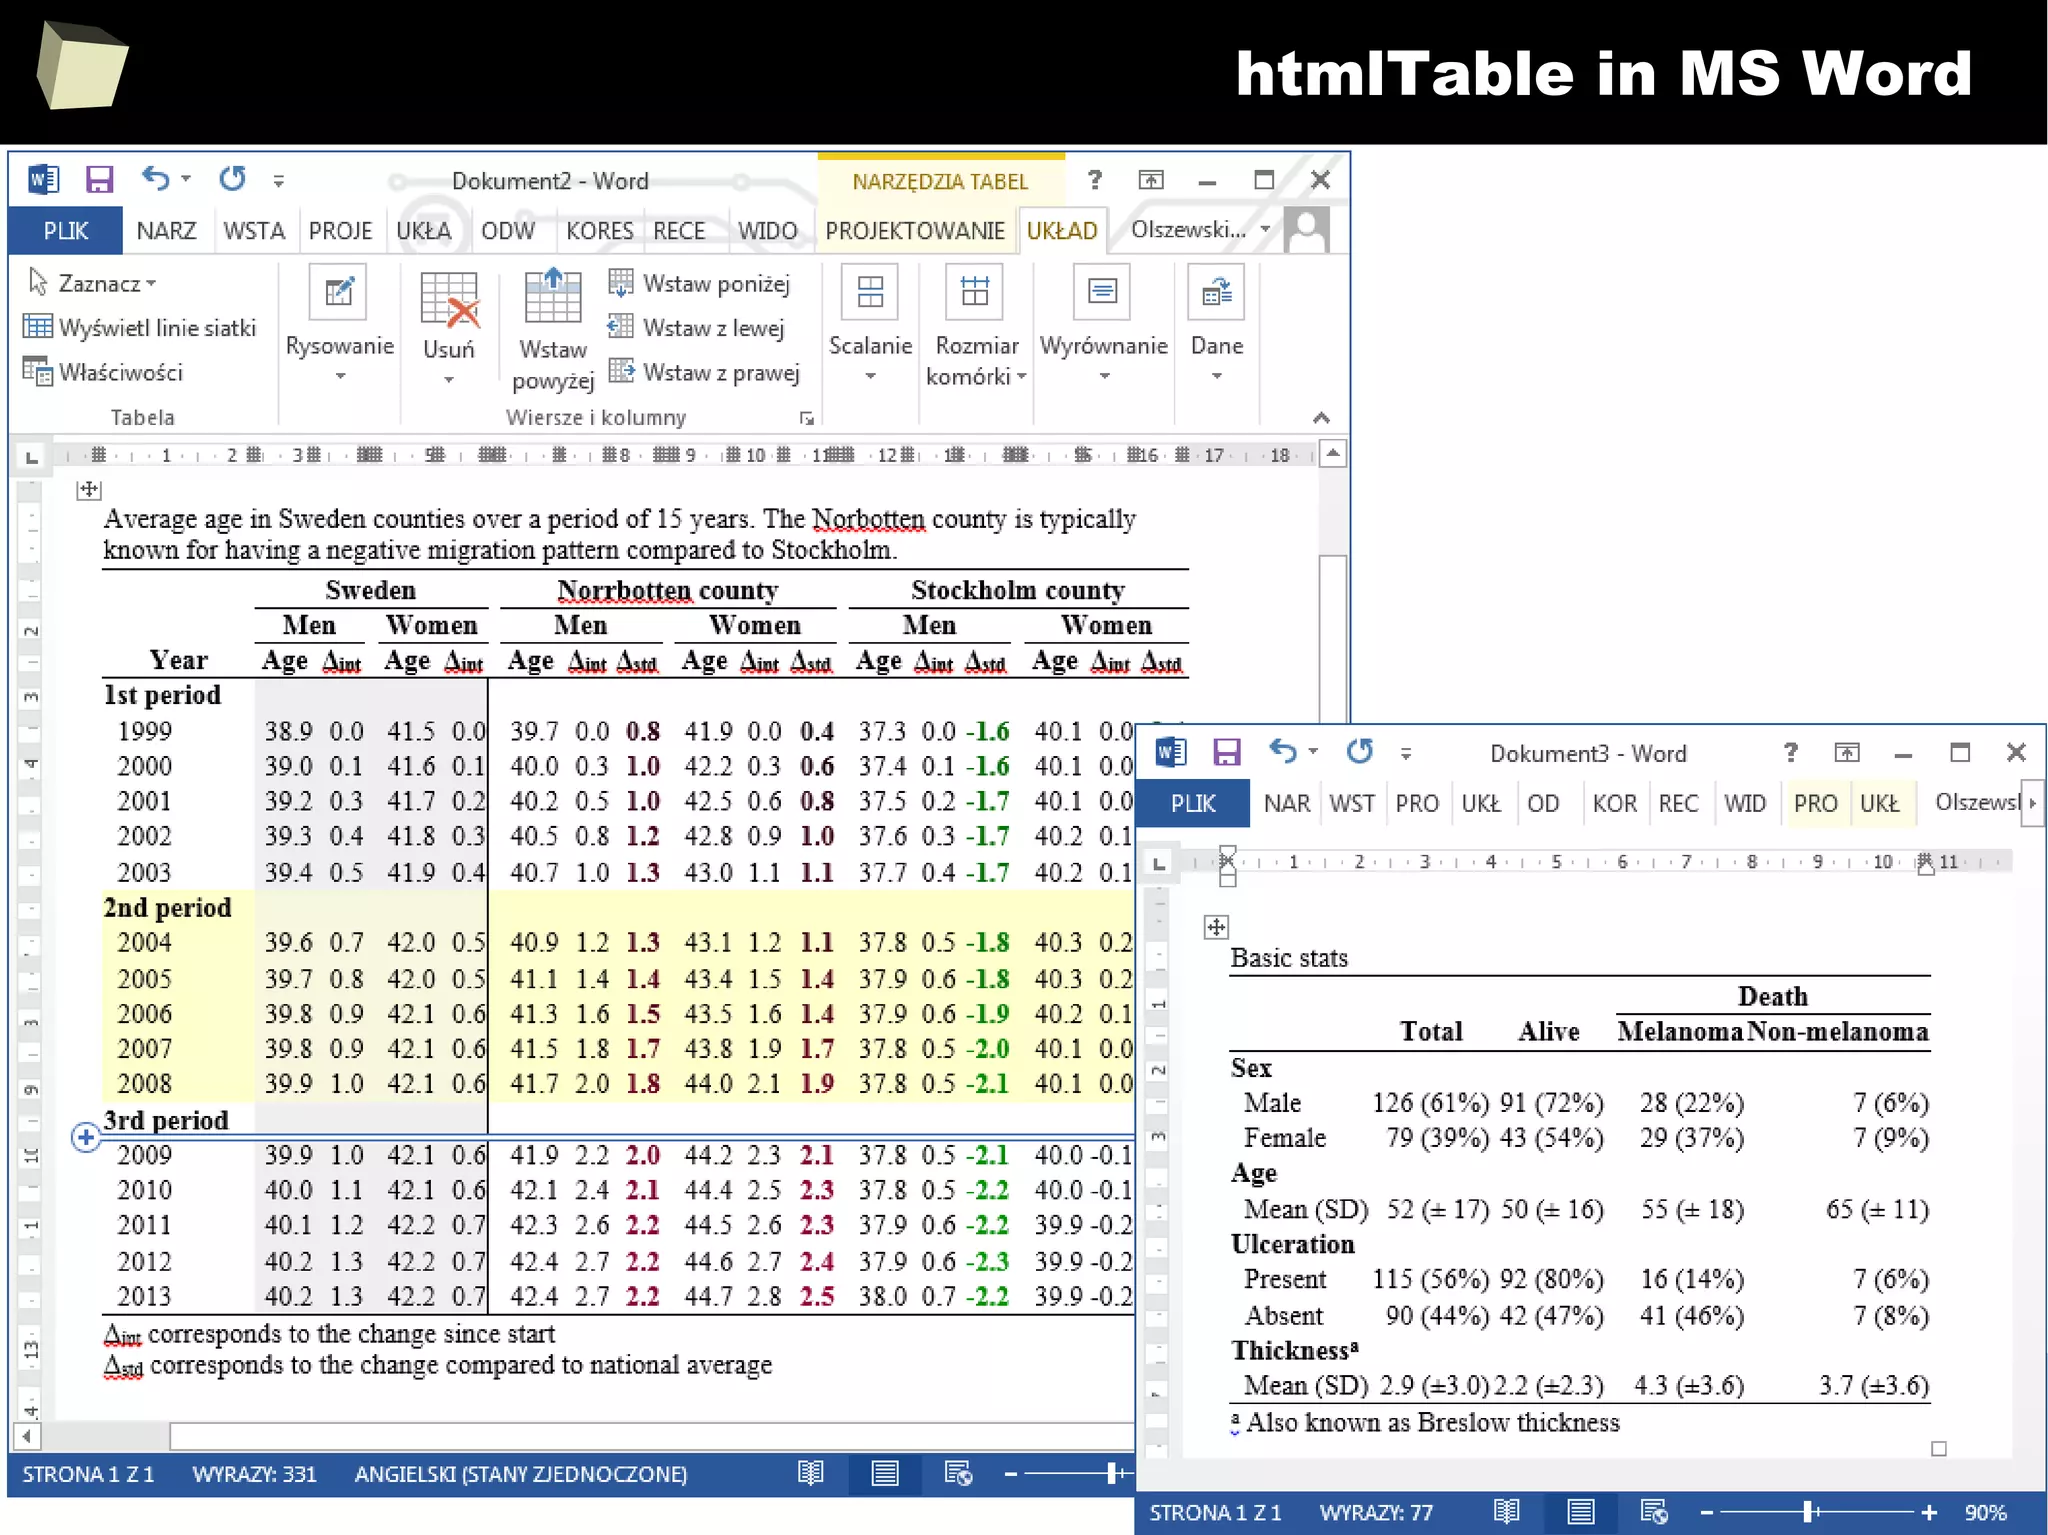
![148
Does R speak XYZ ?
> readHTMLTable("c:/tmp/data.html", header =T, which = 1)
Column 1 Column 2 Column 3
1 1 first 2011-01-03
2 2 second 2011-01-04
3 3 third 2011-01-05
4 4 fourth 2011-01-06
5 5 fifth 2011-01-07
> json
[1] "{"Column 1":["1","2","3","4","5"],"Column 2":
["First","Second","Third","Fourth","Fifth"],"Column 3":["2011-01-03","2011-01-04","2011-01-05","2011-01-
06","2011-01-07"]}"
> as.data.frame(fromJSON(json))
Column.1 Column.2 Column.3
1 1 First 2011-01-03
2 2 Second 2011-01-04
3 3 Third 2011-01-05
4 4 Fourth 2011-01-06
5 5 Fifth 2011-01-07
> read.table(file = "clipboard", sep = " ", header=TRUE) (# with some artefacts)
Column.1 Column.2 Column.3 X
1 1 First 2011-01-03 NA
2 2 Second 2011-01-04 NA
3 3 Third 2011-01-05 NA
4 4 Fourth 2011-01-06 NA
5 5 Fifth 2011-01-07 NA
HTML
JSON
Clipboard](https://image.slidesharecdn.com/is-r-suitable-enough-for-clinical-research-160113193220/75/GNU-R-in-Clinical-Research-and-Evidence-Based-Medicine-148-2048.jpg)

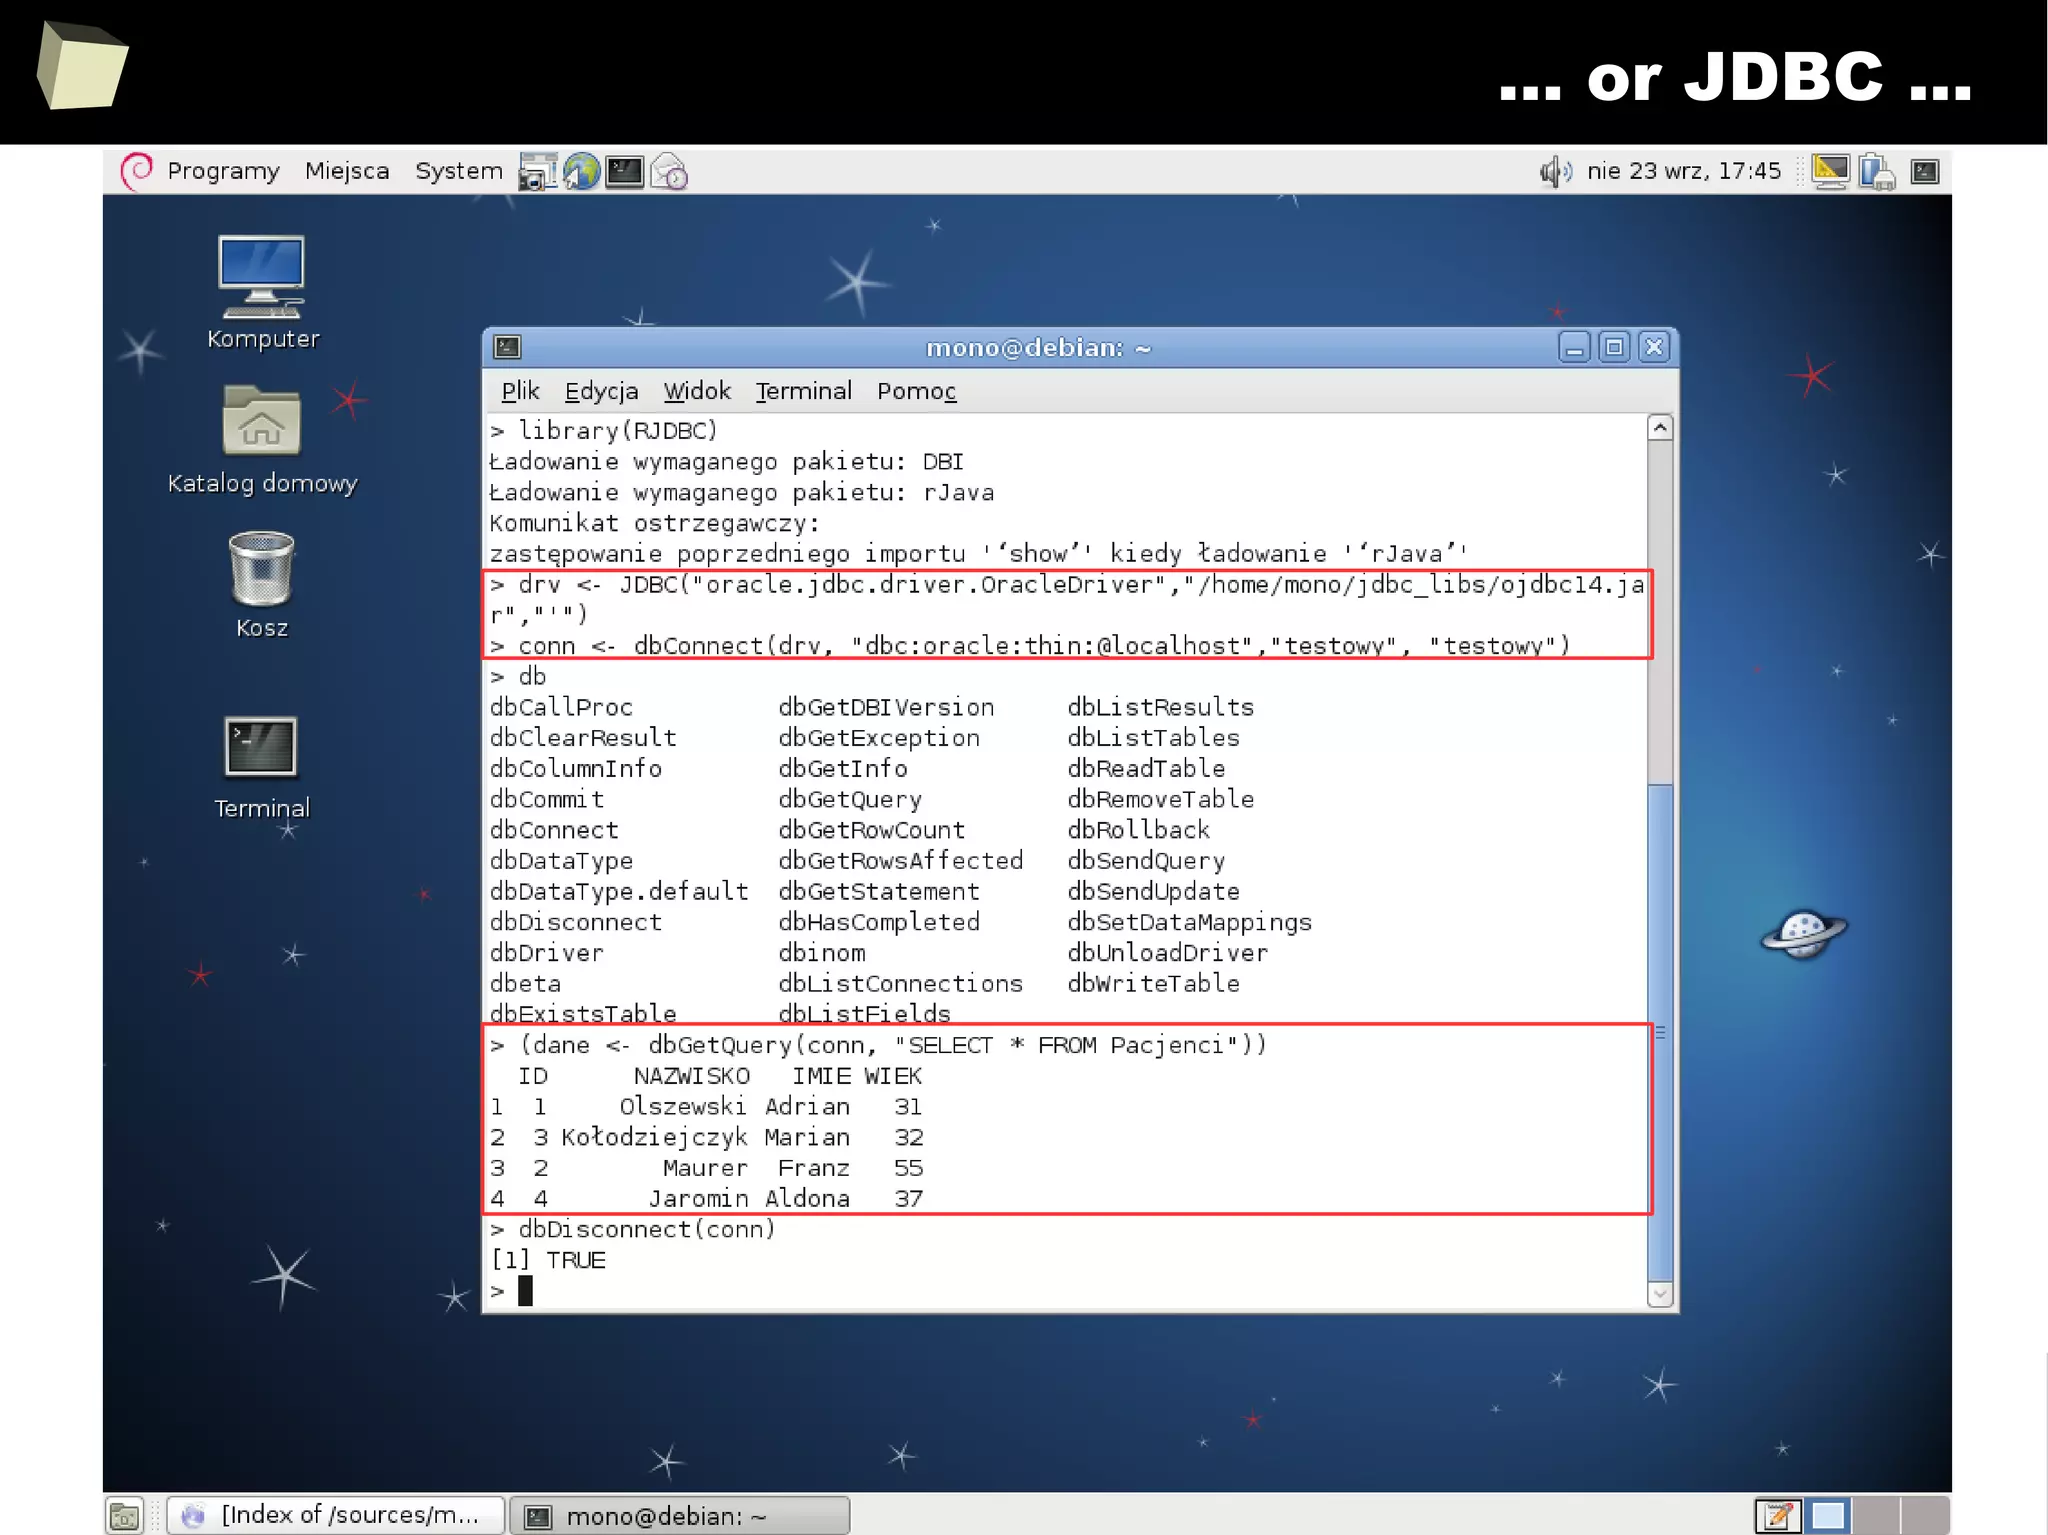
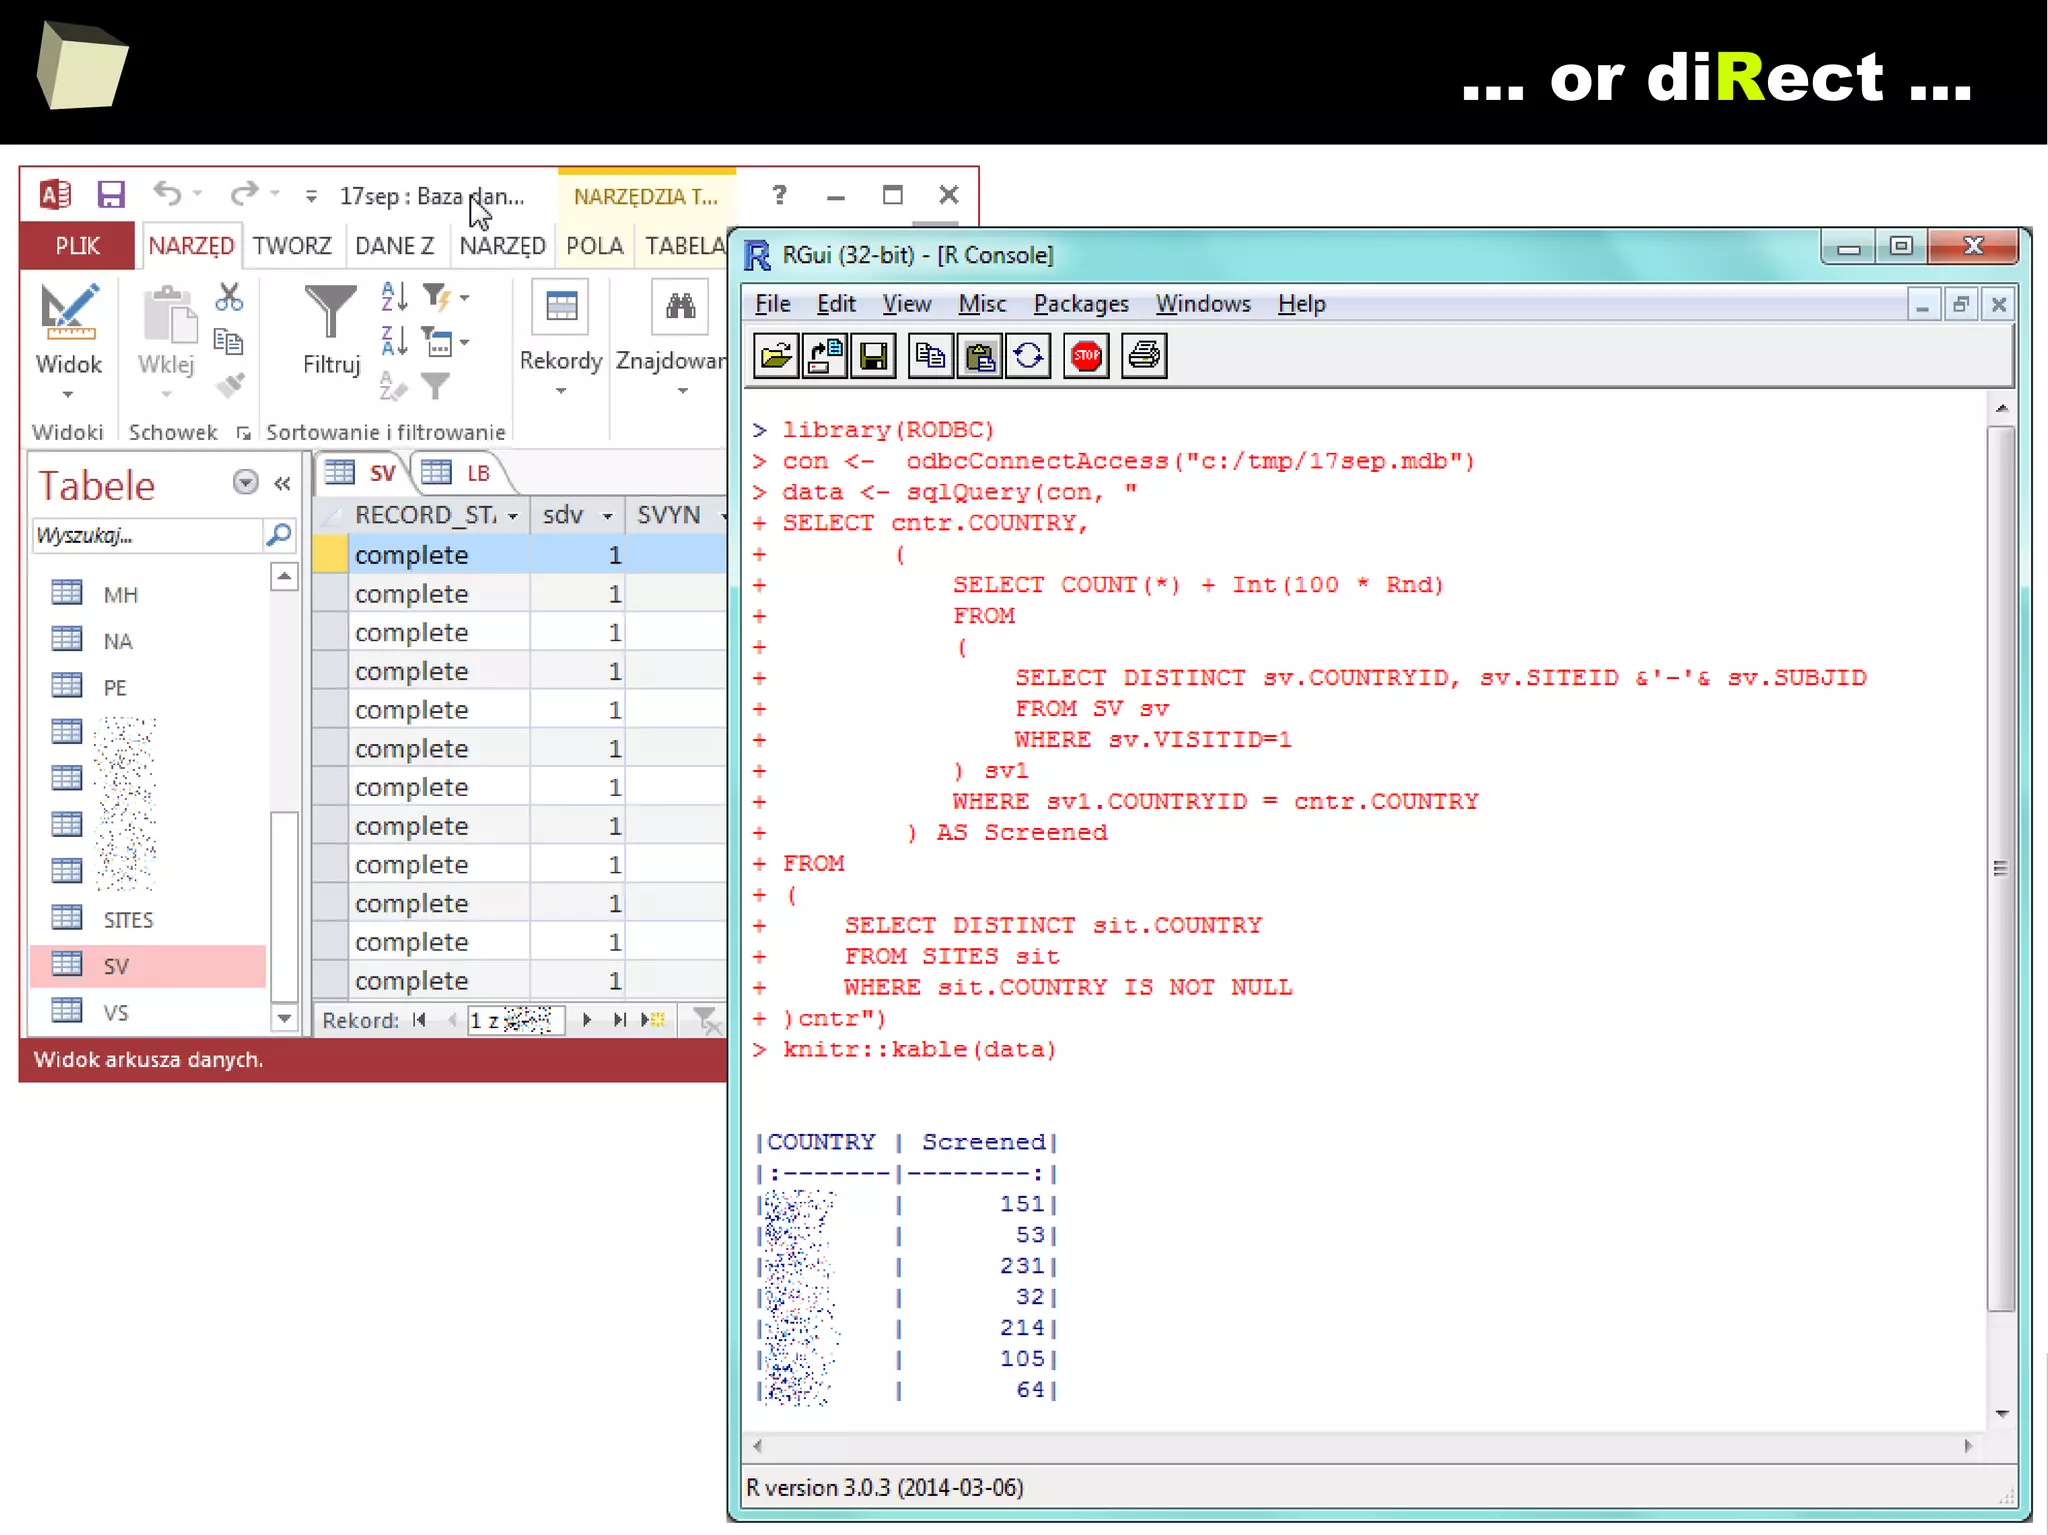
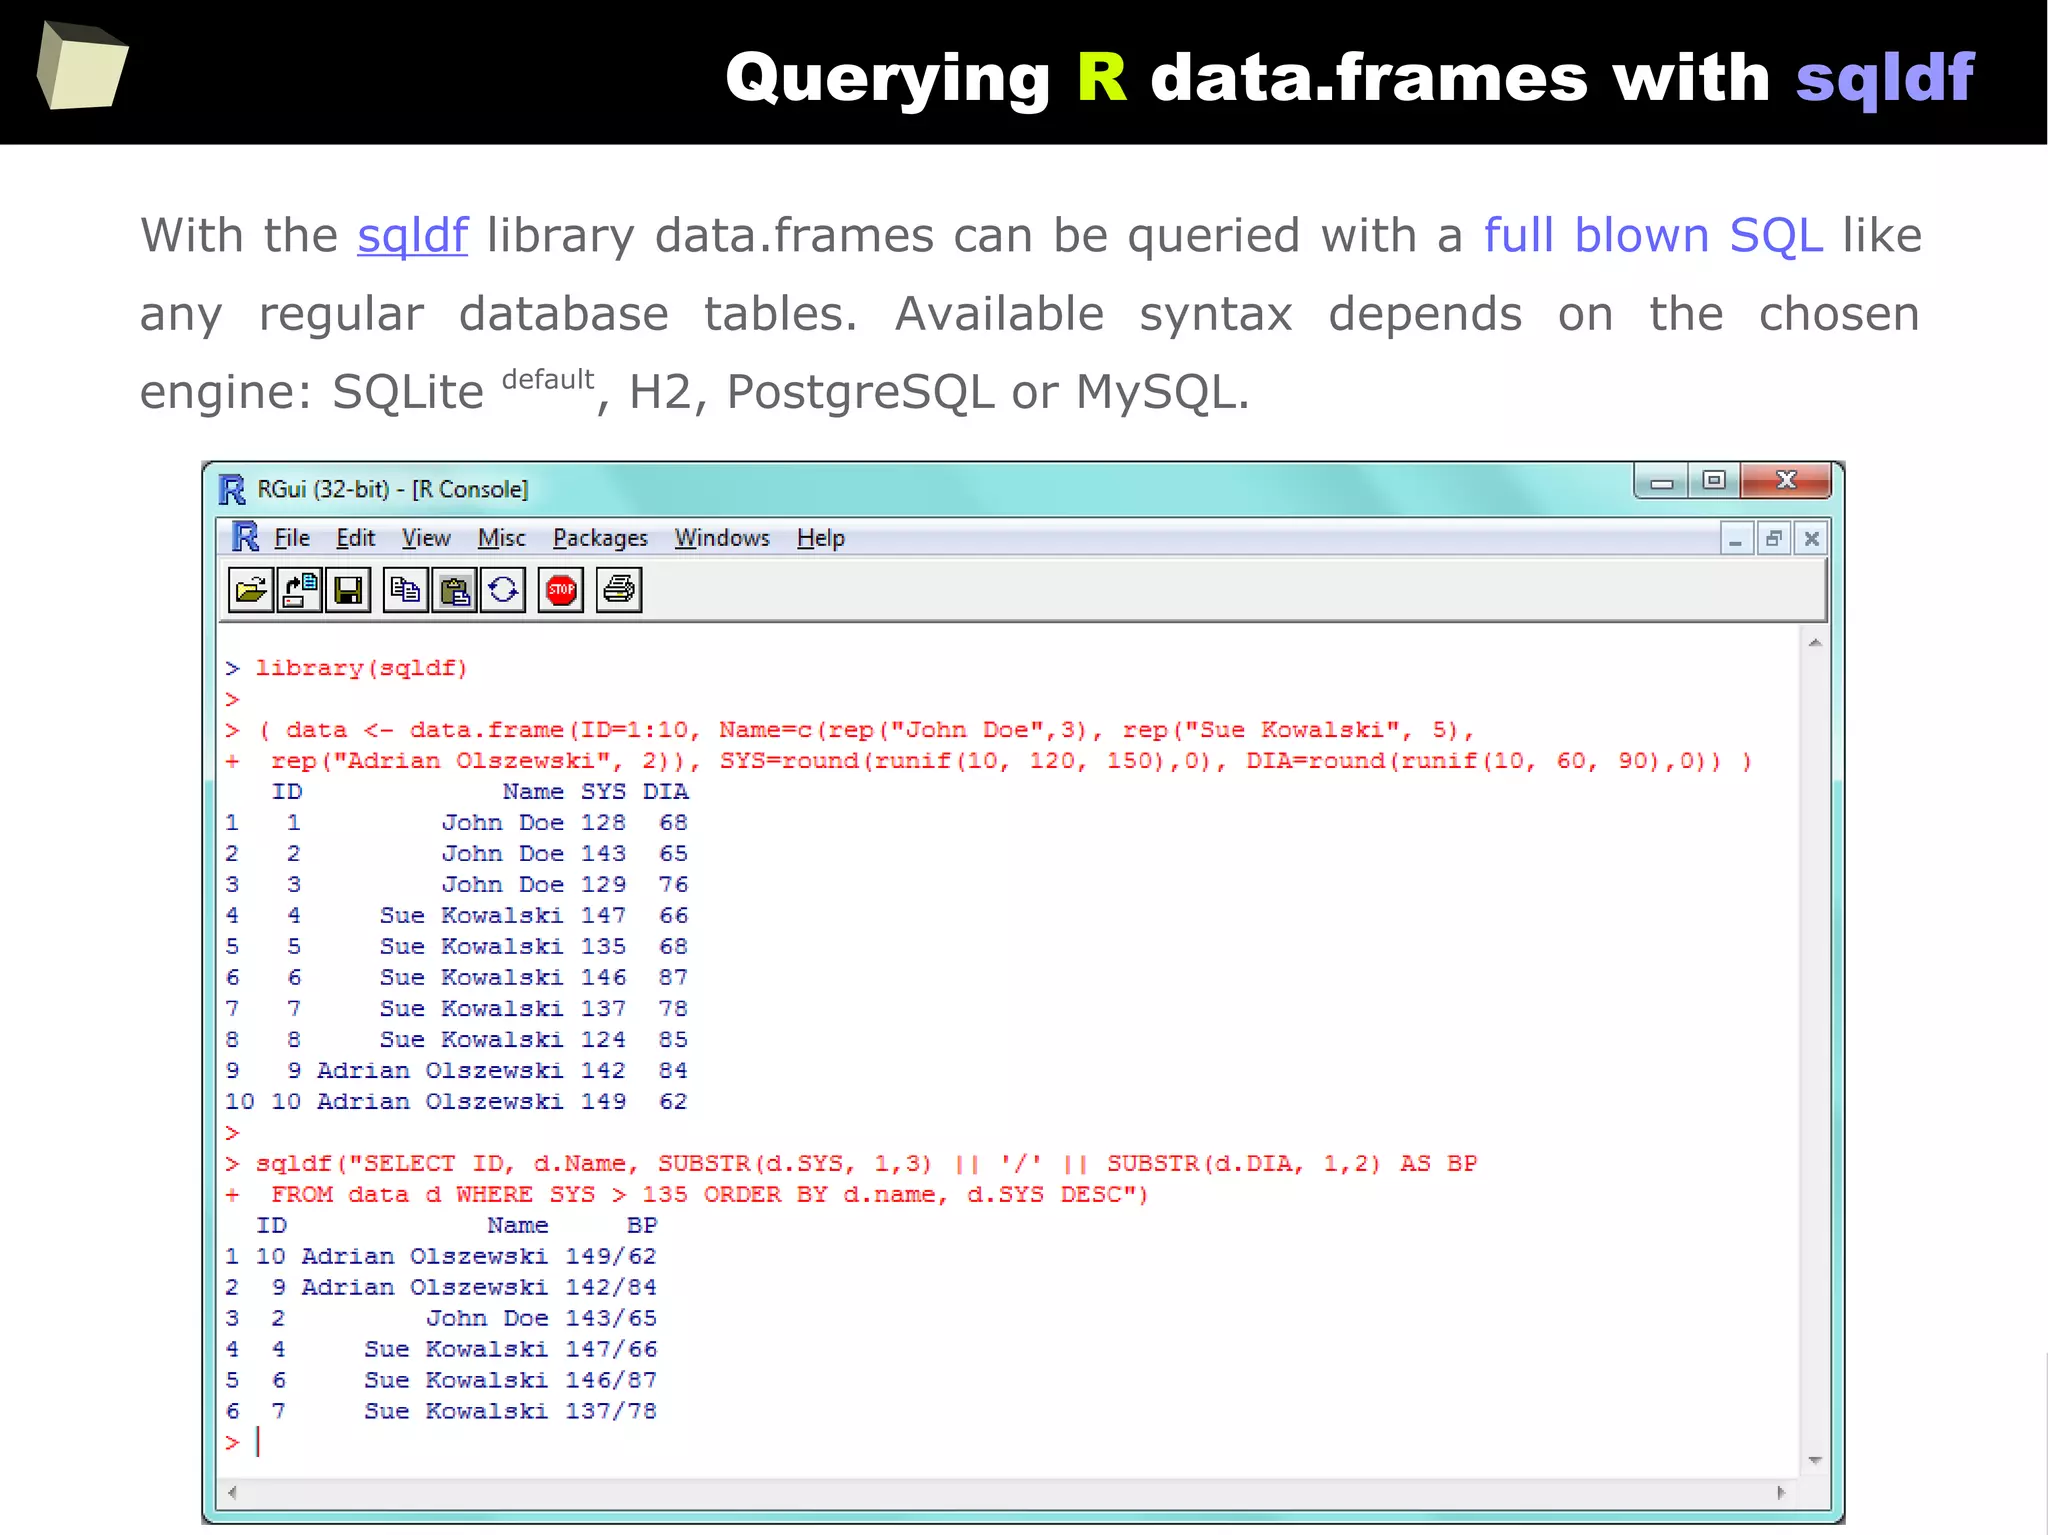
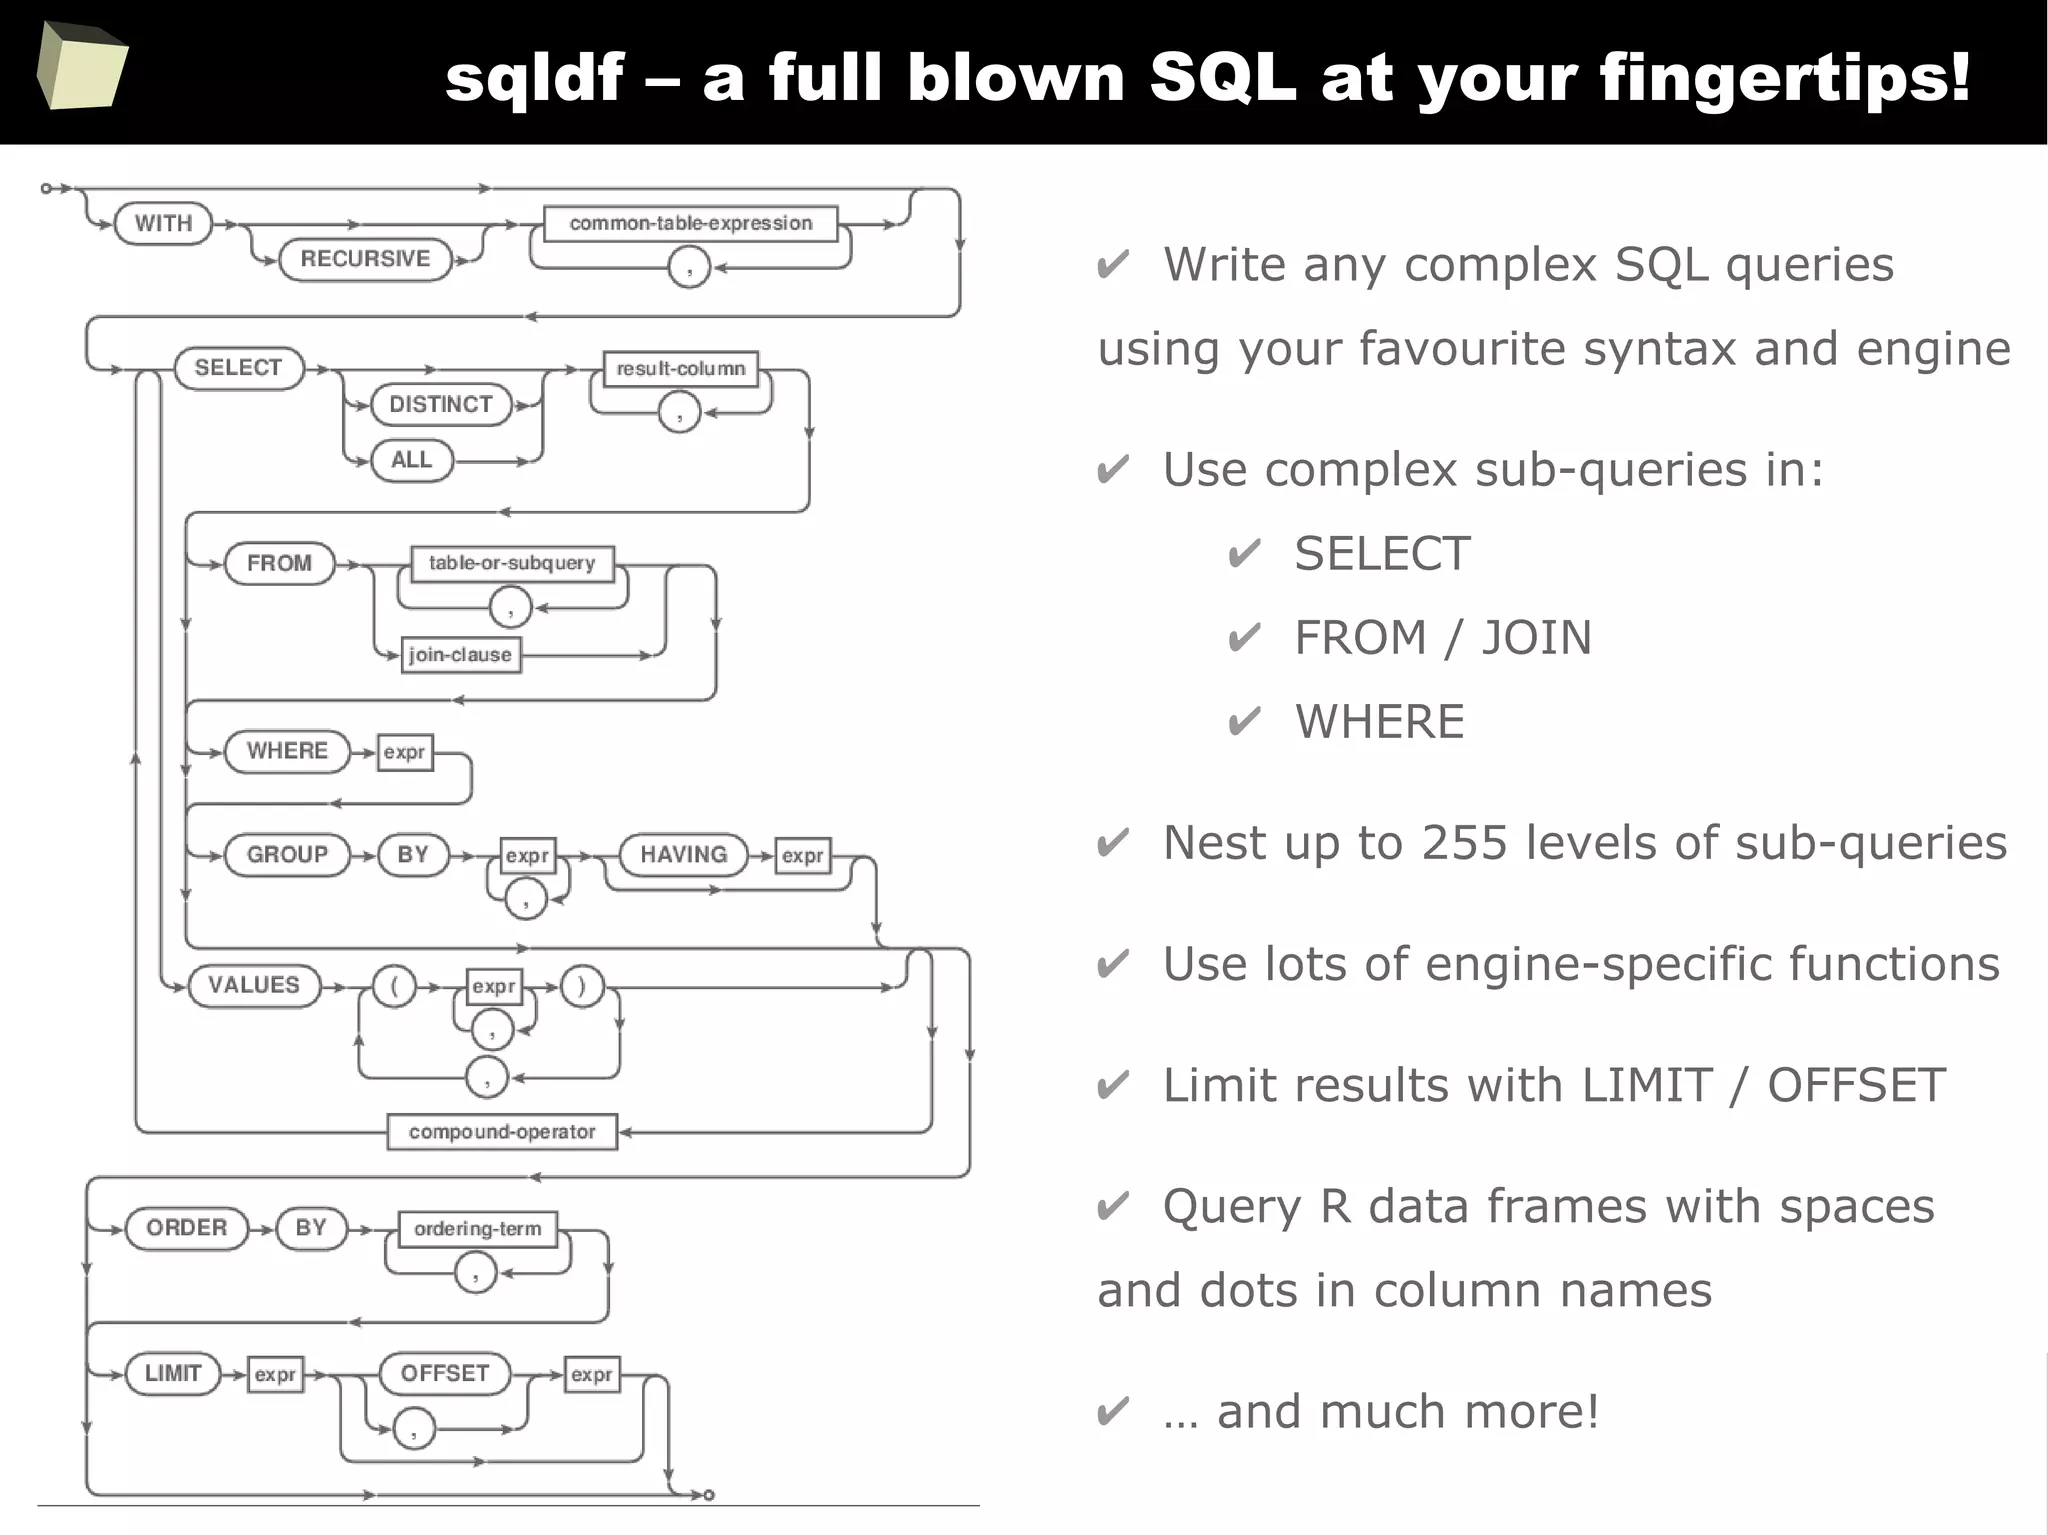

![163
Easy data transfeR
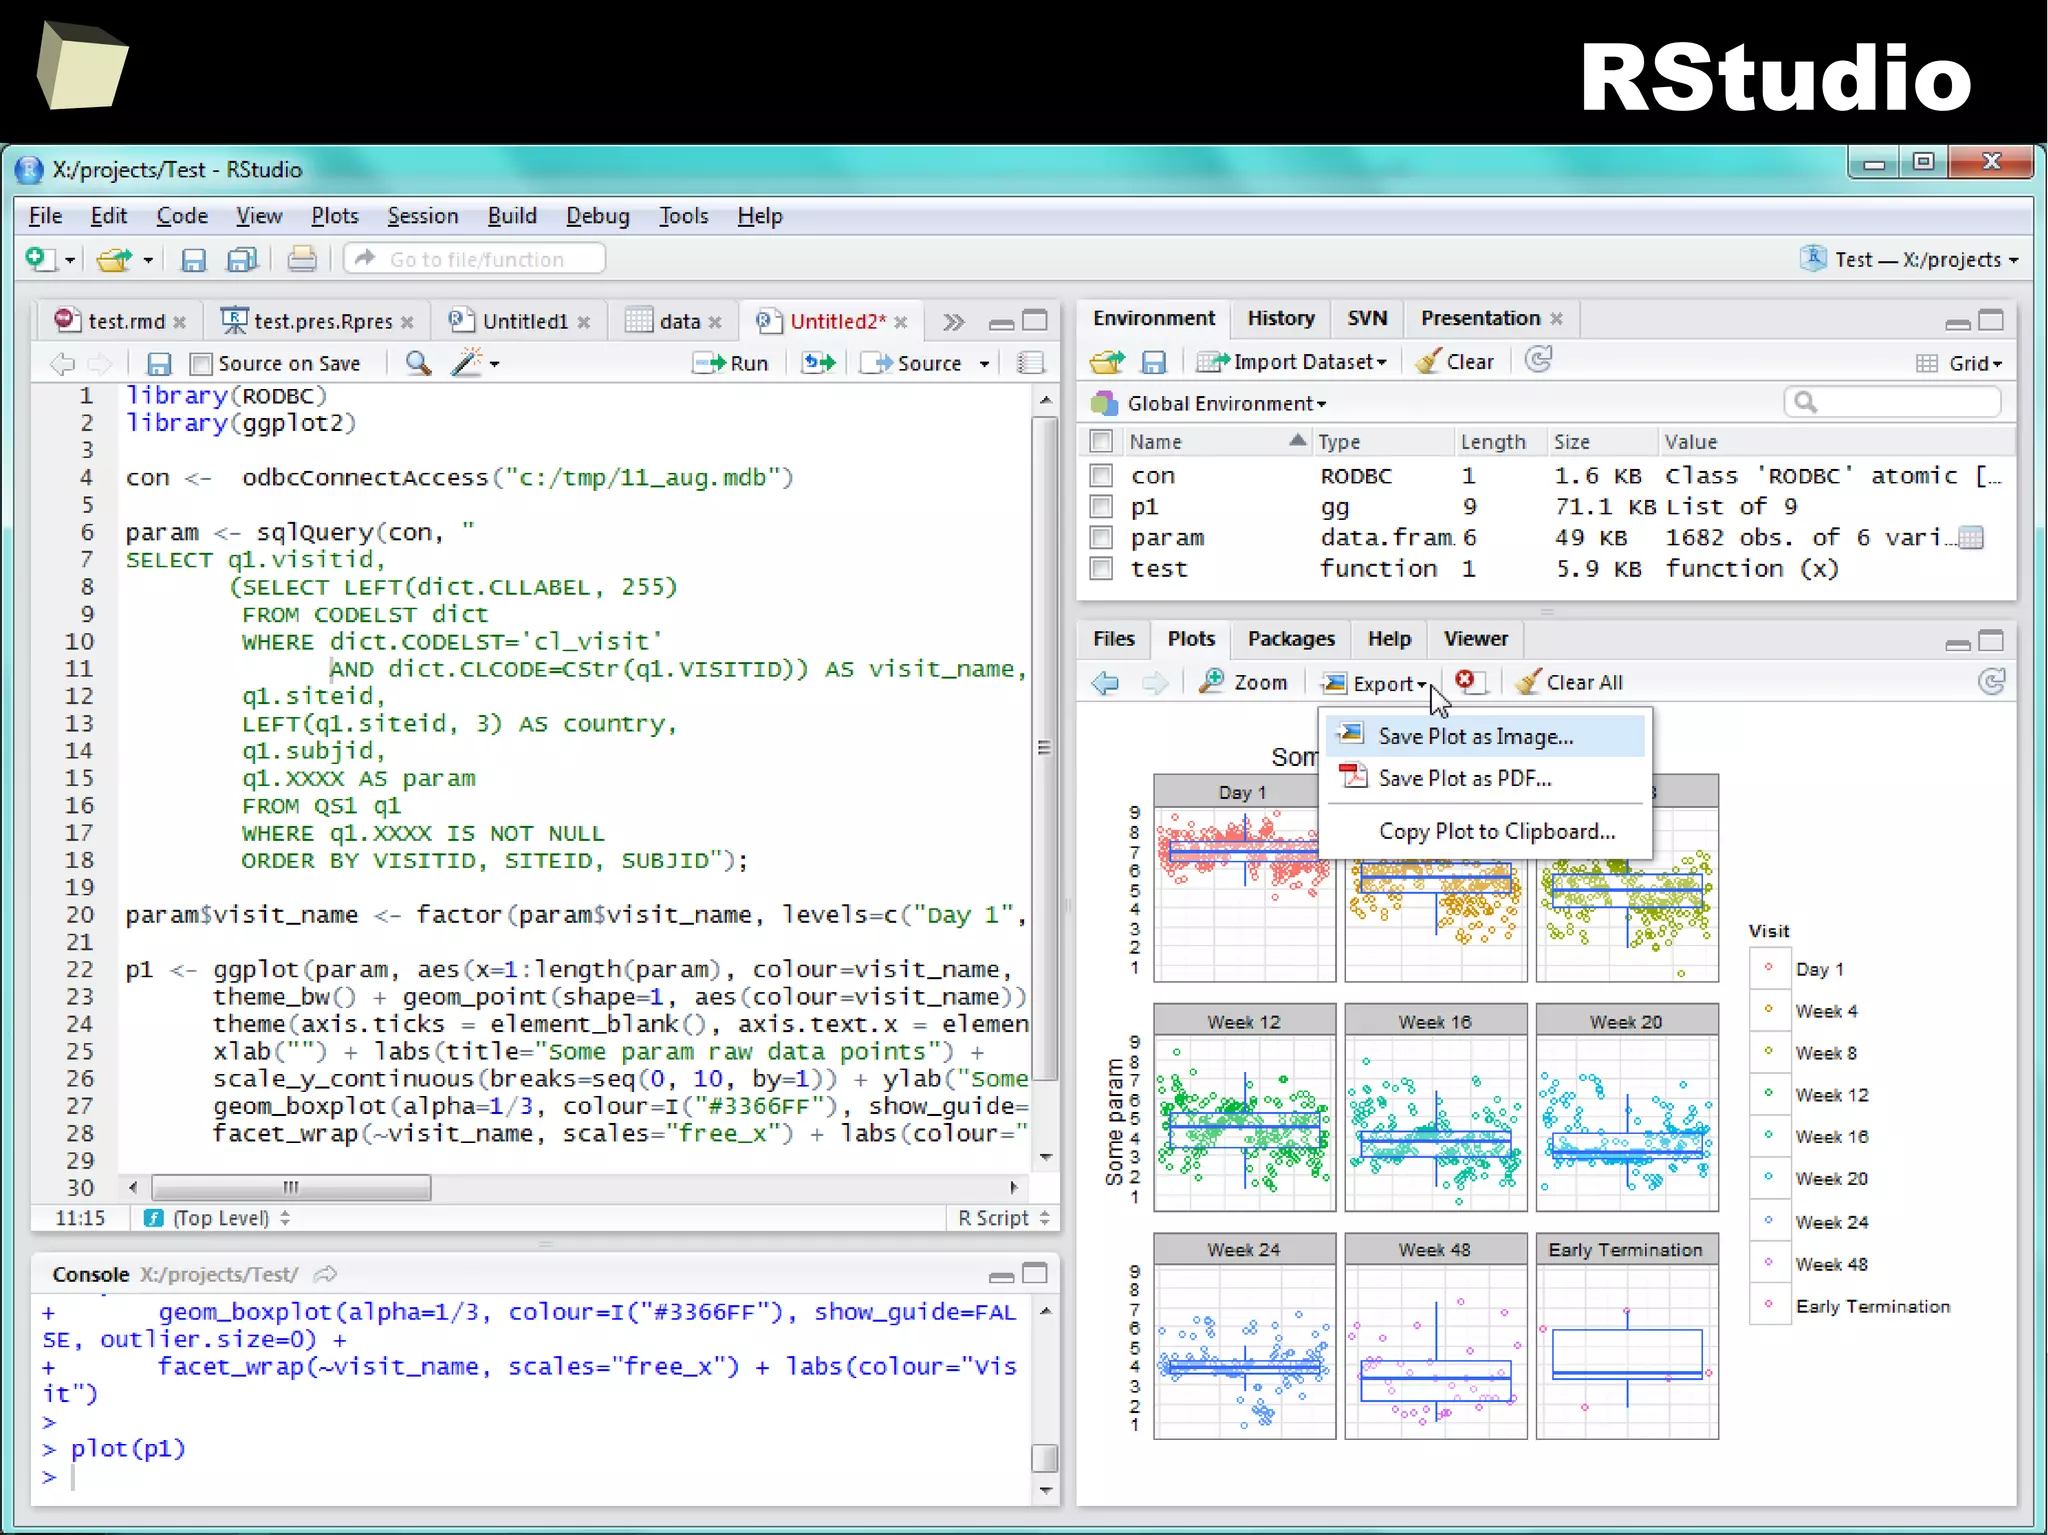
With R and a rich set of database drivers (ODBC, JDBC, native) it is easy to
transfer data between various sources with only few lines of code.
Actually, this is even easier than in C# :)
tables <- list()
tables[["tab1"]] <- read.csv("c:/tmp/table1.csv") # source 1
tables[["tab2"]] <- read.xlsx("c:/tmp/mysheet.xlsx", sheet=2) # source 2
tables[["tab3"]] <- sqlQuery(otherCon, "SELECT * FROM Table") # source 3
…
myCon <- odbcConnectAccess("c:/tmp/my.mdb"))
for(table in names(tables)){
sqlSave(myCon, tables[[table]], tablename = table) # that's all!
}
OdbcClose(myCon)
Isn't this just beautiful?](https://image.slidesharecdn.com/is-r-suitable-enough-for-clinical-research-160113193220/75/GNU-R-in-Clinical-Research-and-Evidence-Based-Medicine-163-2048.jpg)


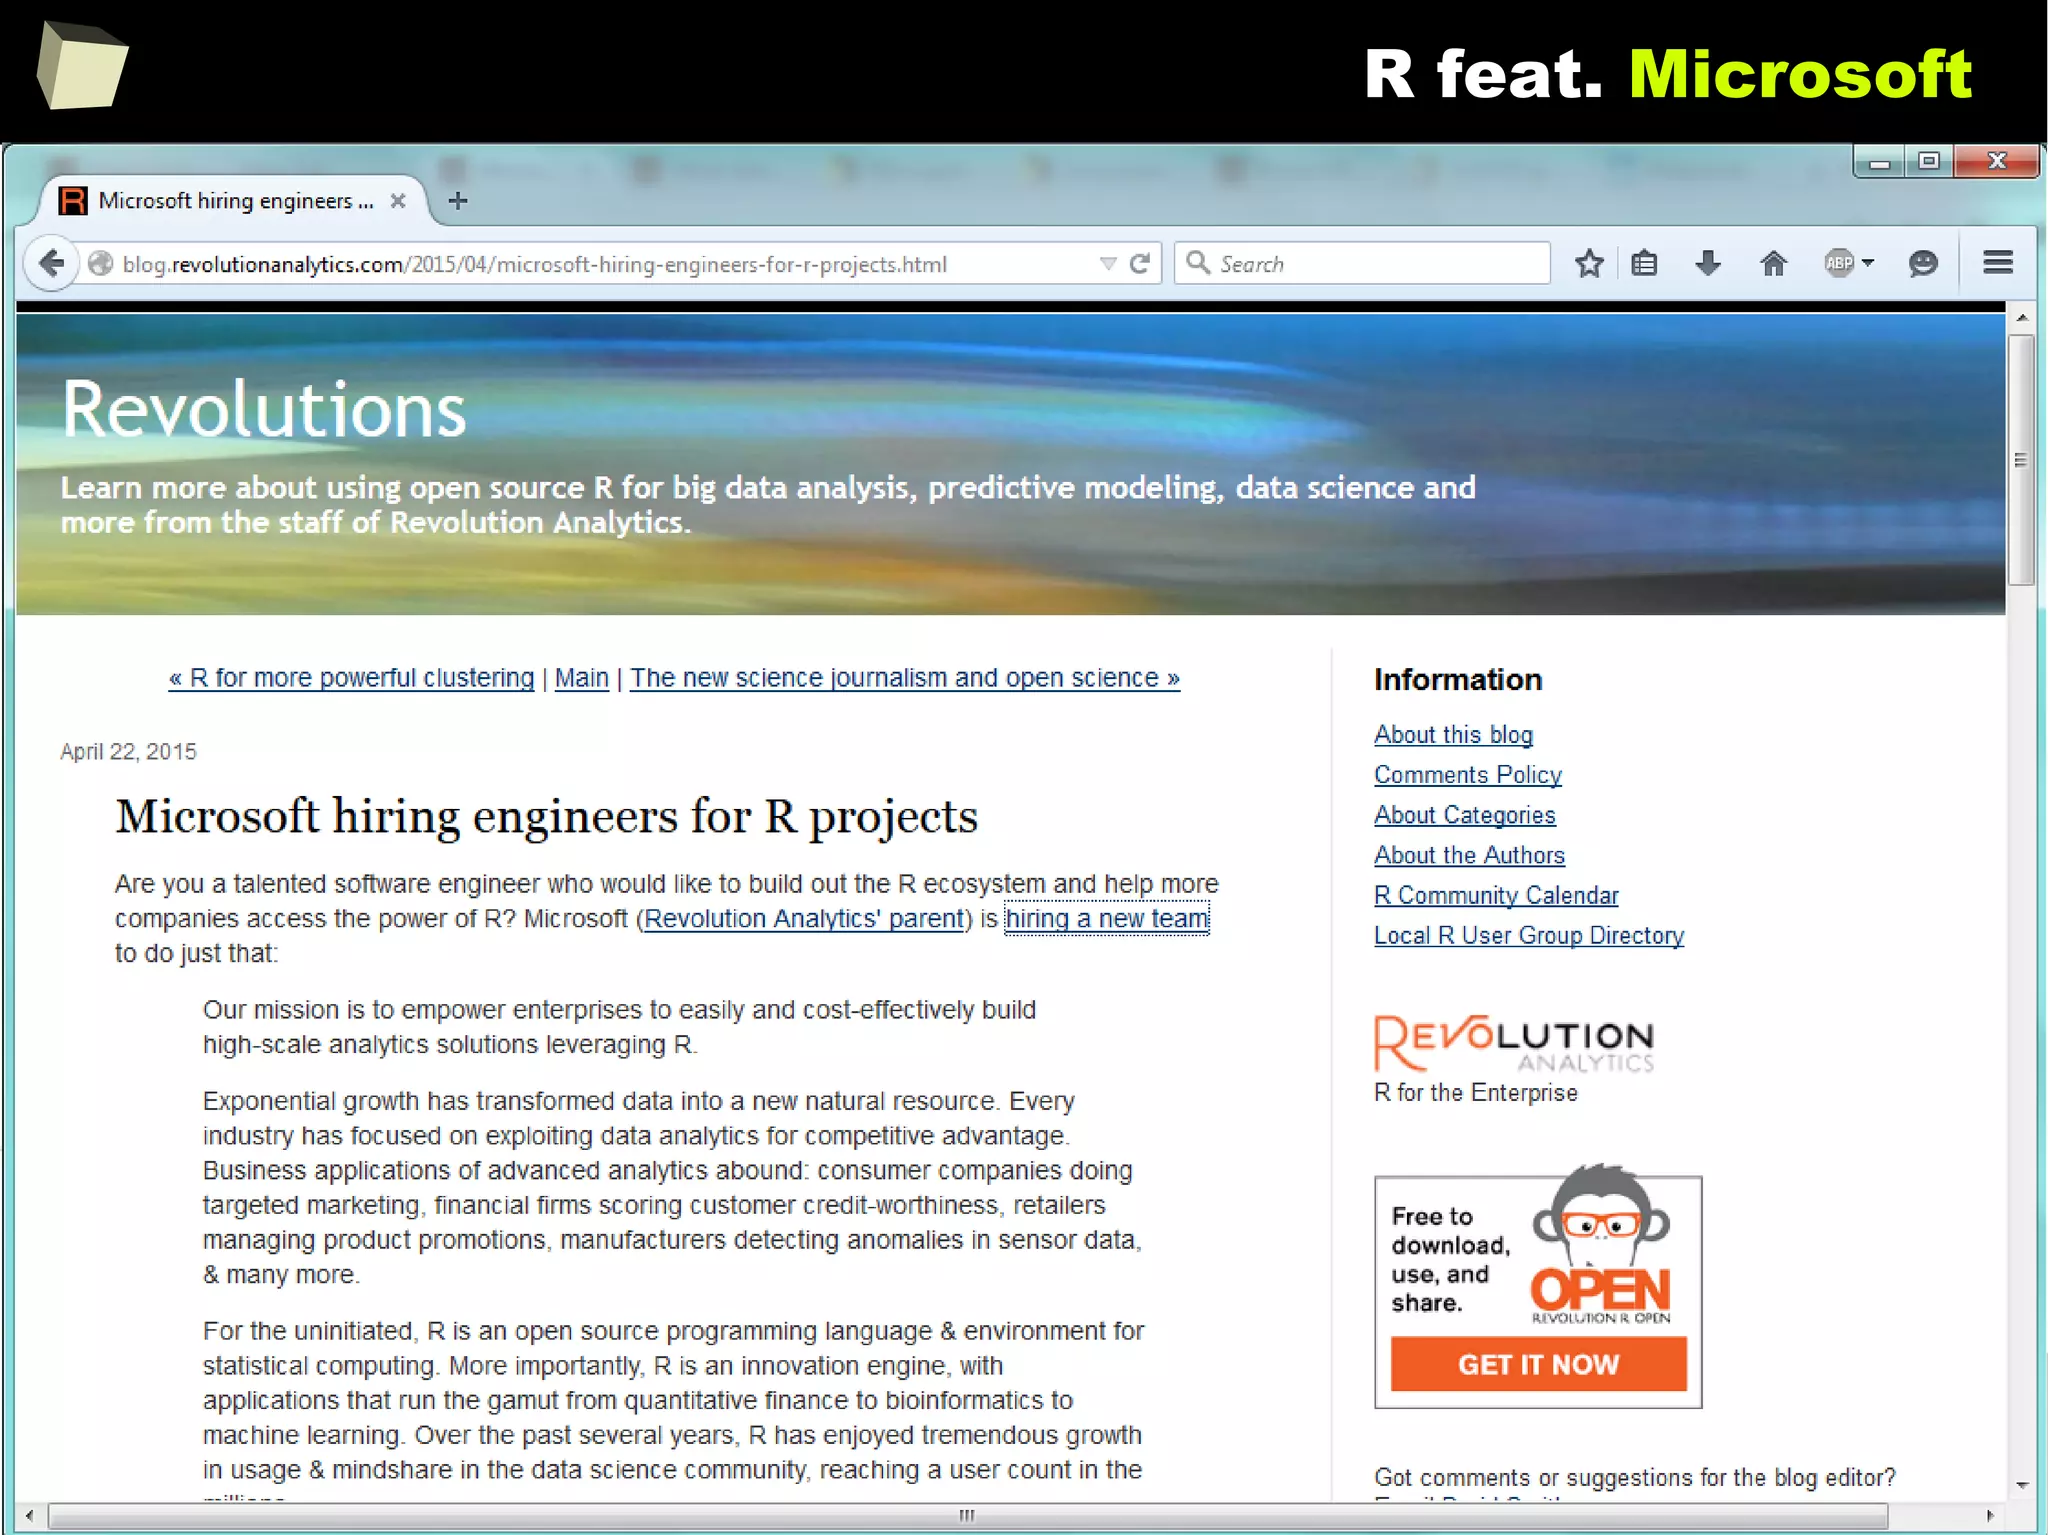
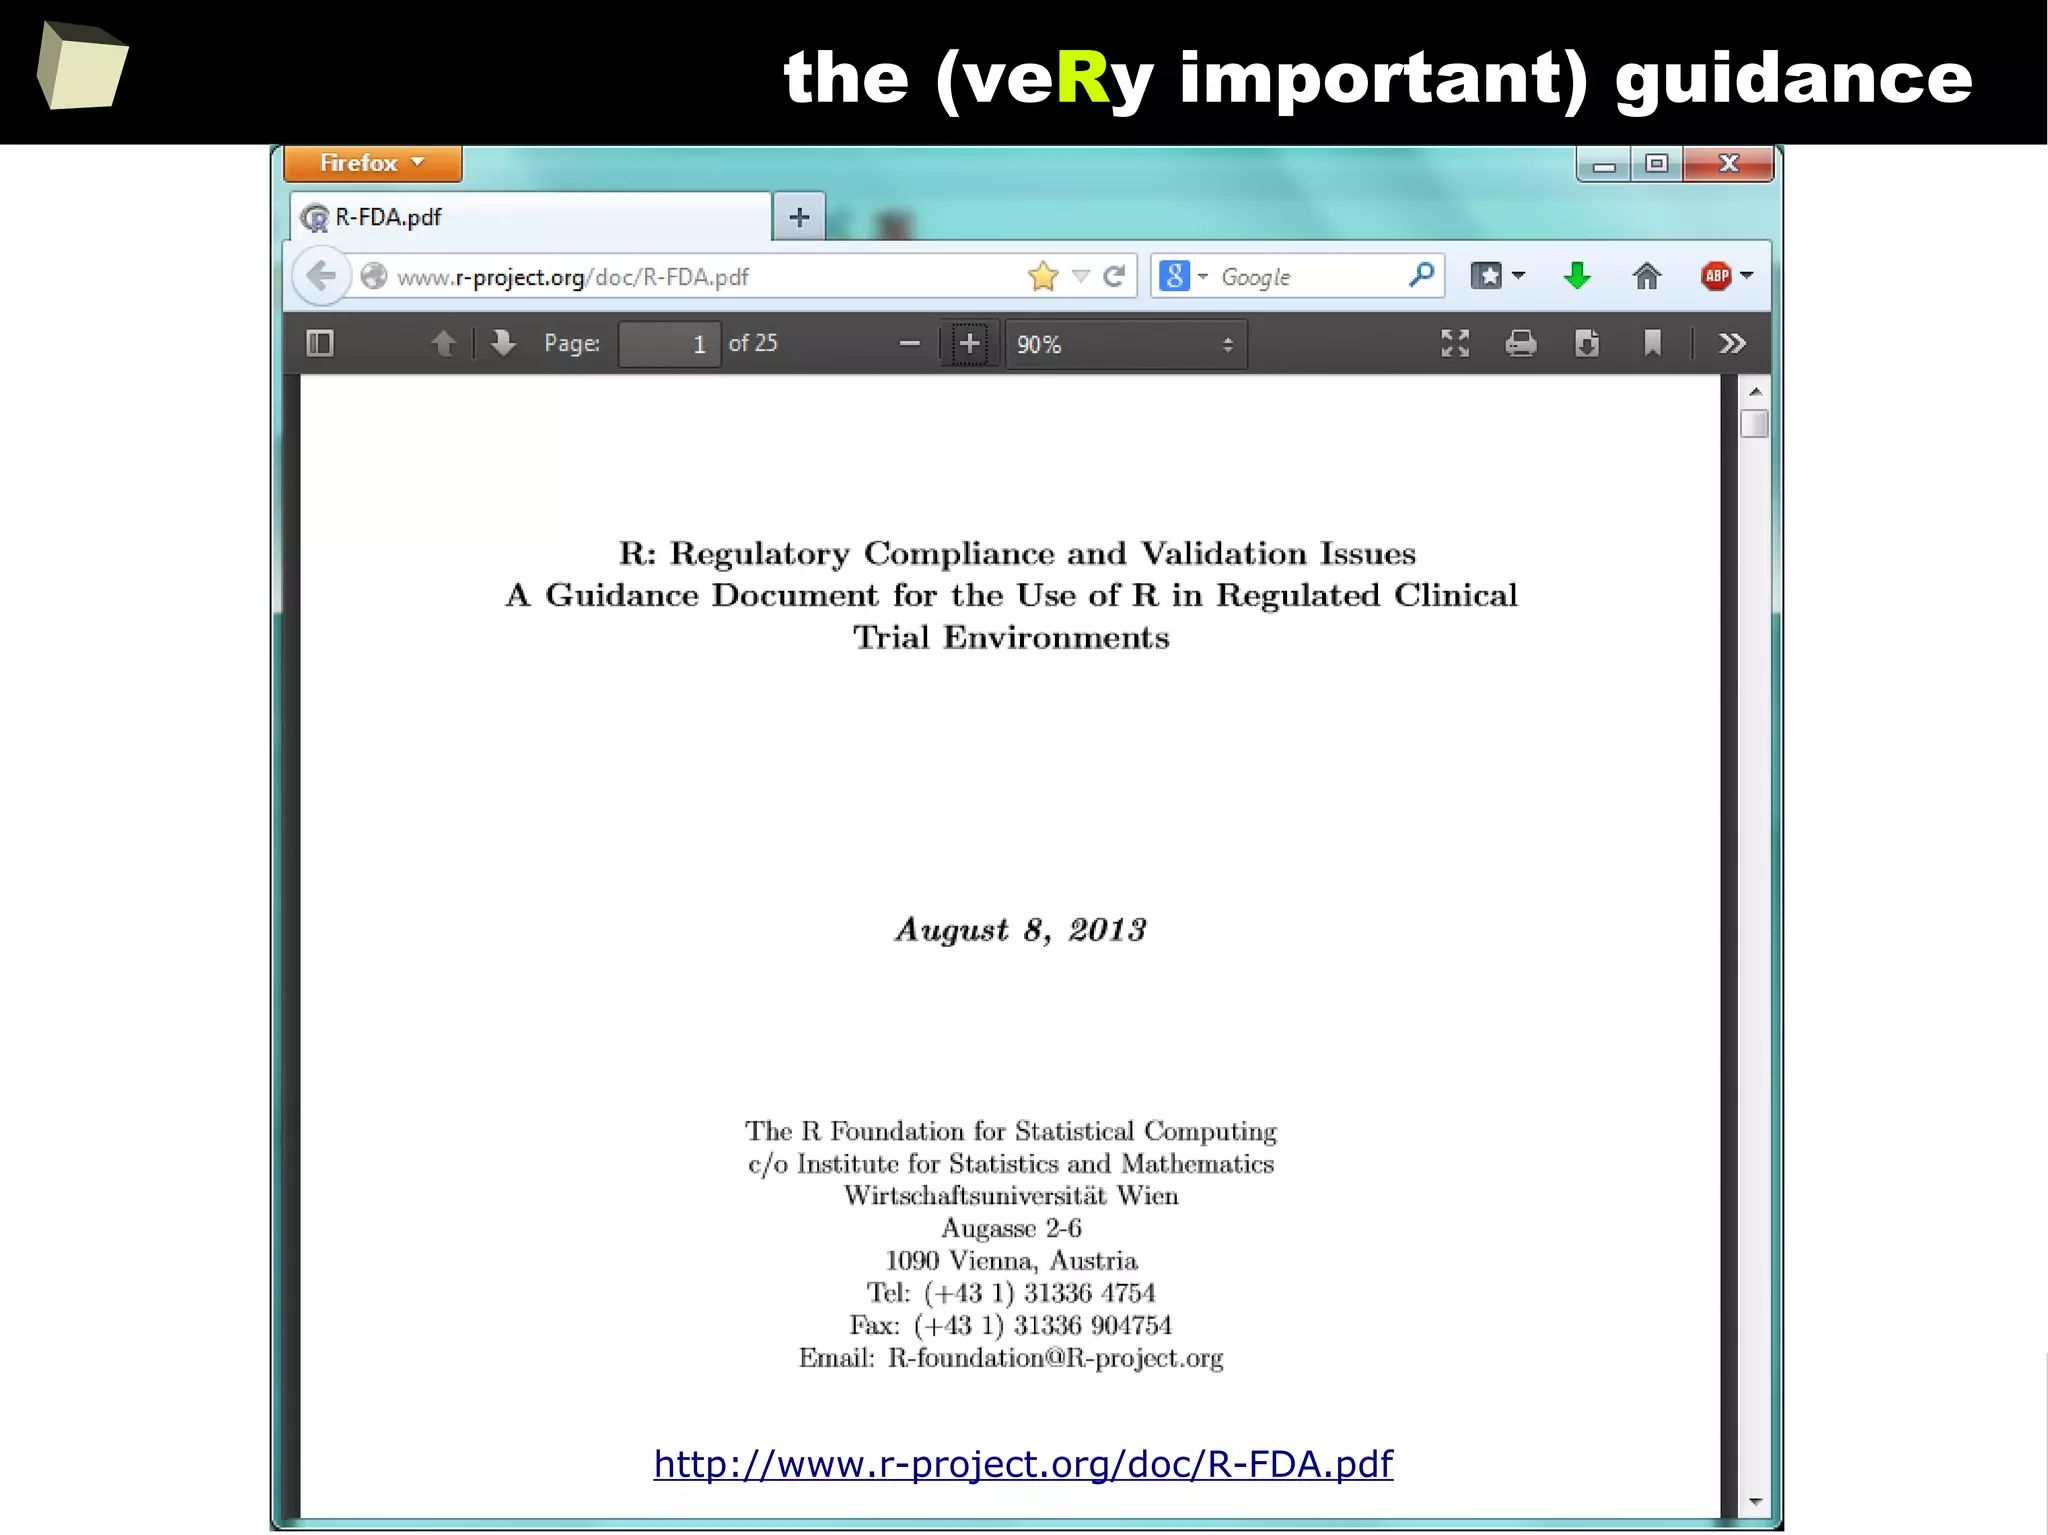
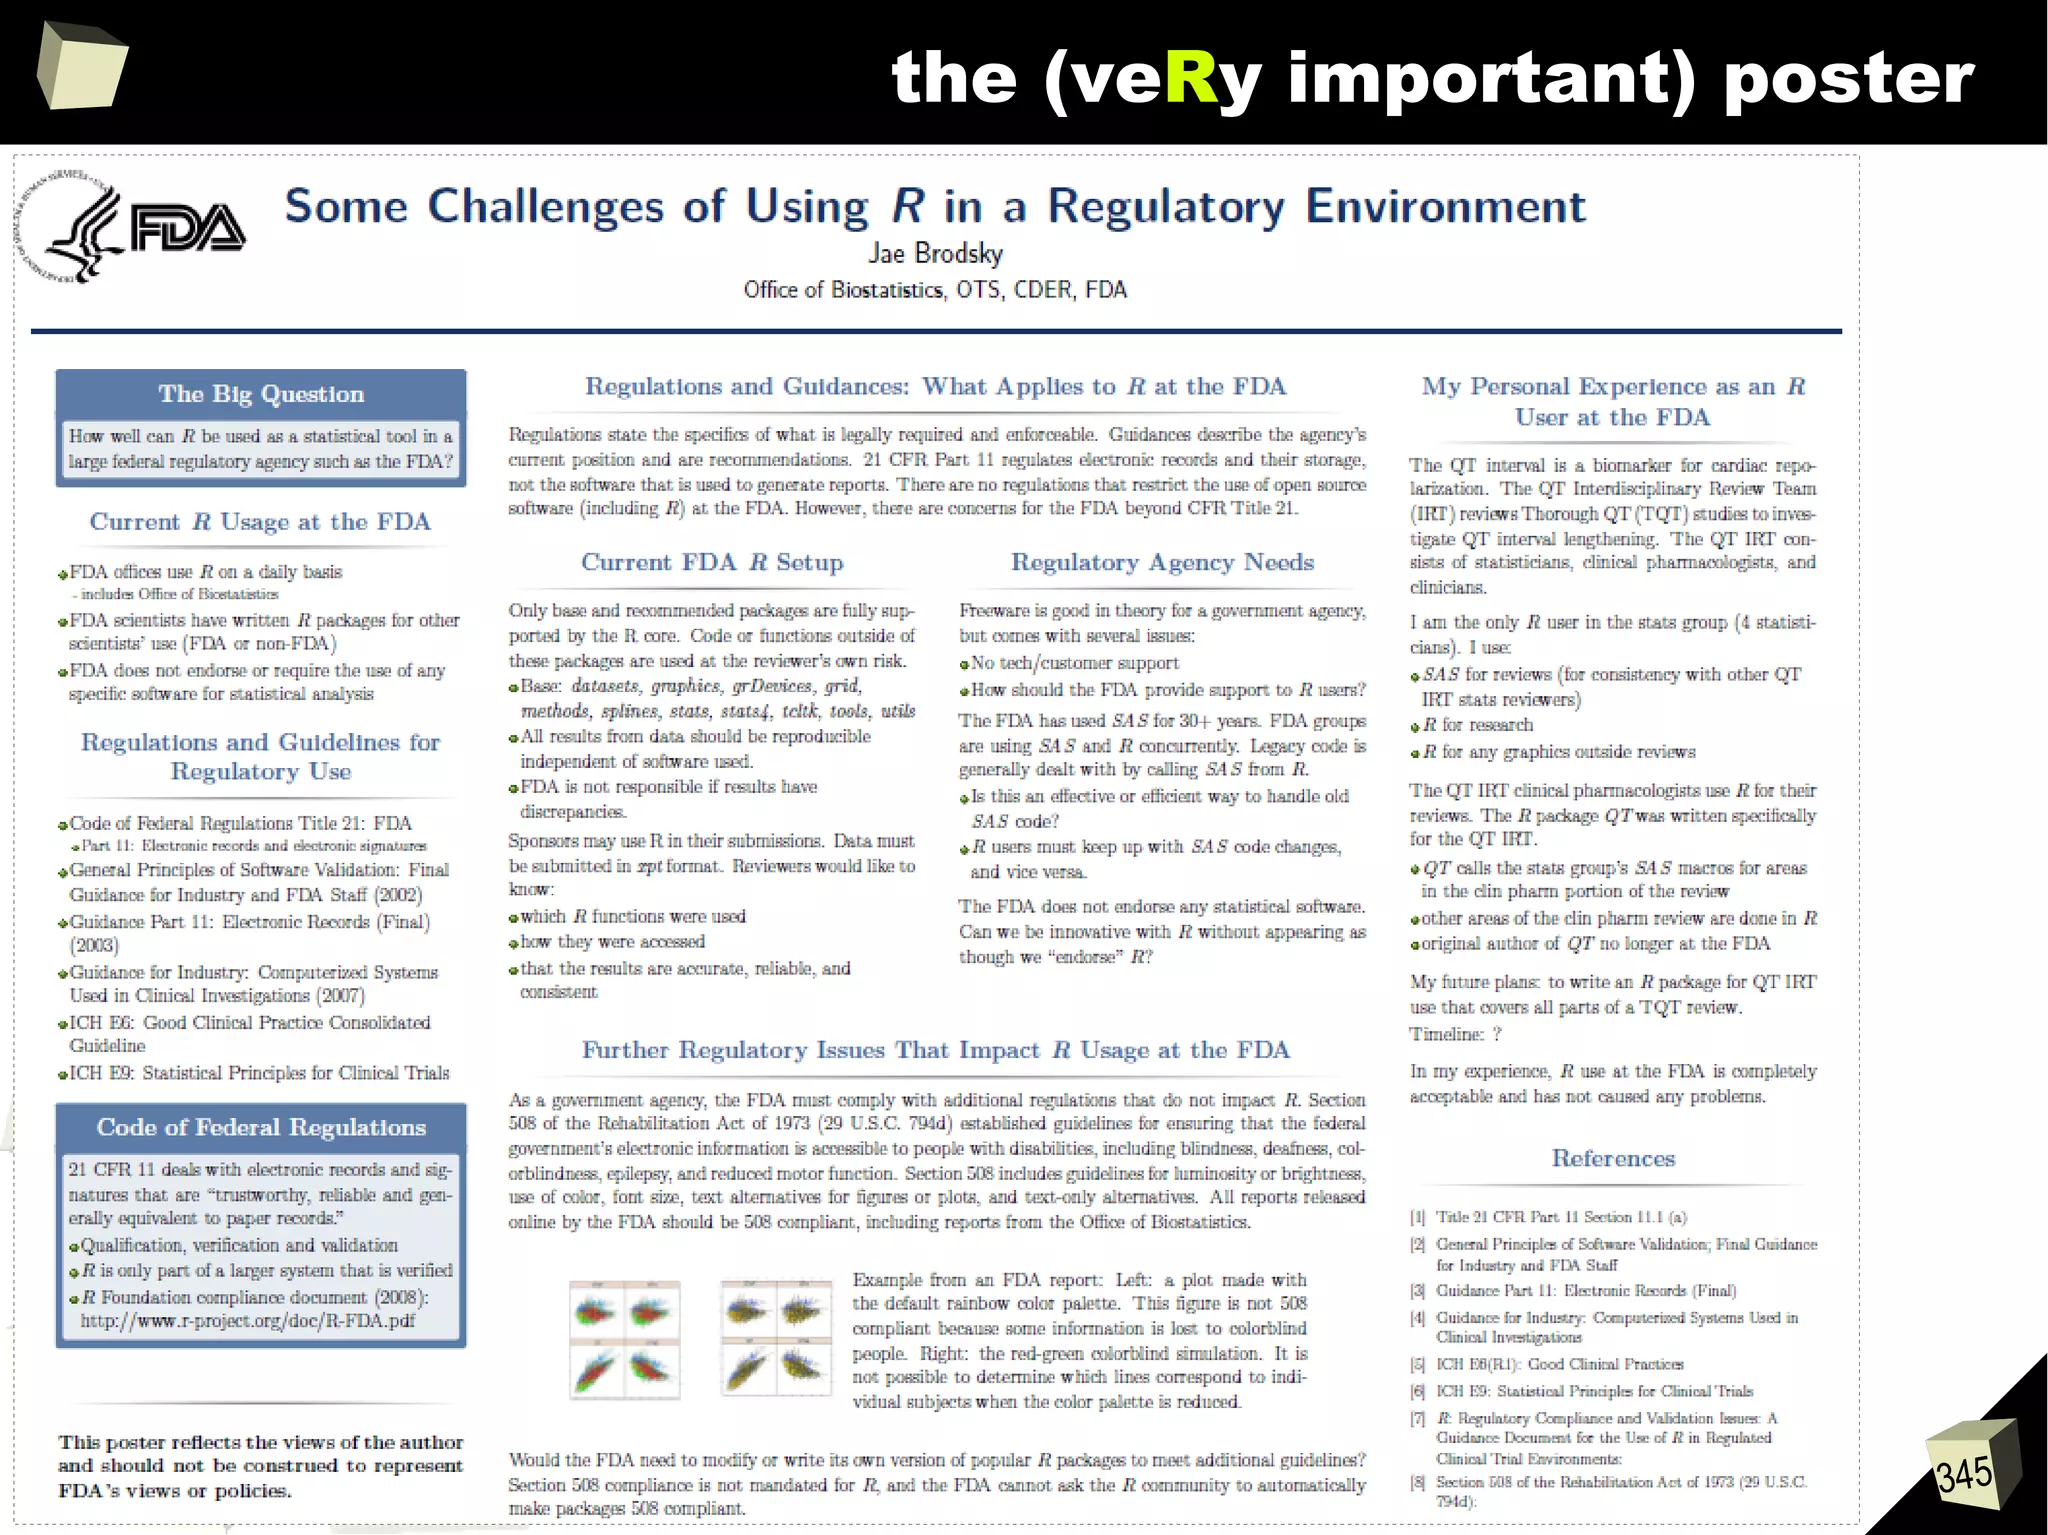
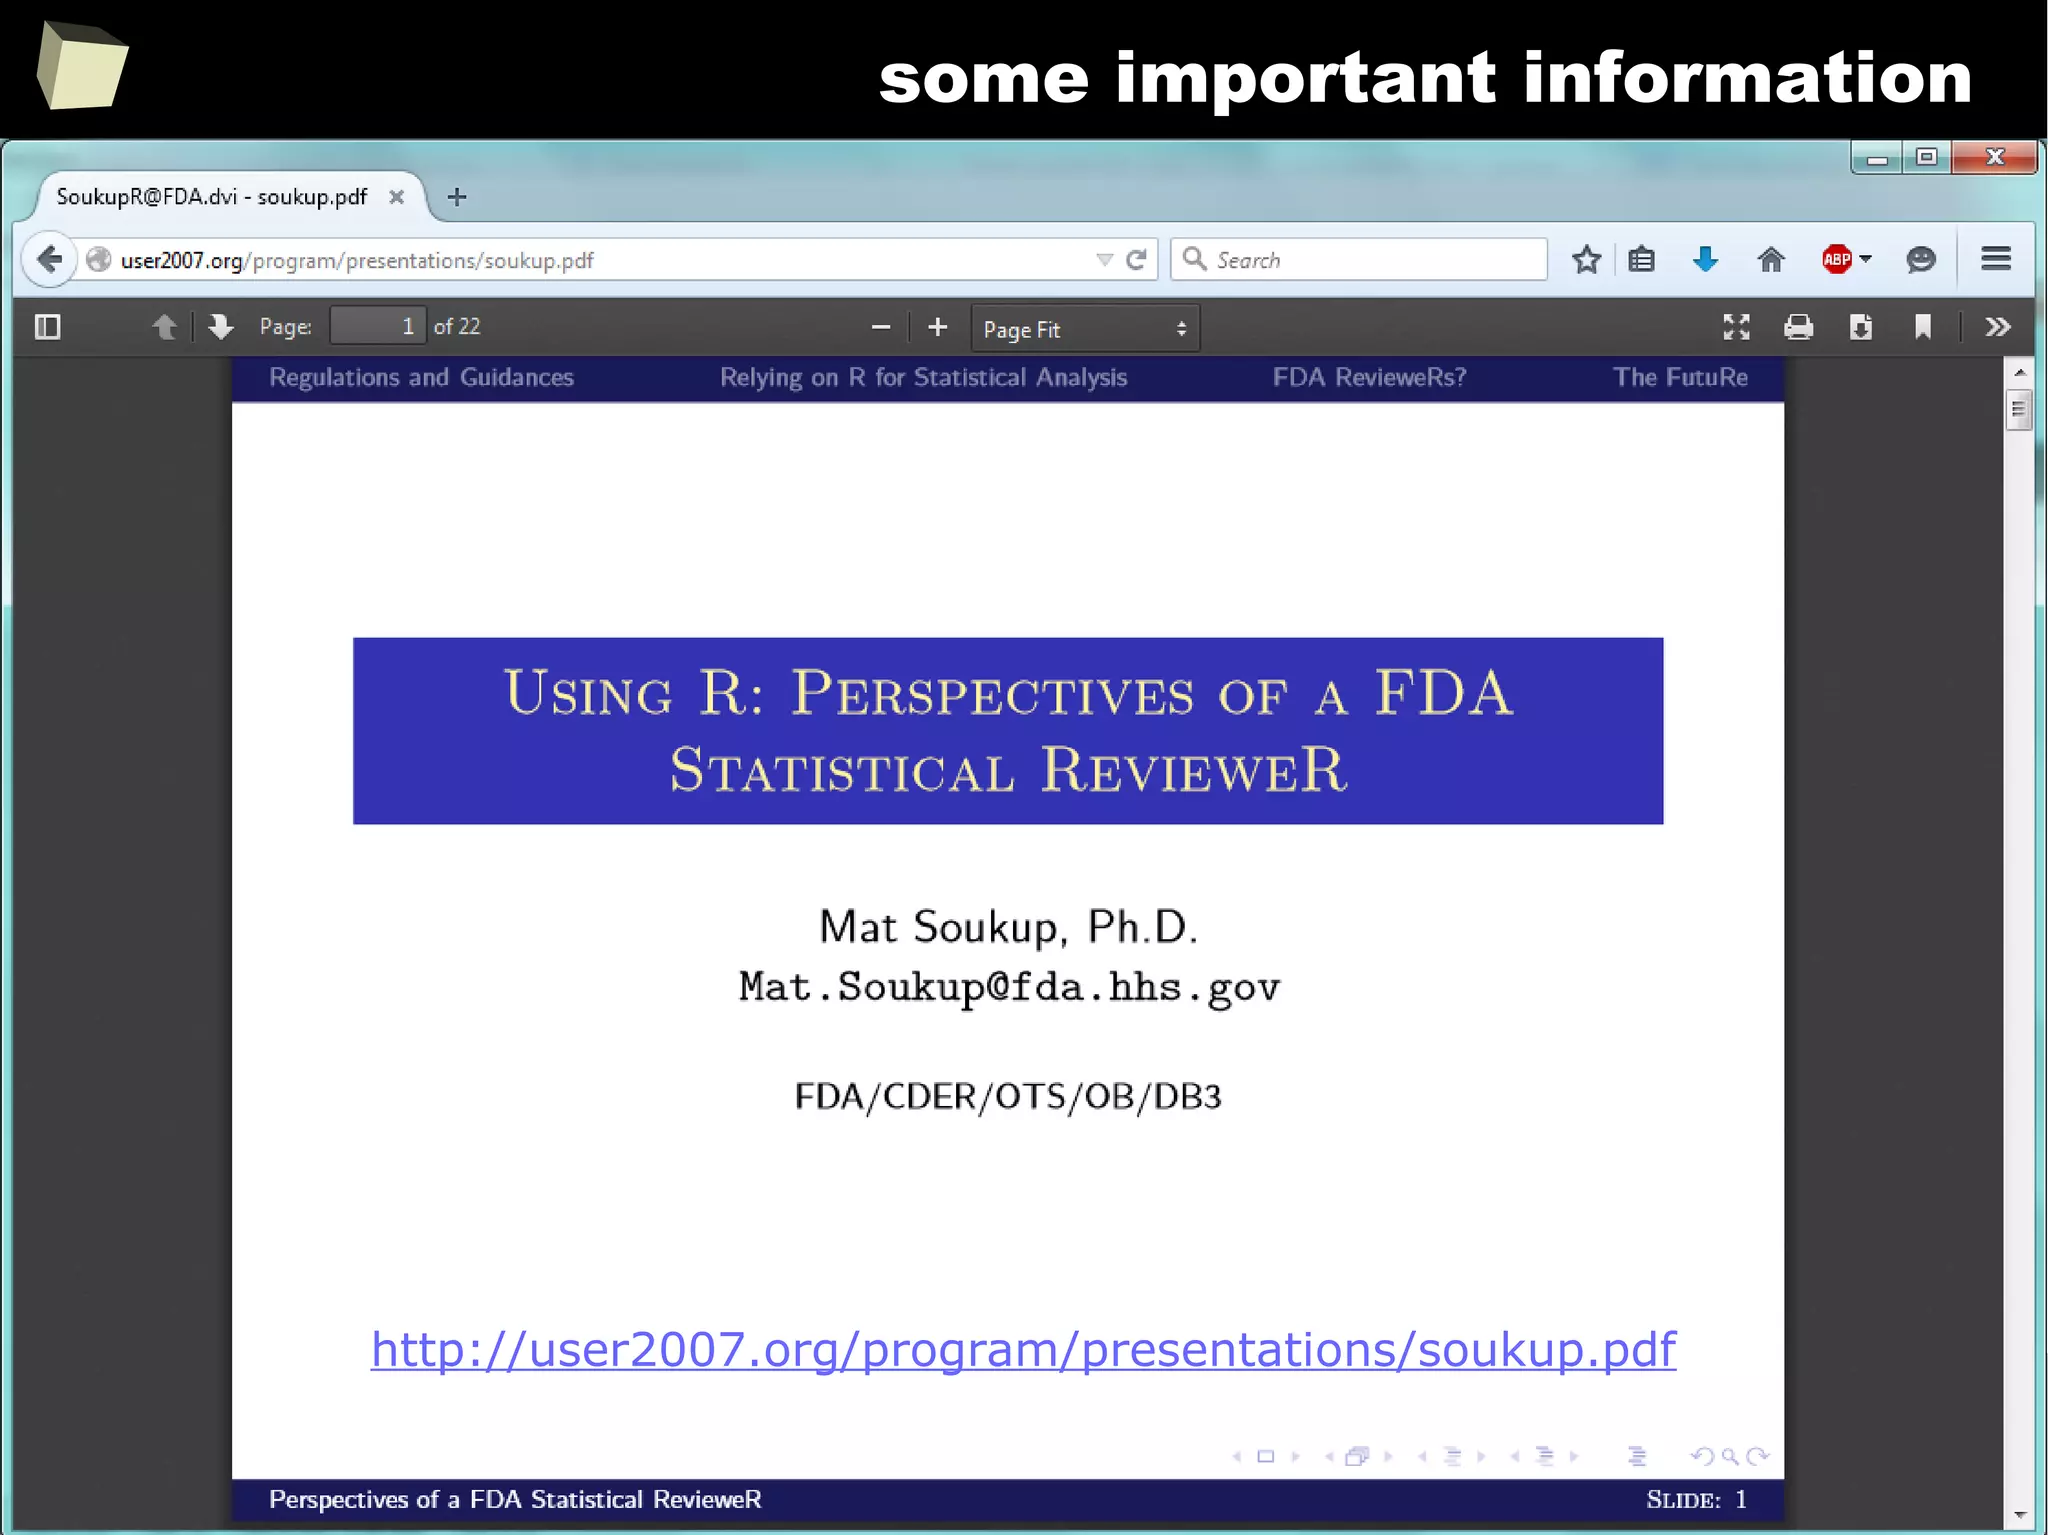
![343
FDA: R is OK for drug trials!
http://tinyurl.com/fda-r-ok
In a poster presented at the UseR 2012 conference, FDA biostatistician Jae
Brodsky reiterated the FDA policy regarding software used to prepare
submissions for drug approvals with clinical trials: Sponsors may use R in their
submissions. […] SAS is not required to be used for clinical trials.
The FDA does not endorse or require any particular software to be used for
clinical trial submissions, and there are no regulations that restrict the use
of open source software (including R) at the FDA.
Nonetheless, any software (R included) used to prepare data analysis from
clinical trials must comply with the various FDA regulations and guidances
(e.g. 21 CFR Part 11). Even MS Excel can be made “21 CFR 11 Compliant”.
The R Foundation helpfully provides a guidance document for the use of R in
regulated clinical trial environments, which provides details of the specific FDA
regulations and how R complies with them.](https://image.slidesharecdn.com/is-r-suitable-enough-for-clinical-research-160113193220/75/GNU-R-in-Clinical-Research-and-Evidence-Based-Medicine-343-2048.jpg)

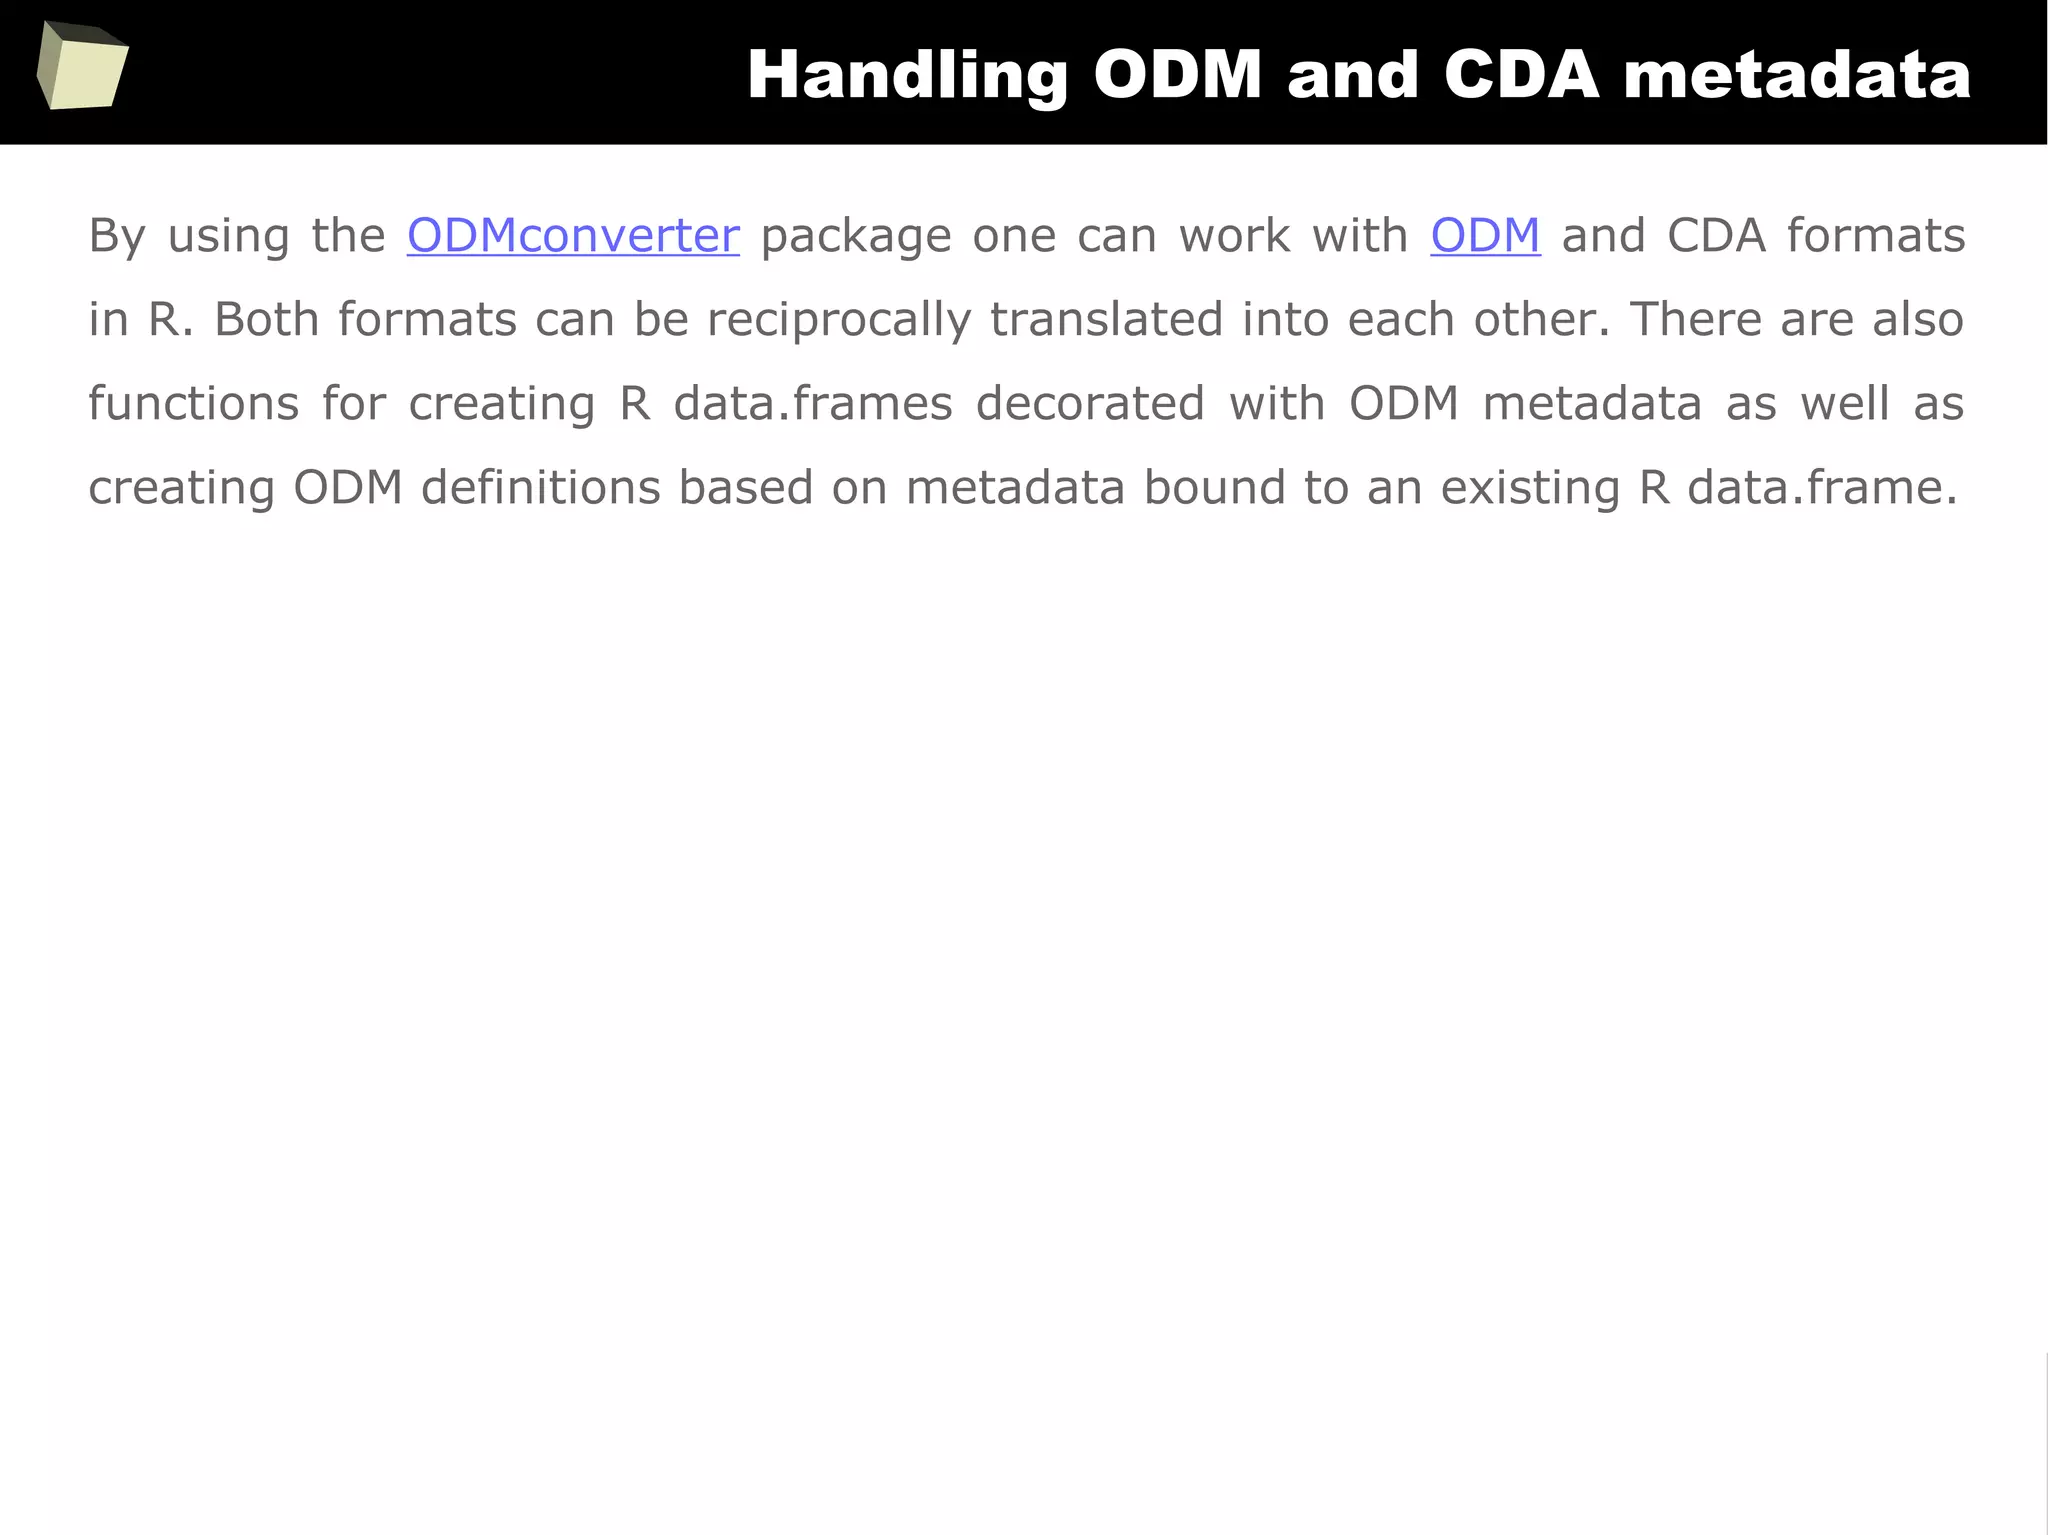
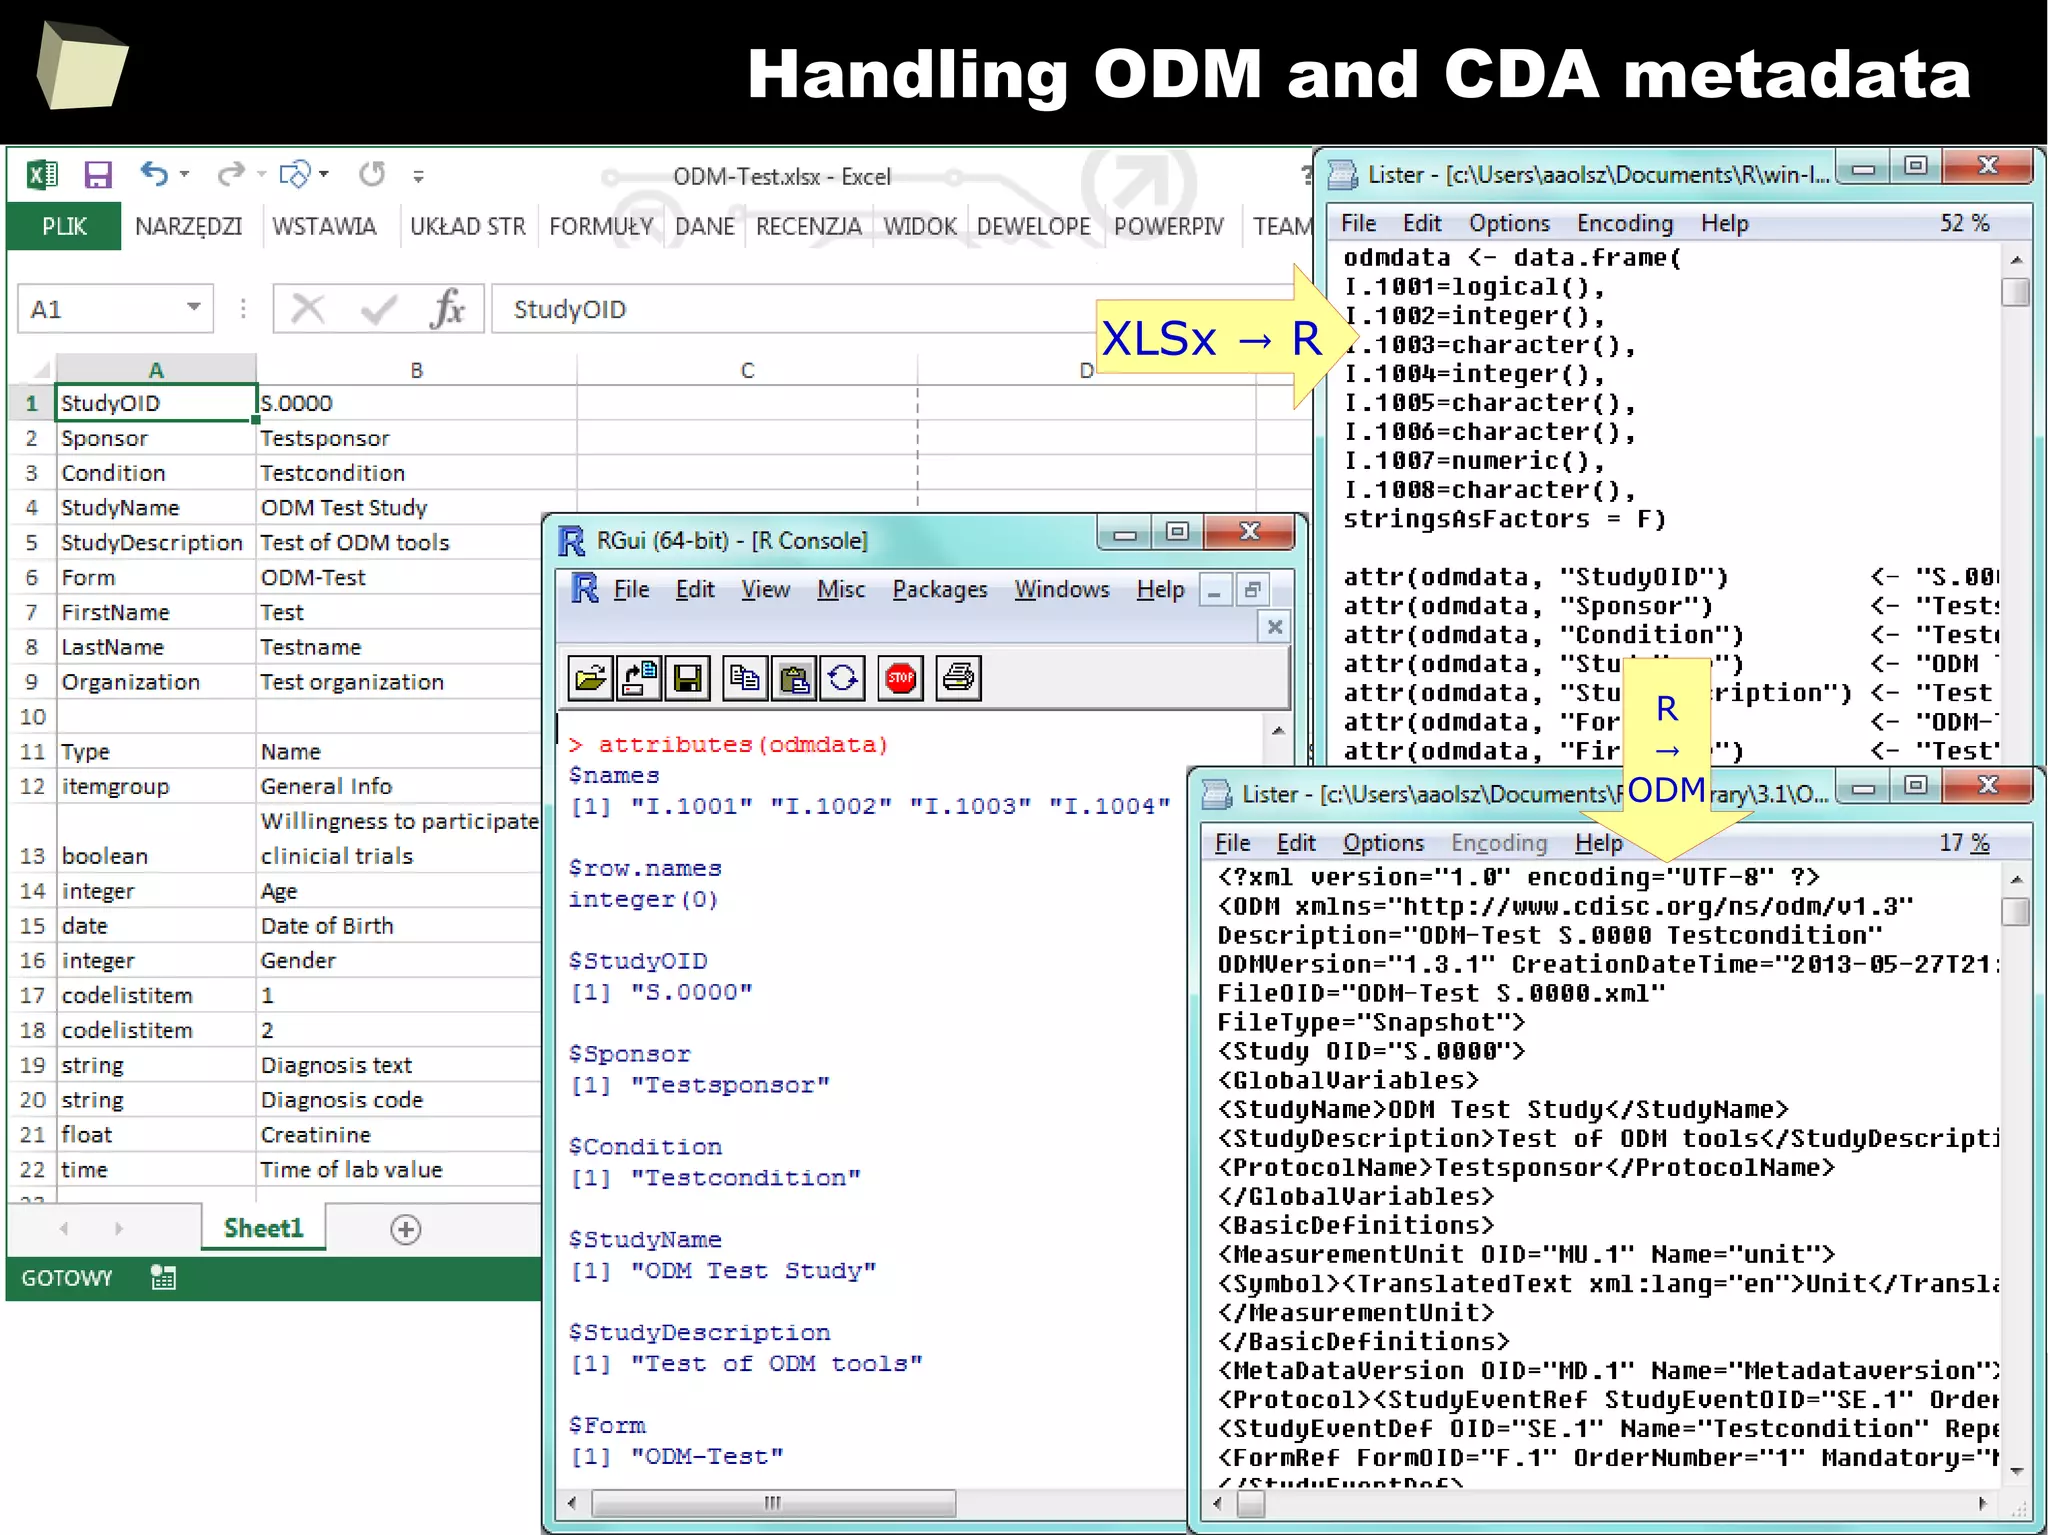
![350
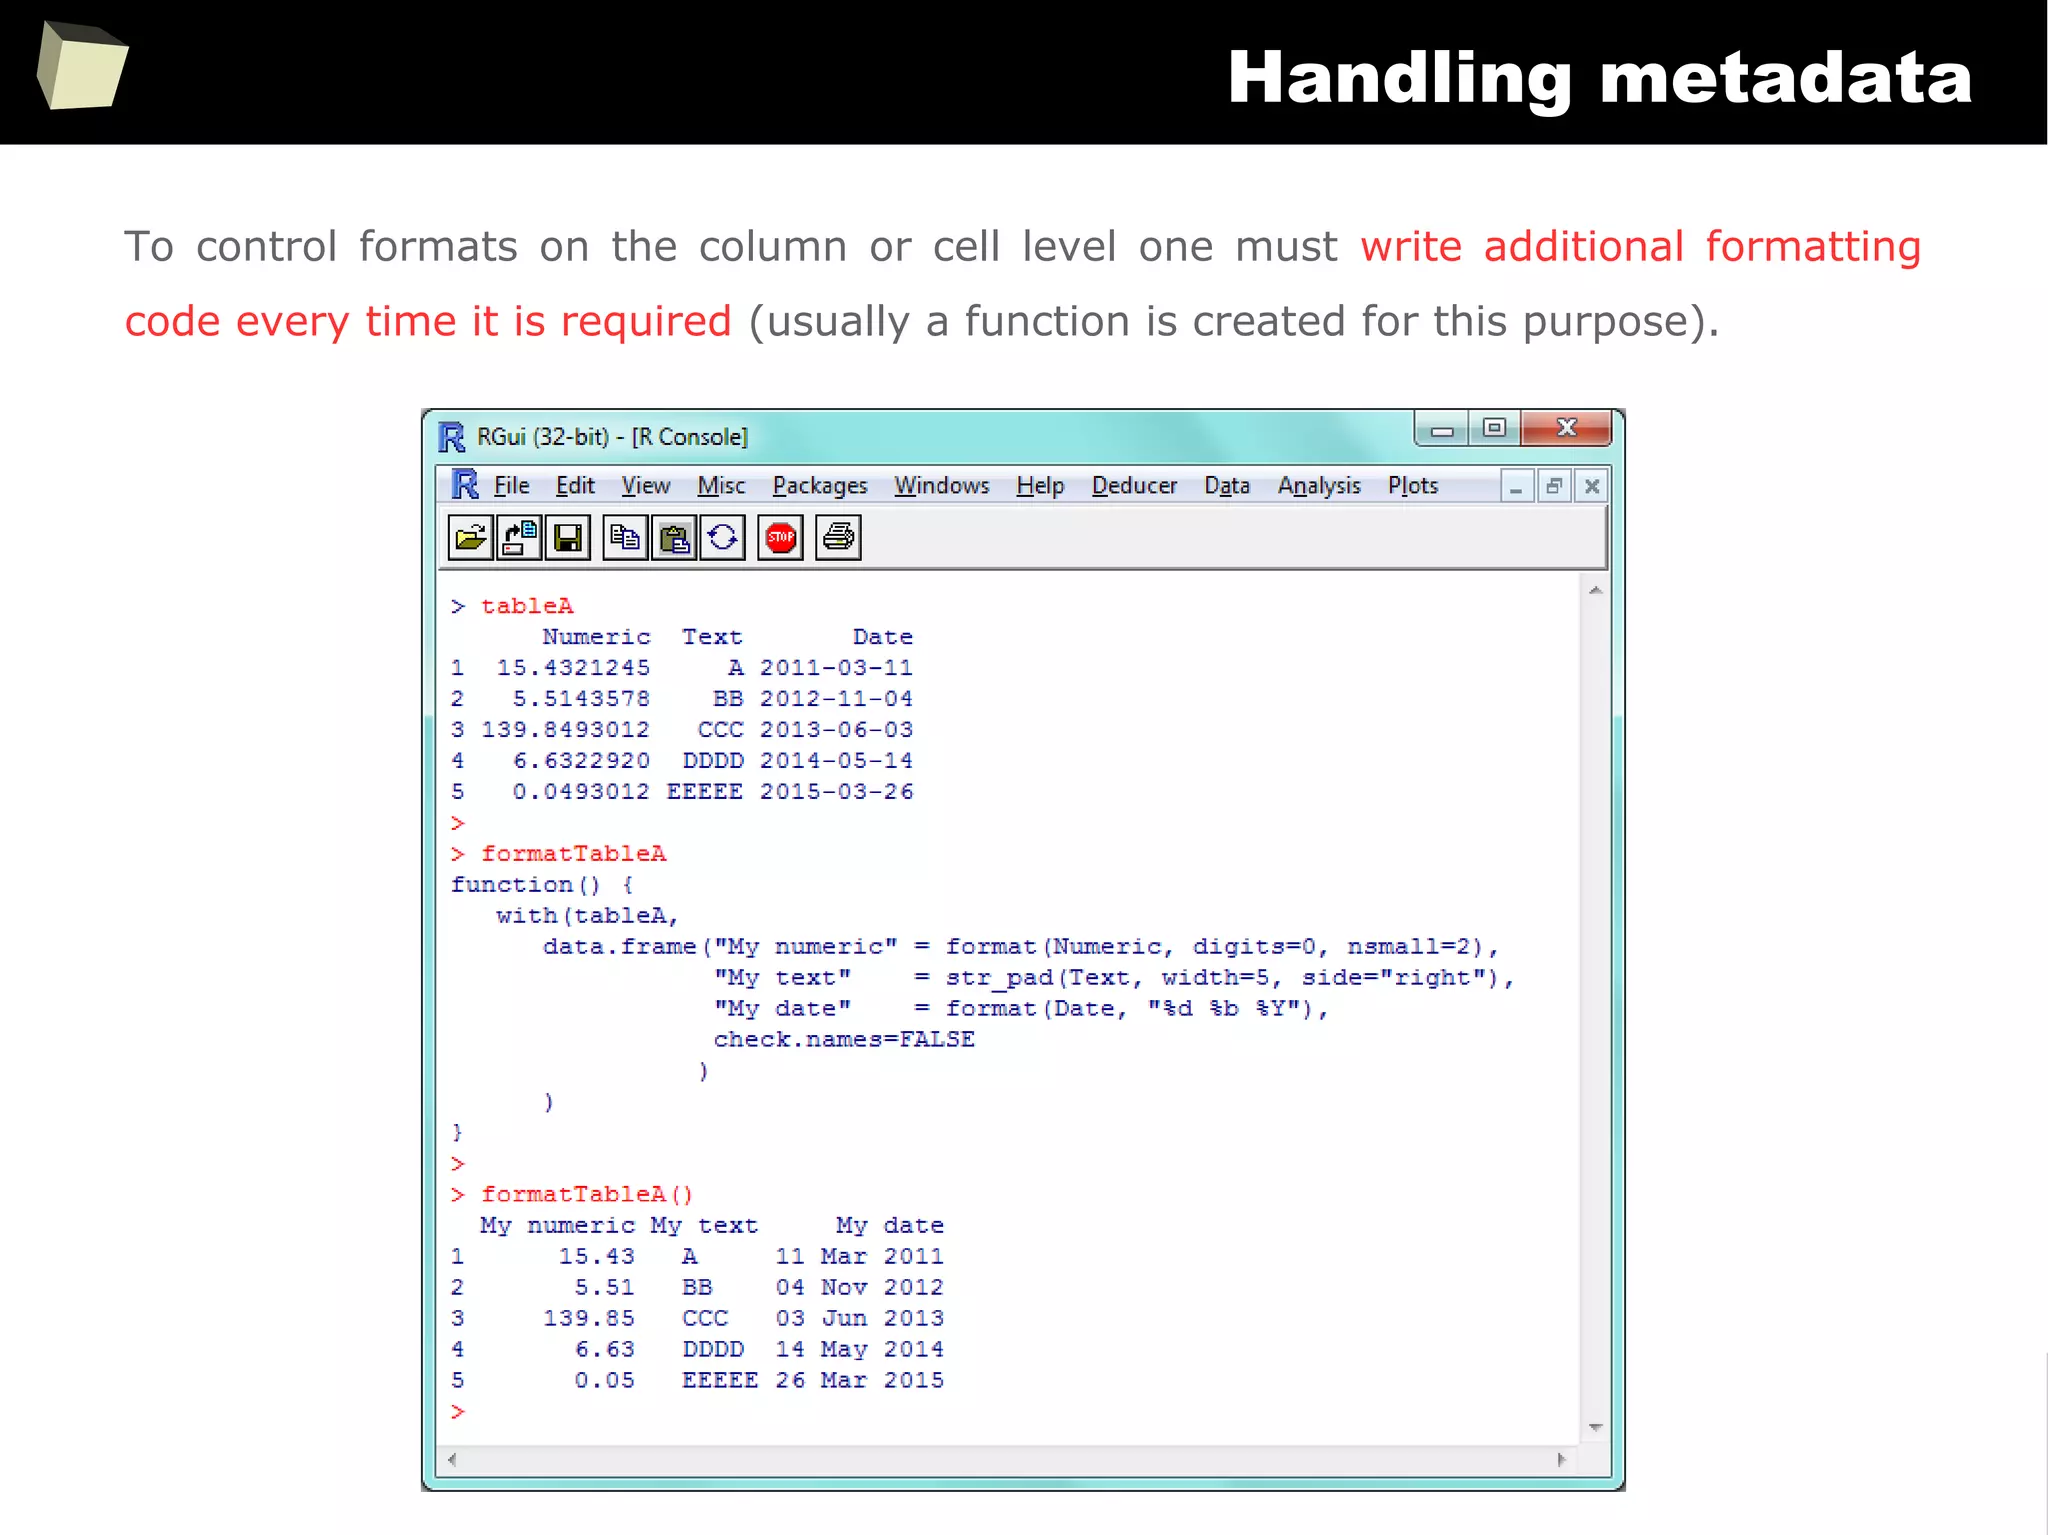
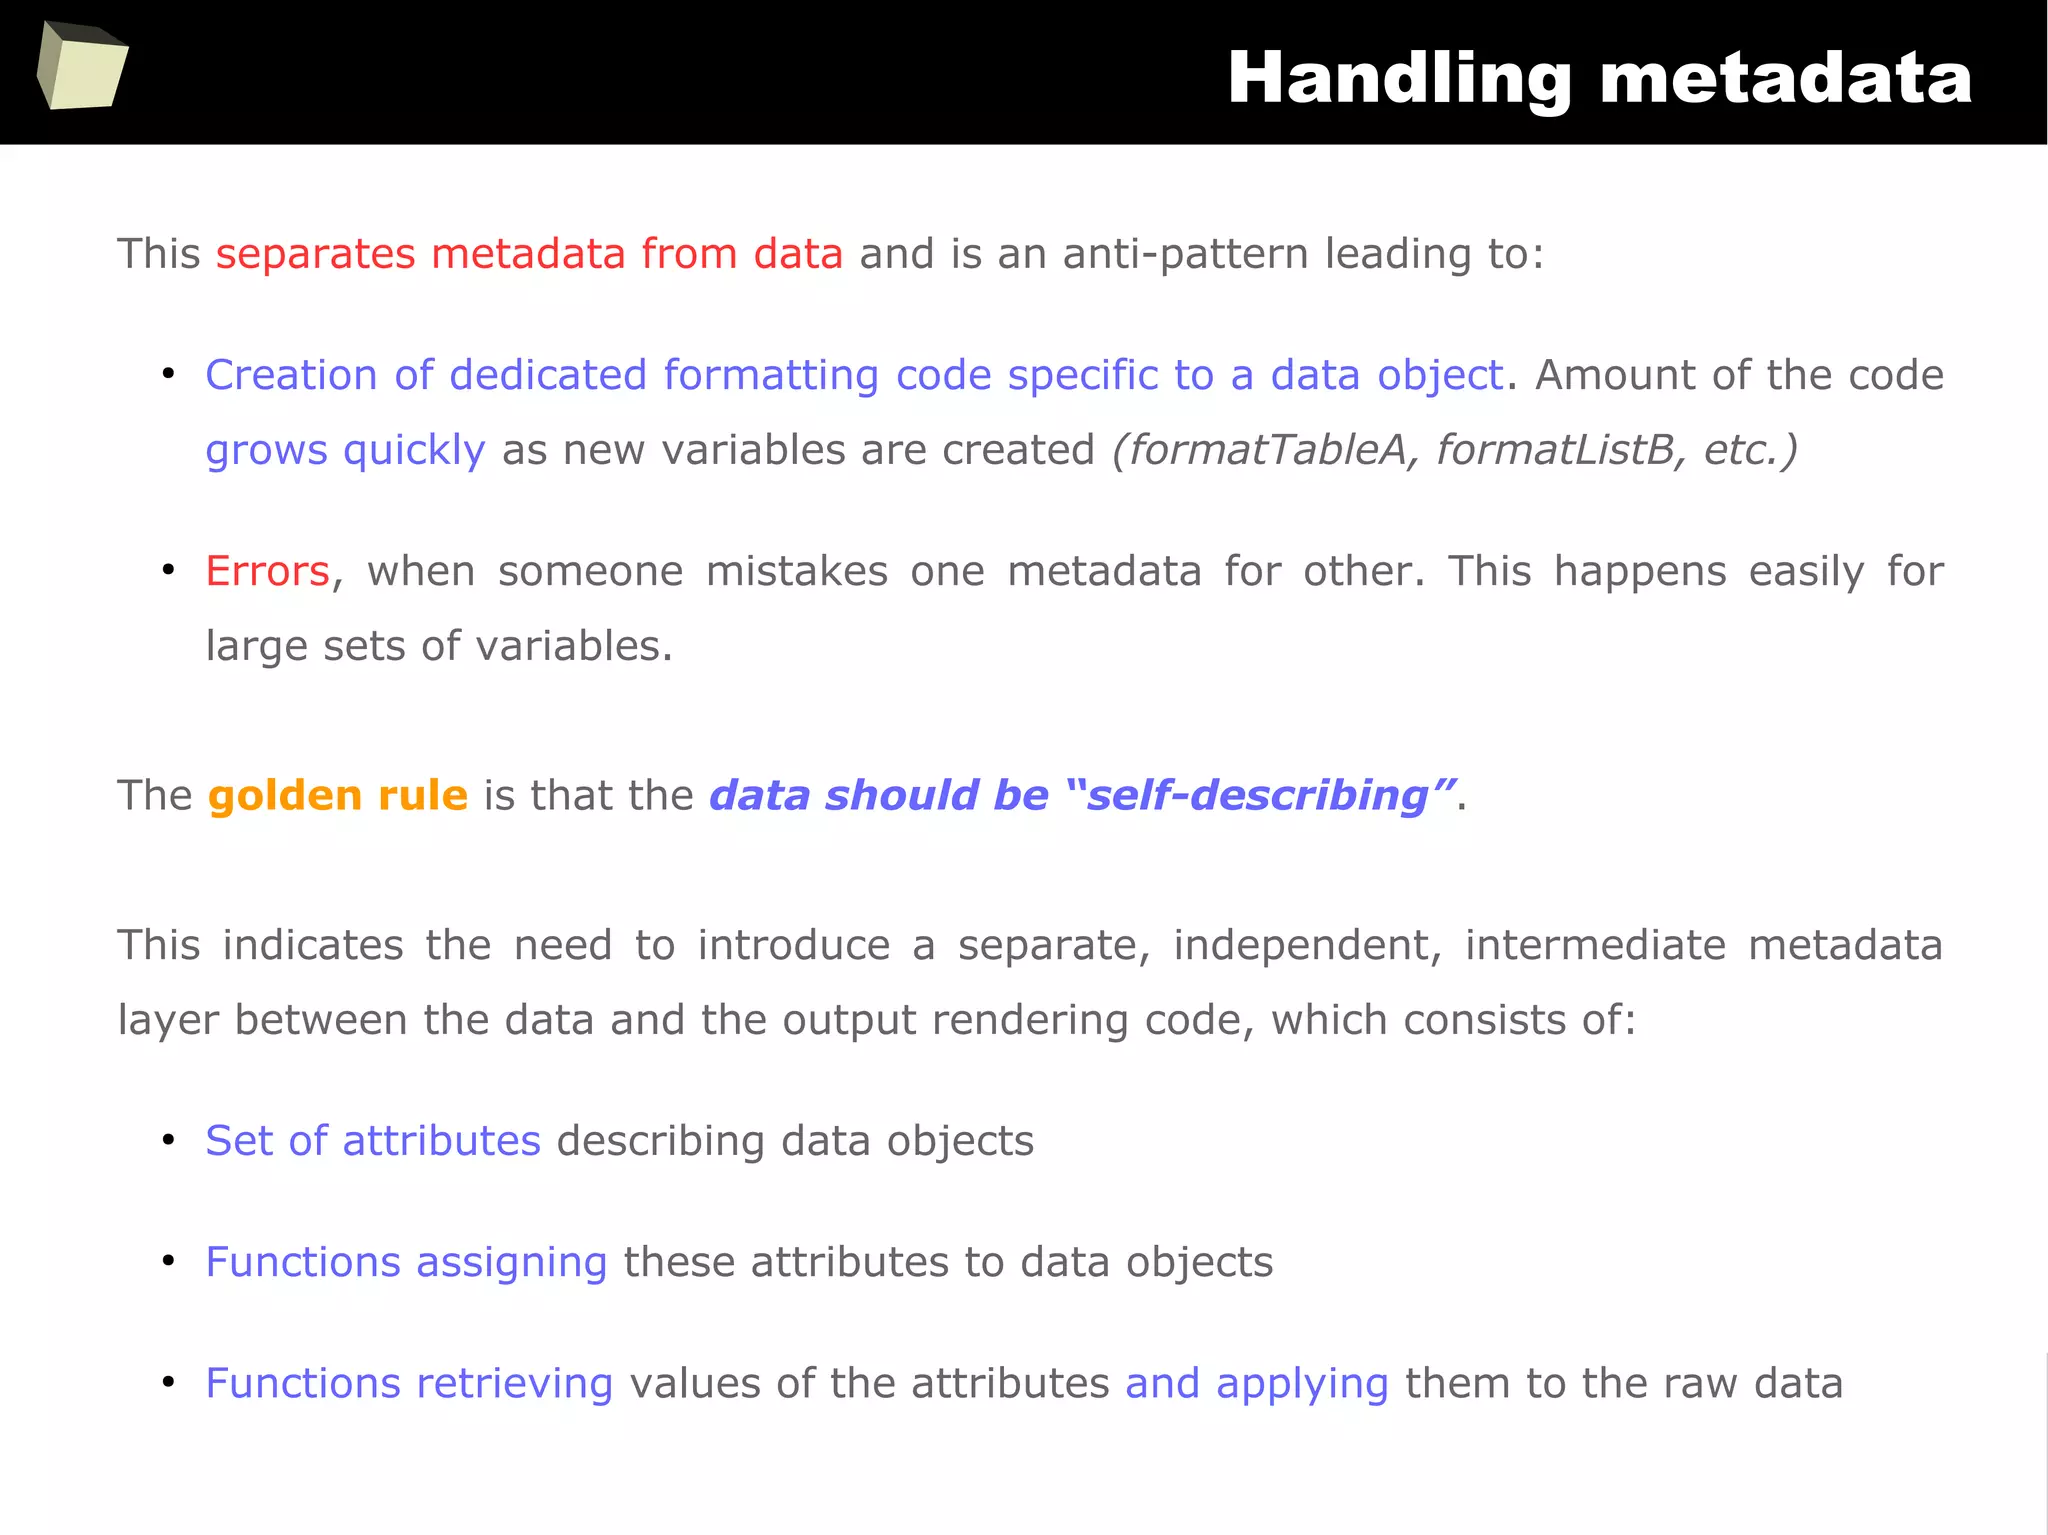
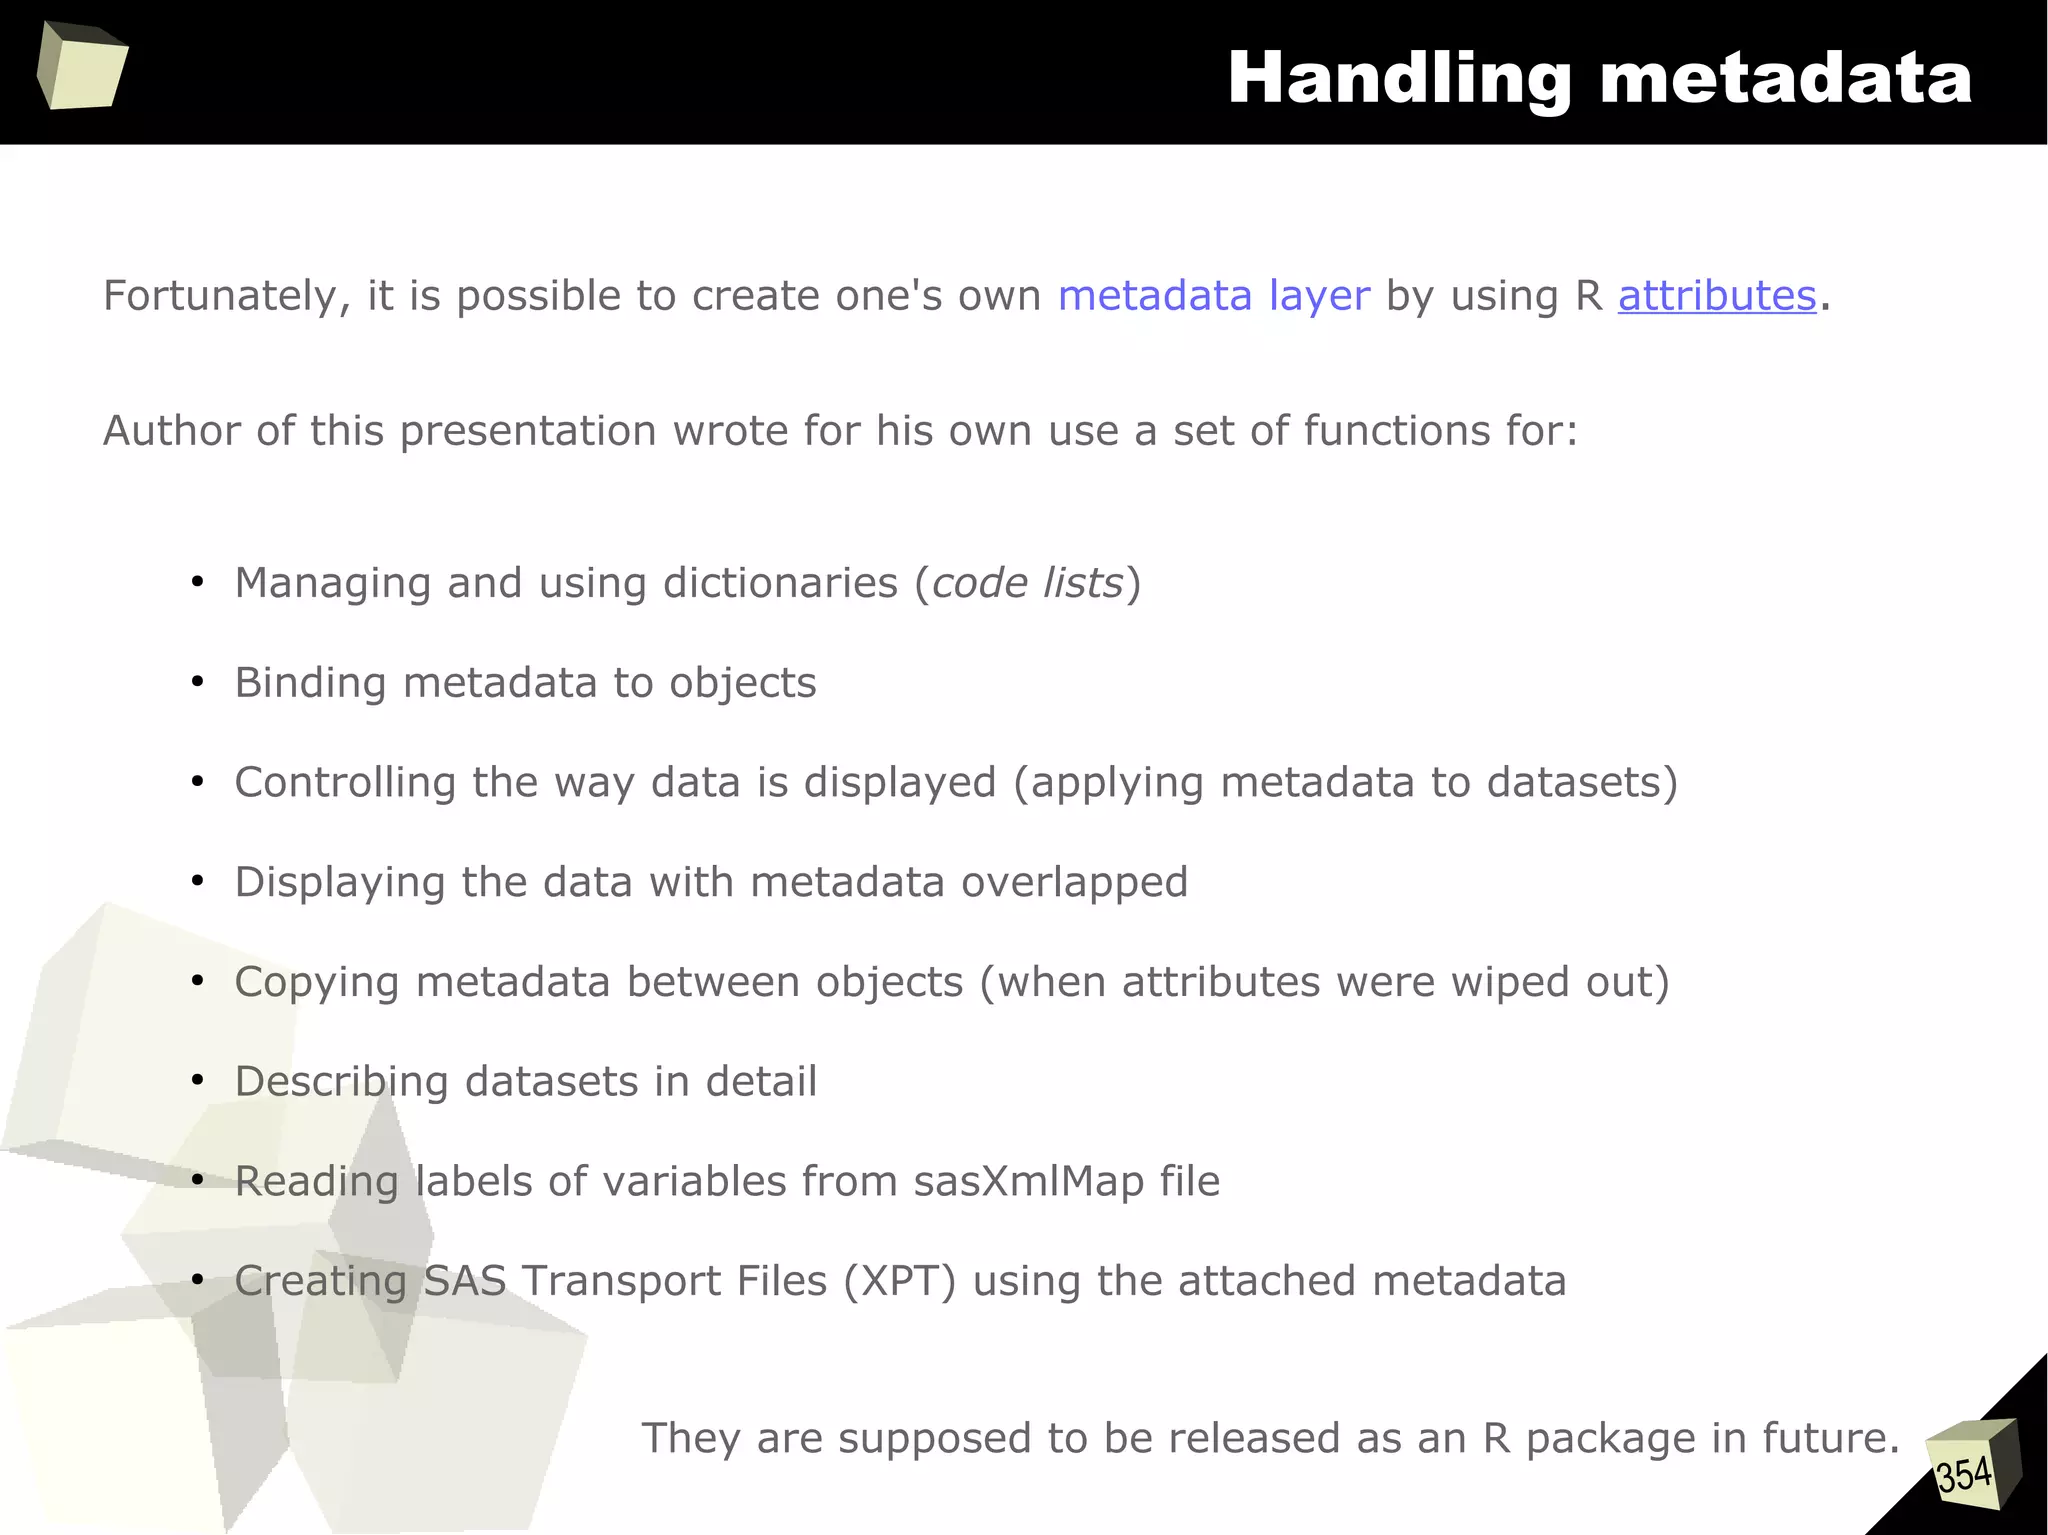
Handling metadata
SAS uses metadata extensively to control how data is displayed. There are dozens of
formats and “informats” specific to literals, numbers, currencies, dates and times.
On the contrary, R doesn't use “formats”. There is no something like “numeric(10,2)”
or “char(20)”. Without additional efforts data is displayed “as is”.
There are only some options to control globally the number of decimal digits,
formatting dates or setting timezone.
> options("digits")$digit
[1] 7
> (x <- 12.3456789)
[1] 12.34568
> options(digits = 4)
> x
[1] 12.35
> x == 12.3456789
[1] TRUE](https://image.slidesharecdn.com/is-r-suitable-enough-for-clinical-research-160113193220/75/GNU-R-in-Clinical-Research-and-Evidence-Based-Medicine-350-2048.jpg)

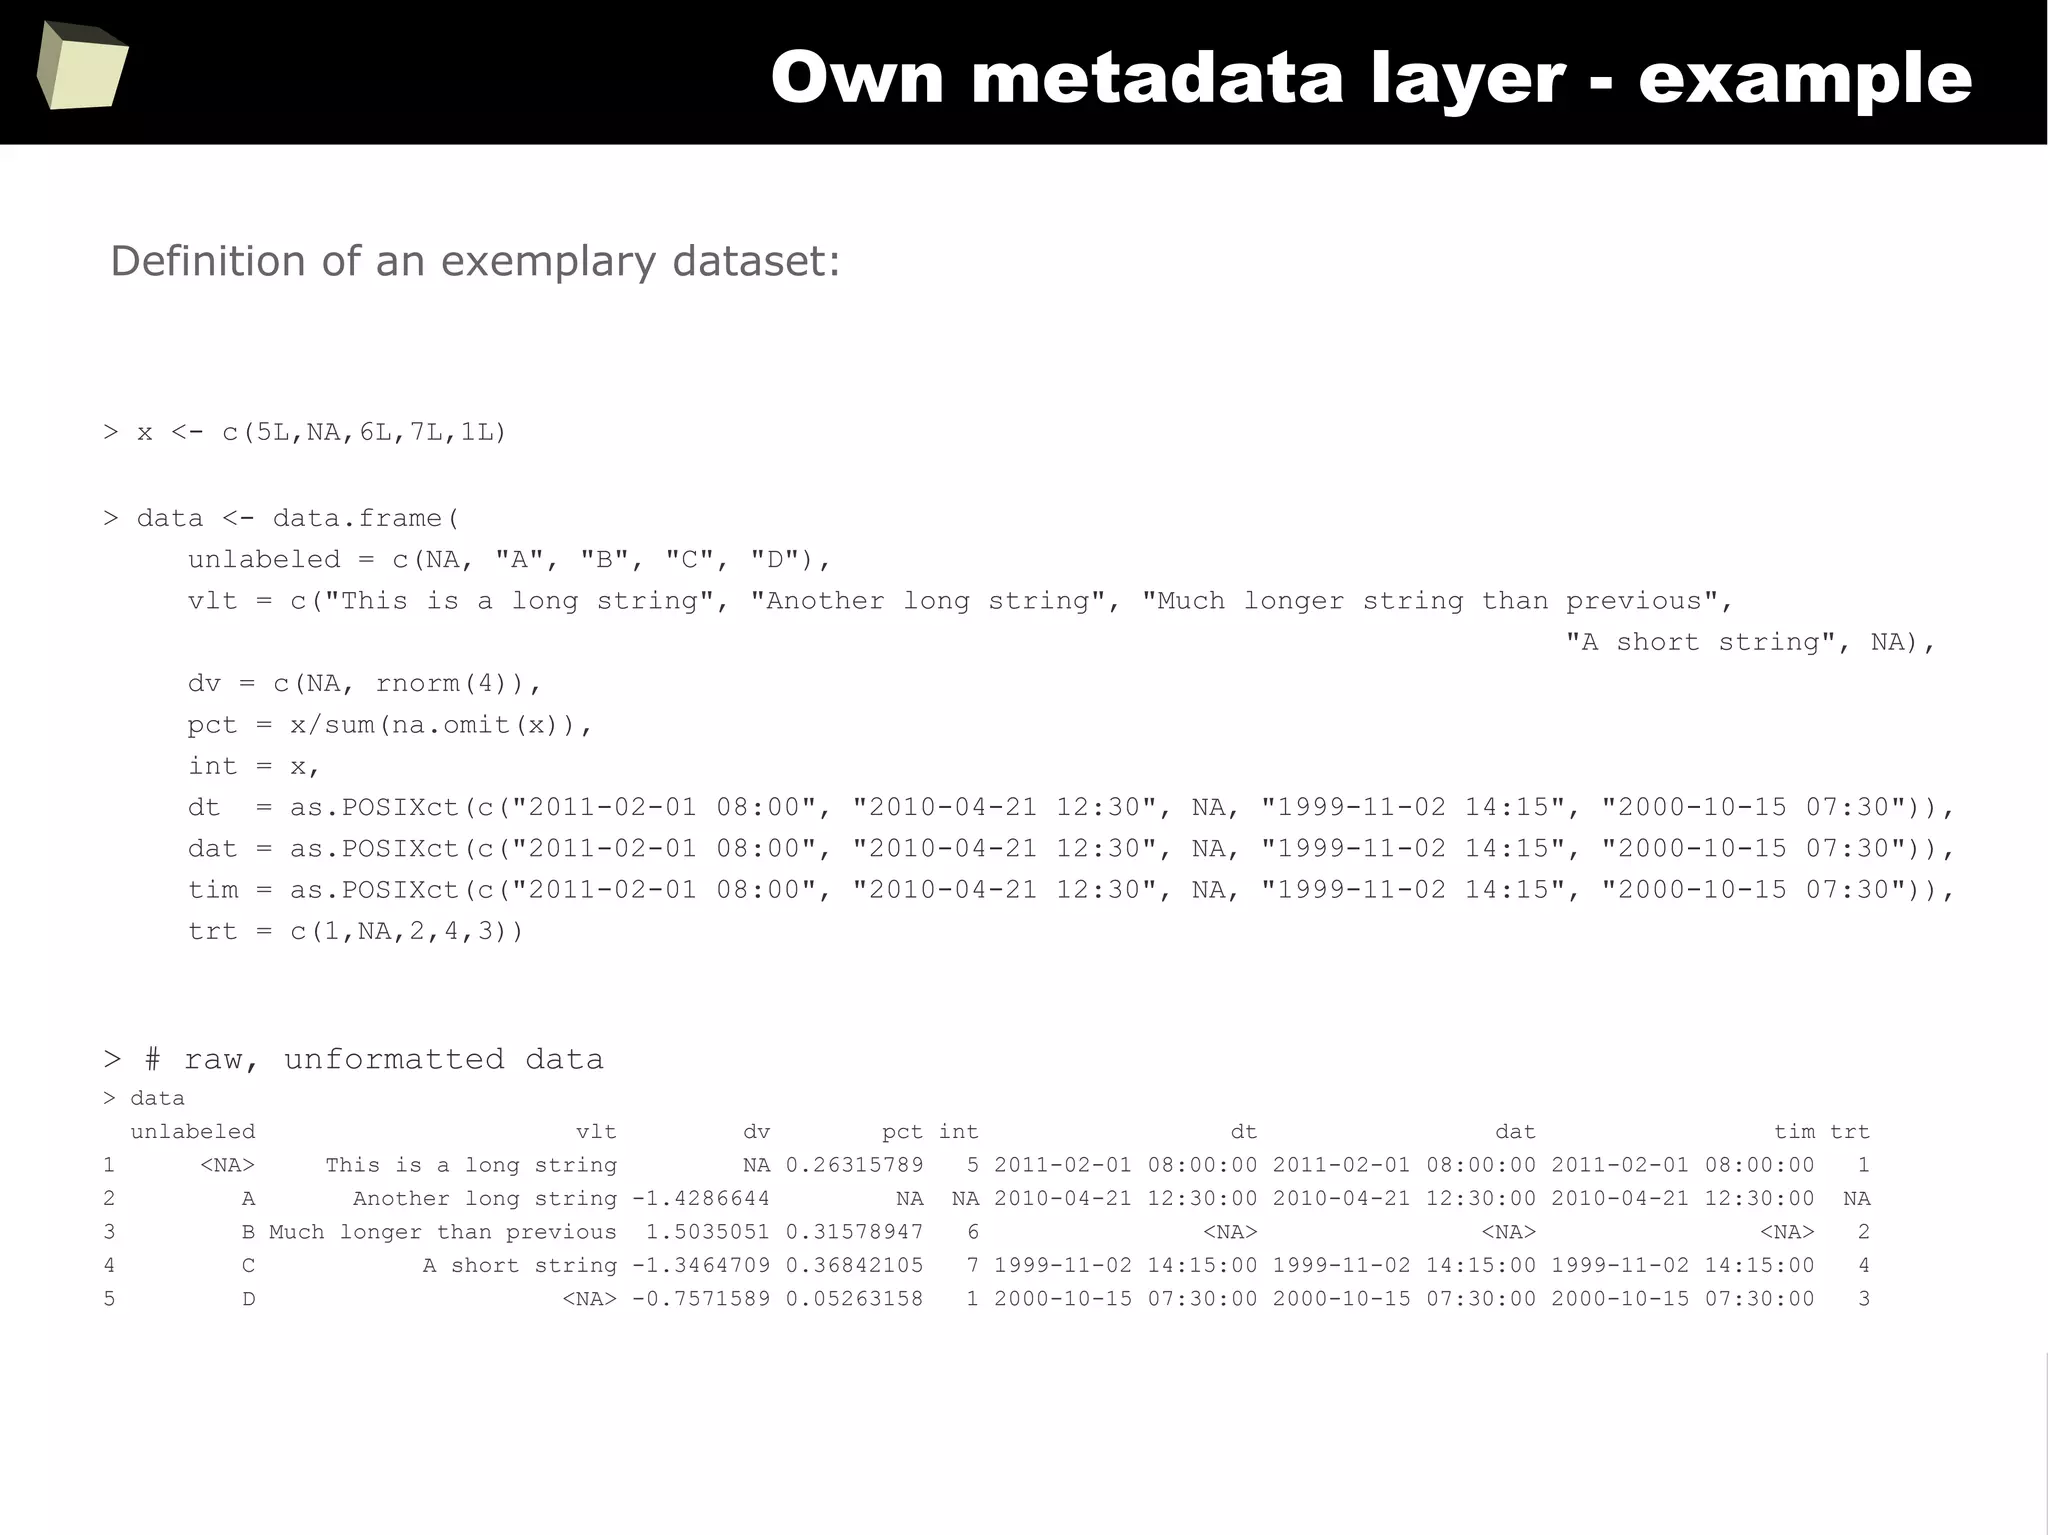
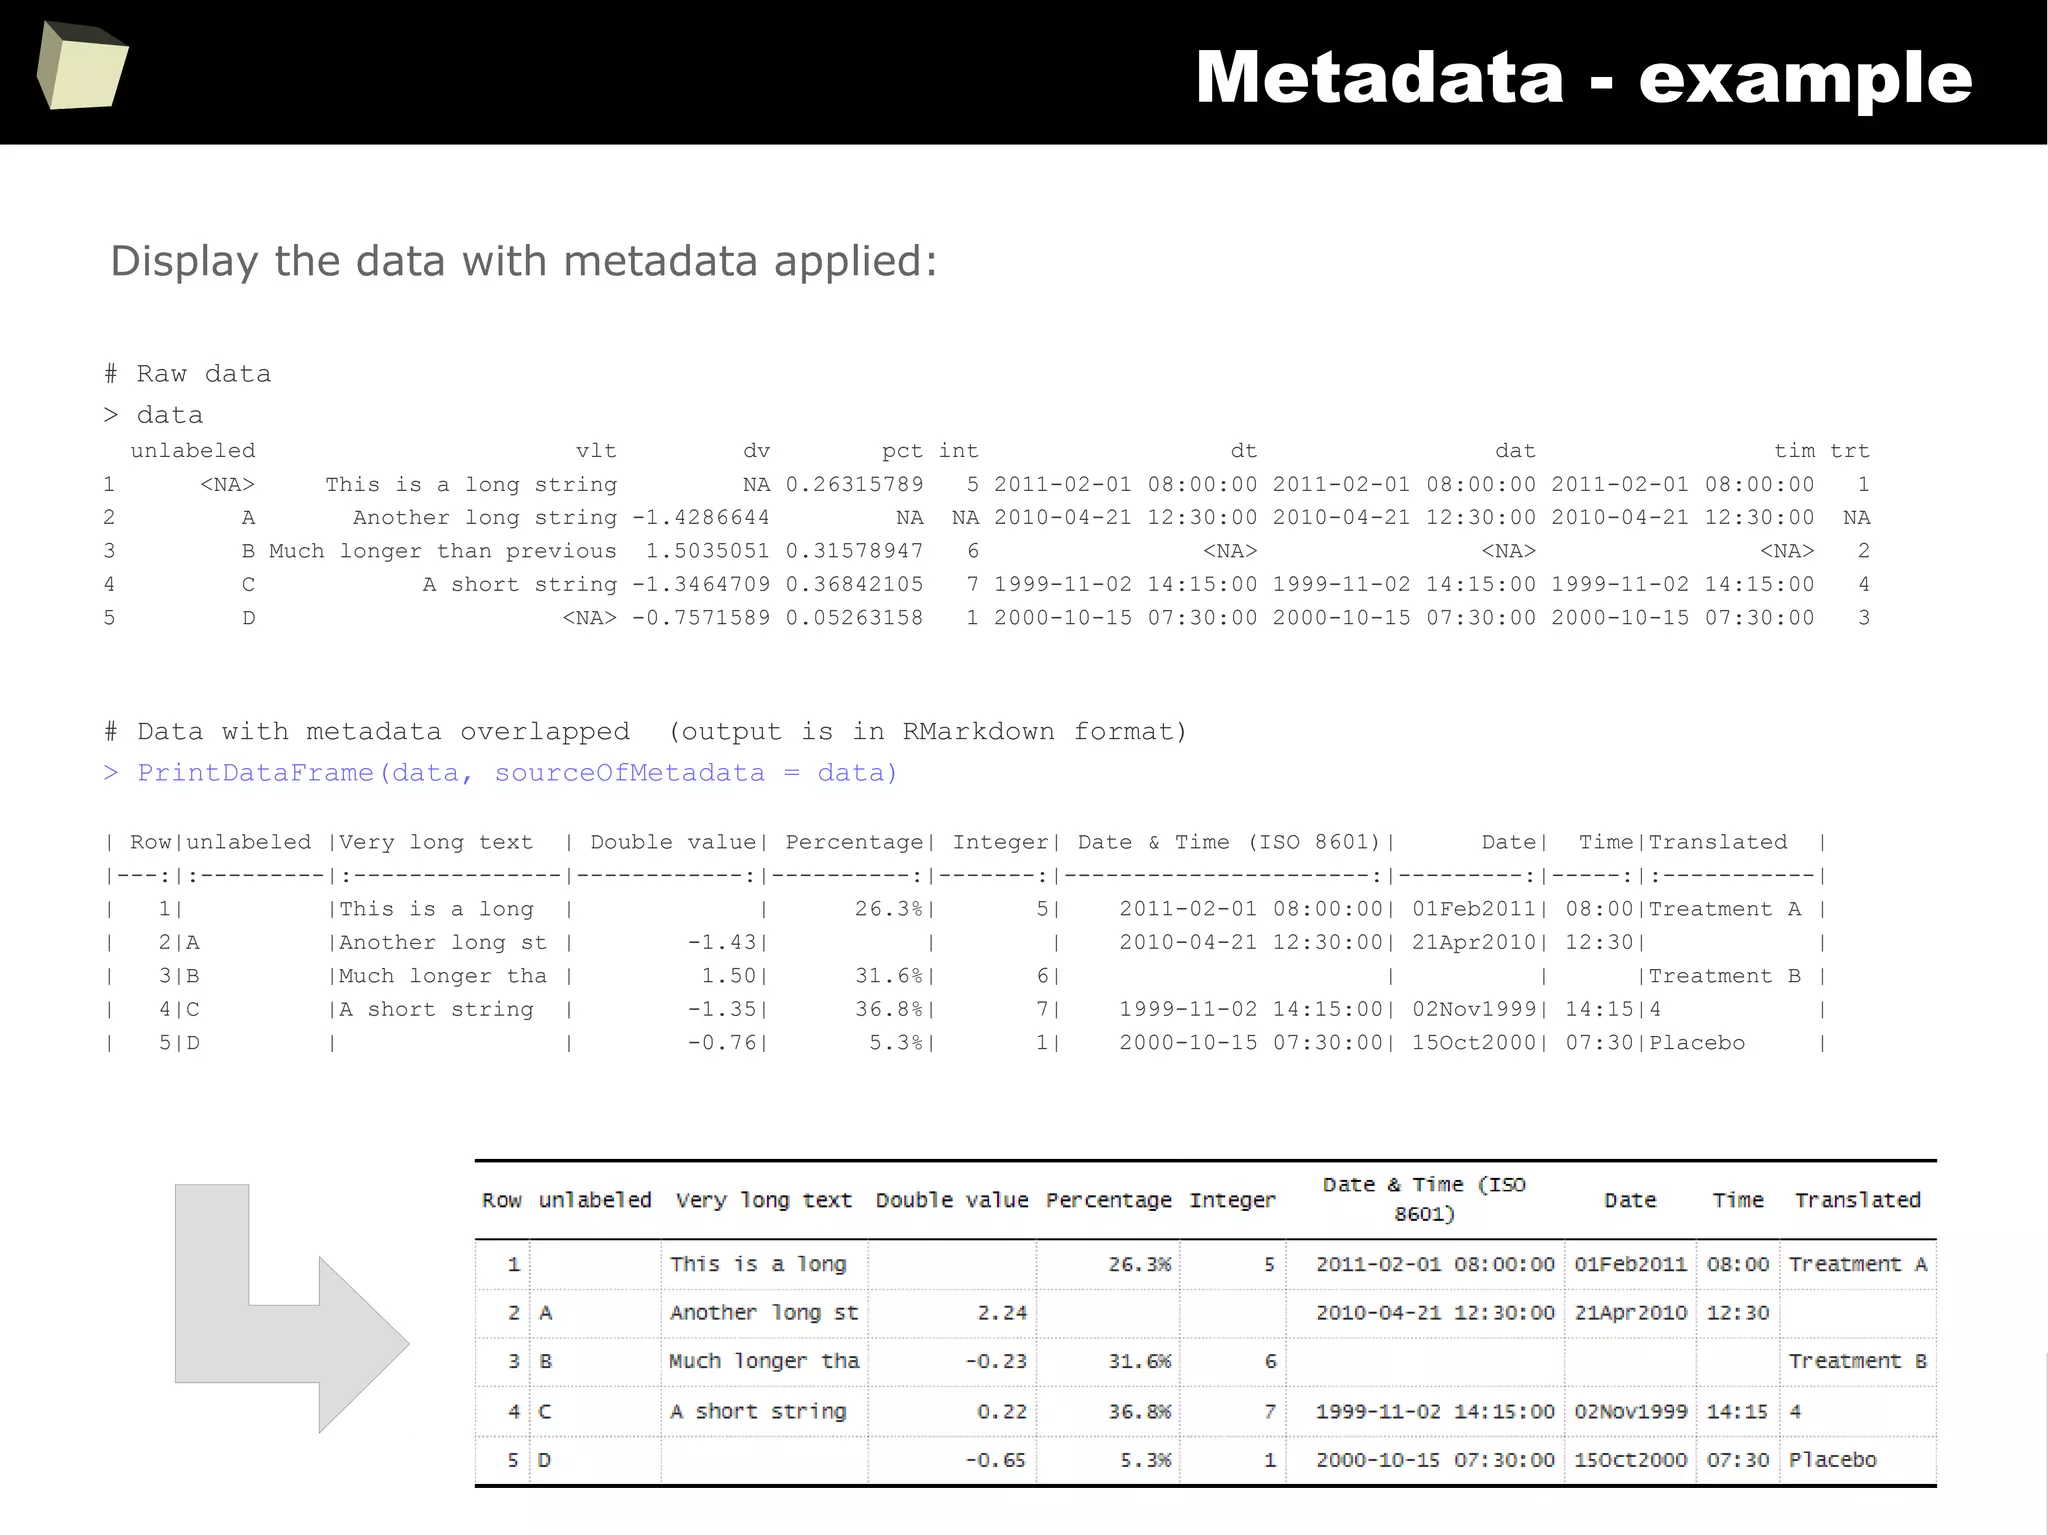
![357
Metadata - example
> SetVarAttributes(data$vlt, label = "Very long text", textWidth = 15, sasFormat = "$15.")
> SetVarAttributes(data$dv, label = "Double value", decimPlaces = 2, sasFormat = "8.2")
> SetVarAttributes(data$pct, label = "Percentage", decimPlaces = 1, asPercent = TRUE)
> SetSVarAttributes("data$int", label = "Integer") # variable name passed as a literal
> SetVarAttributes(data$dat, label = "Date", dateFormat = "%d%b%Y", sasFormat = "yymmdd10.")
> SetVarAttributes(data$dt, label = "Date & Time (ISO 8601)", dateFormat = "%Y-%m-%d %H:%M:%S",
sasFormat = "e8601dt19.")
> SetVarAttributes(data$tim, label = "Time", dateFormat = "%H:%M")
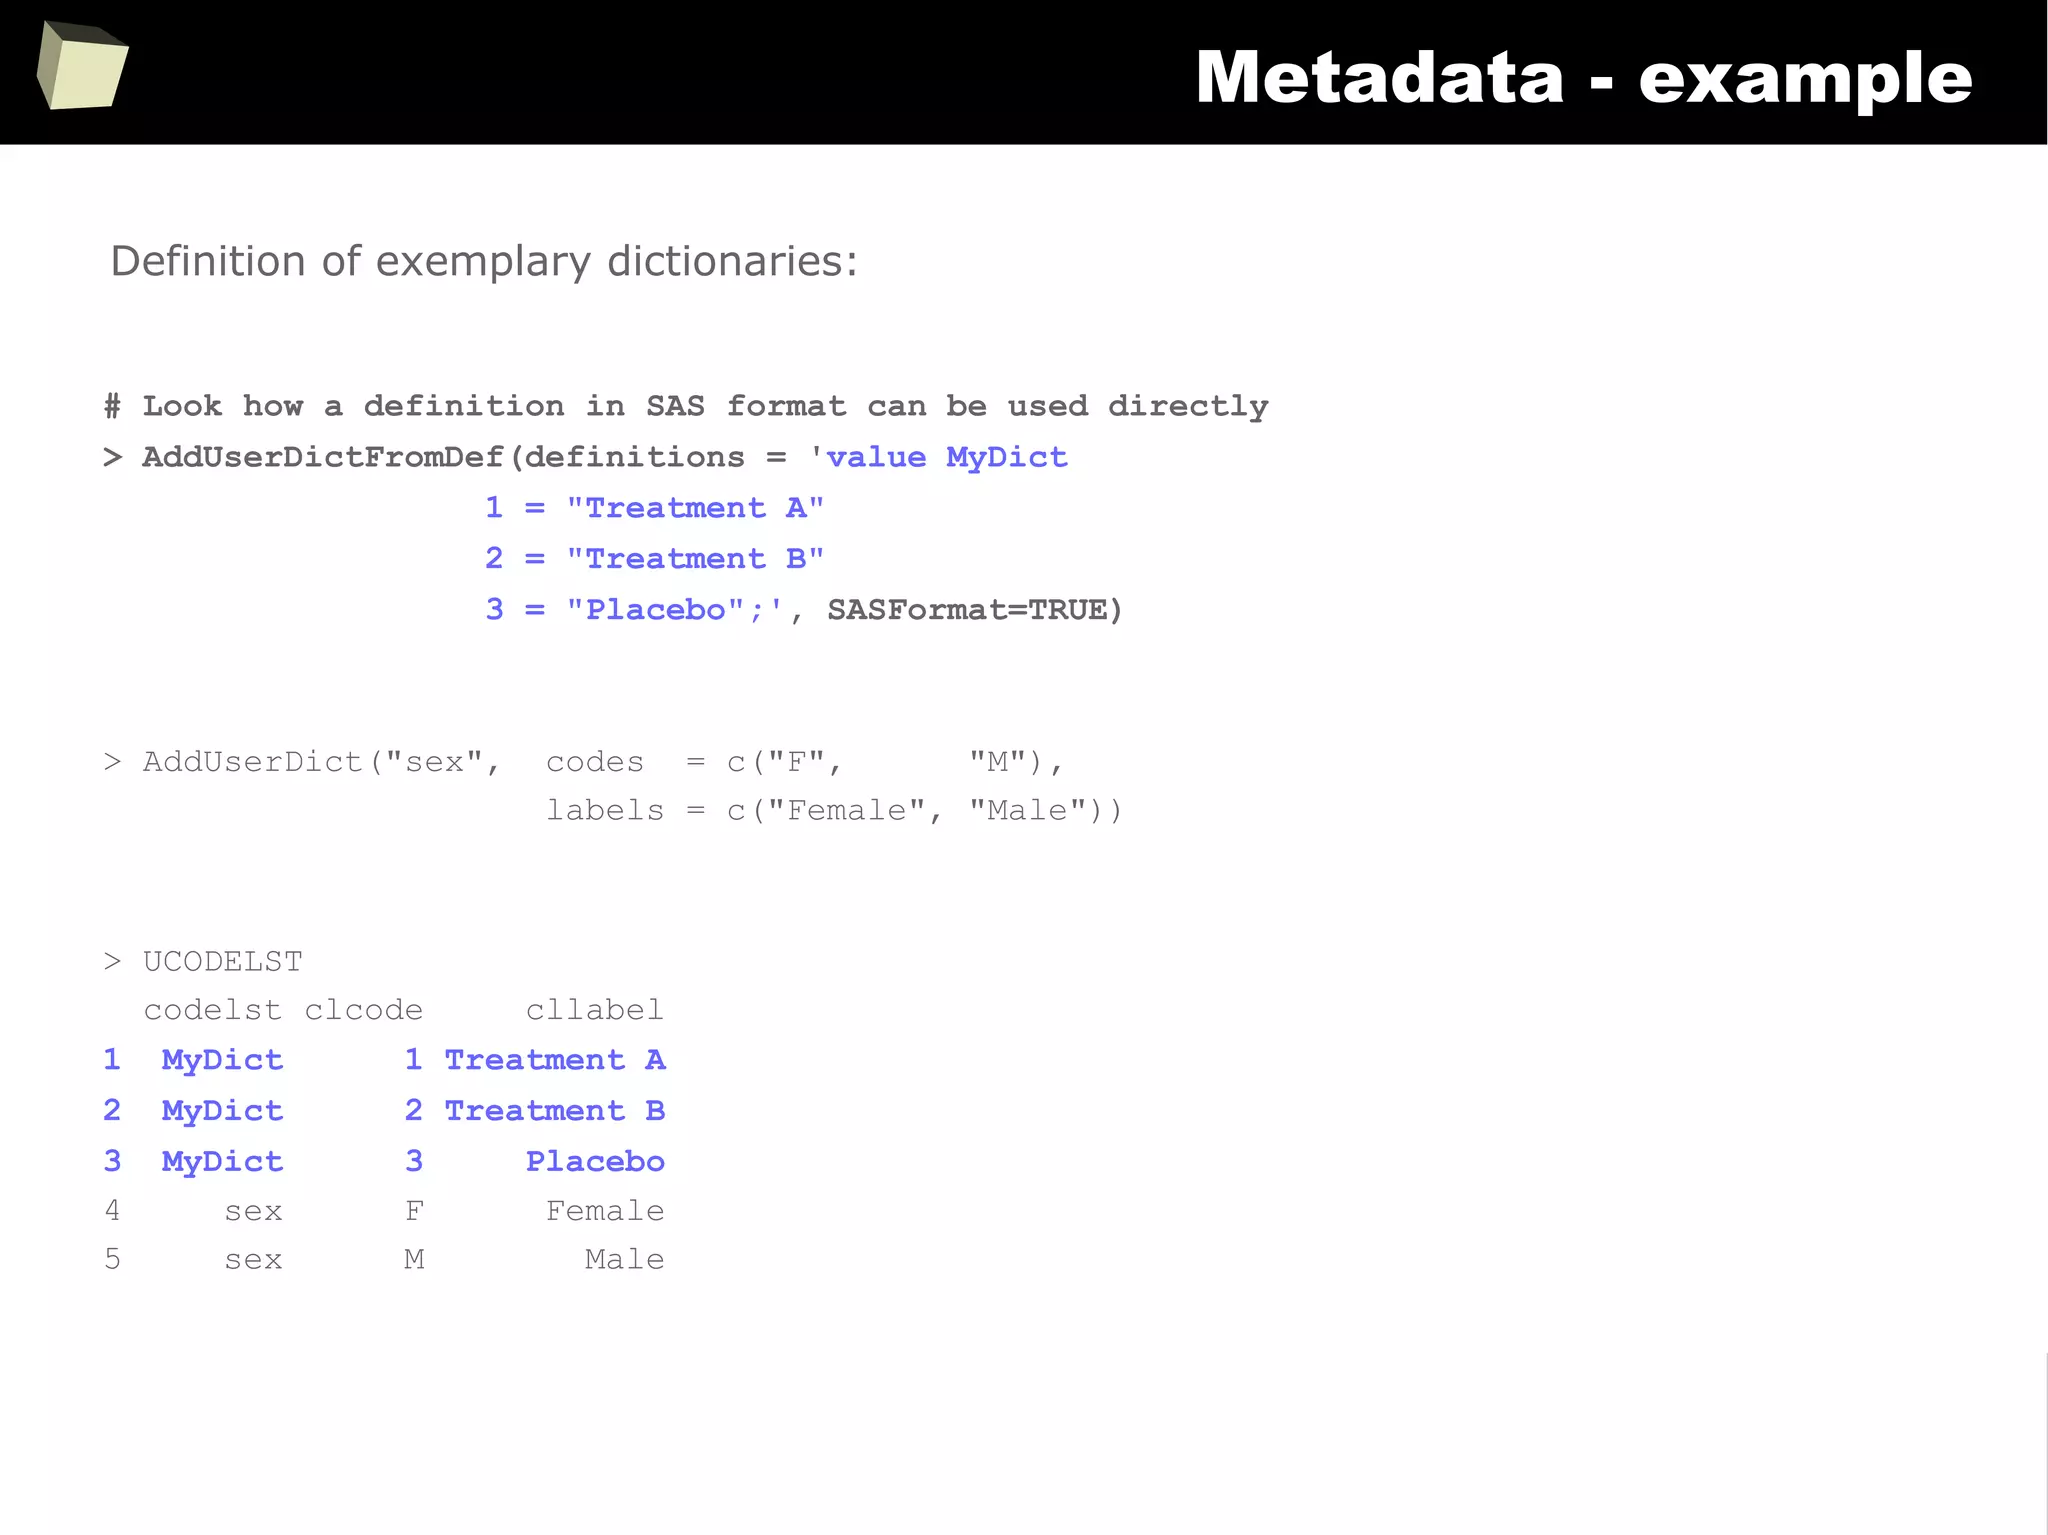
> SetVarAttributes(data$trt, label = "Translated", translDict = "MyDict")
> SetVarAttributes(data, label = "My data set")
> attributes(data$dt)
$class
[1] "POSIXct" "POSIXt"
$tzone
[1] ""
$comment
[1] "Date & Time (ISO 8601)"
$user.date.format
[1] "%Y-%m-%d %H:%M:%S"
$user.sas.format
[1] "e8601dt19."
Add some metadata:
Attributes bound to
a column of a data.frame](https://image.slidesharecdn.com/is-r-suitable-enough-for-clinical-research-160113193220/75/GNU-R-in-Clinical-Research-and-Evidence-Based-Medicine-357-2048.jpg)
![359
Metadata - example
> DescribeTable(data) # simple, default form
My data set
_______________________________________________________________________________________________________________________________________________________
Rows: 5
dat* DAT maxL: 19 W: D: T: N: 4 NA: 1 U: 5 | 01Feb2011, 21Apr2010, NA, 02Nov1999, 15Oct2000
dt* DAT maxL: 19 W: D: T: N: 4 NA: 1 U: 5 | 2011-02-01 08:00:00, 2010-04-21 12:30:00, NA, 1999-11-02 14:15:00, 2000-10-15 07:30:00
dv* dbl maxL: 18 W: D:2 T: N: 4 NA: 1 U: 5 | Min -1.43, Q1 -1.39, Me -1.05, Q3 0.37, Max 1.5 | NA, -1.42866436243726, 1.50350508808 ...
int* int maxL: 2 W: D:0 T: N: 4 NA: 1 U: 5 | Min 1, Q1 3, Me 5.5, Q3 6.5, Max 7 | 5, NA, 6, 7, 1
pct* dbl maxL: 18 W: D:1 T: N: 4 NA: 1 U: 5 | Min 0.05, Q1 0.16, Me 0.29, Q3 0.34, Max 0.37 | 0.263157894736842, NA, 0.3157894736842 ...
tim* DAT maxL: 19 W: D: T: N: 4 NA: 1 U: 5 | 08:00, 12:30, NA, 14:15, 07:30
trt* dbl maxL: 2 W: D:2 T:Y N: 4 NA: 1 U: 5 | Min 1, Q1 1.5, Me 2.5, Q3 3.5, Max 4 | (MyDict) Treatment A, NA, Treatment B, 4, Placebo
unlabeled txt maxL: 2 W: D: T: N: 4 NA: 1 U: 5 | NA, A, B, C, D
vlt* txt maxL: 25 W: 15 D: T: N: 4 NA: 1 U: 5 | This is a long string, Another long string, Much longer than previous, A short string, NA
> DescribeTable(data, displayLabels=TRUE, displaySASFormats = TRUE) # more detailed
My data set
_______________________________________________________________________________________________________________________________________________________
Rows: 5
dat [Date] DAT maxL: 19 W: D: SASf: yymmdd10. T: N: 4 NA: 1 U: 5 | 01Feb2011, 21Apr2010, NA, 02Nov1999, 15Oct2000
dt [Date & Time (ISO 8601)]DAT maxL: 19 W: D: SASf:e8601dt19. T: N: 4 NA: 1 U: 5 | 2011-02-01 08:00:00, 2010-04-21 12:30:00, NA, 1 ...
dv [Double value] dbl maxL: 18 W: D:2 SASf: 8.2 T: N: 4 NA: 1 U: 5 | Min -1.43, Q1 -1.39, Me -1.05, Q3 0.37, Max 1.5 ...
int [Integer] int maxL: 2 W: D:0 SASf: T: N: 4 NA: 1 U: 5 | Min 1, Q1 3, Me 5.5, Q3 6.5, Max 7 | 5, NA, 6, ...
pct [Percentage] dbl maxL: 18 W: D:1 SASf: T: N: 4 NA: 1 U: 5 | Min 0.05, Q1 0.16, Me 0.29, Q3 0.34, Max 0.37 | ...
tim [Time] DAT maxL: 19 W: D: SASf: T: N: 4 NA: 1 U: 5 | 08:00, 12:30, NA, 14:15, 07:30
trt [Translated] dbl maxL: 2 W: D:2 SASf: T:Y N: 4 NA: 1 U: 5 | Min 1, Q1 1.5, Me 2.5, Q3 3.5, Max 4 | (MyDict) ...
unlabeled txt maxL: 2 W: D: SASf: T: N: 4 NA: 1 U: 5 | NA, A, B, C, D
vlt [Very long text] txt maxL: 25 W: 15 D: SASf: $15. T: N: 4 NA: 1 U: 5 | This is a long string, Another long string, Muc ...
Describe dataset with metadata attached:](https://image.slidesharecdn.com/is-r-suitable-enough-for-clinical-research-160113193220/75/GNU-R-in-Clinical-Research-and-Evidence-Based-Medicine-359-2048.jpg)
![360
Metadata - example
> newData <- sqldf("SELECT * FROM data") # sqldf wipes out attributes
> DescribeTable(newData, displayLabels=TRUE, displaySASFormats = TRUE)
Rows: 5
dat DAT maxL: 19 W: D: SASf: T: N: 4 NA: 1 U: 5 | 2011-02-01 08:00:00, 2010-04-21 12:30:00, NA, 1999-11-02 14:15:00, 2000-10-15 07 ...
dt DAT maxL: 19 W: D: SASf: T: N: 4 NA: 1 U: 5 | 2011-02-01 08:00:00, 2010-04-21 12:30:00, NA, 1999-11-02 14:15:00, 2000-10-15 07 ...
dv dbl maxL: 18 W: D:2 SASf: T: N: 4 NA: 1 U: 5 | Min -0.65, Q1 -0.44, Me 0, Q3 1.23, Max 2.24 | NA, 2.24243108561811, -0.22569800 ...
int int maxL: 2 W: D:0 SASf: T: N: 4 NA: 1 U: 5 | Min 1, Q1 3, Me 5.5, Q3 6.5, Max 7 | 5, NA, 6, 7, 1
pct dbl maxL: 18 W: D:2 SASf: T: N: 4 NA: 1 U: 5 | Min 0.05, Q1 0.16, Me 0.29, Q3 0.34, Max 0.37 | 0.263157894736842, NA, 0.3157894 ...
tim DAT maxL: 19 W: D: SASf: T: N: 4 NA: 1 U: 5 | 2011-02-01 08:00:00, 2010-04-21 12:30:00, NA, 1999-11-02 14:15:00, 2000-10-15 07 ...
trt dbl maxL: 2 W: D:2 SASf: T: N: 4 NA: 1 U: 5 | Min 1, Q1 1.5, Me 2.5, Q3 3.5, Max 4 | 1, NA, 2, 4, 3
unlabeled txt maxL: 2 W: D: SASf: T: N: 4 NA: 1 U: 5 | NA, A, B, C, D
vlt txt maxL: 25 W: D: SASf: T: N: 4 NA: 1 U: 5 | This is a long string, Another long string, Much longer than previous, A short s ...
> CopyUserAttributes(srcDS = data, destDS = newData, env=environment())
Copied table attribute: [newData]@comment = My data set
Copied column attribute: [vlt]@comment = Very long text
Copied column attribute: [vlt]@user.str.len = 15
Copied column attribute: [vlt]@user.sas.format = $15.
...
Copied column attribute: [trt]@comment = Translated
Copied column attribute: [trt]@user.transl.dict = MyDict
> DescribeTable(newData, displayLabels=TRUE, displaySASFormats = TRUE)
My data set
_______________________________________________________________________________________________________________________________________________________
Rows: 5
dat [Date] DAT maxL: 19 W: D: SASf: yymmdd10. T: N: 4 NA: 1 U: 5 | 01Feb2011, 21Apr2010, NA, 02Nov1999, 15Oct2000
dt [Date & Time (ISO 8601)]DAT maxL: 19 W: D: SASf:e8601dt19. T: N: 4 NA: 1 U: 5 | 2011-02-01 08:00:00, 2010-04-21 12:30:00, NA, 1 ...
dv [Double value] dbl maxL: 18 W: D:2 SASf: 8.2 T: N: 4 NA: 1 U: 5 | Min -0.65, Q1 -0.44, Me 0, Q3 1.23, Max 2.24 | ...
int [Integer] int maxL: 2 W: D:0 SASf: T: N: 4 NA: 1 U: 5 | Min 1, Q1 3, Me 5.5, Q3 6.5, Max 7 | 5, NA, 6, ...
pct [Percentage] dbl maxL: 18 W: D:1 SASf: T: N: 4 NA: 1 U: 5 | Min 0.05, Q1 0.16, Me 0.29, Q3 0.34, Max 0.37 | ...
tim [Time] DAT maxL: 19 W: D: SASf: T: N: 4 NA: 1 U: 5 | 08:00, 12:30, NA, 14:15, 07:30
trt [Translated] dbl maxL: 2 W: D:2 SASf: T:Y N: 4 NA: 1 U: 5 | Min 1, Q1 1.5, Me 2.5, Q3 3.5, Max 4 | (MyDict) ...
unlabeled txt maxL: 2 W: D: SASf: T: N: 4 NA: 1 U: 5 | NA, A, B, C, D
vlt [Very long text] txt maxL: 25 W: 15 D: SASf: $15. T: N: 4 NA: 1 U: 5 | This is a long string, Another long string, Muc ...
Transfer attributes between two datasets.](https://image.slidesharecdn.com/is-r-suitable-enough-for-clinical-research-160113193220/75/GNU-R-in-Clinical-Research-and-Evidence-Based-Medicine-360-2048.jpg)
![361
Metadata - example
keep.attr <- function(x)
{
a <- attributes(x)
a[c('names','row.names','class','dim','dimnames')] <- NULL
a
}
keep <- function(.Data, ..., .Attr=NULL)
{
cl <- union('keep', class(.Data))
do.call('structure', c(list(.Data, class=cl, ...), .Attr))
}
'[.keep' <- function(.Data, ...)
keep(NextMethod(), .Attr=keep.attr(.Data))
'[<-.keep' <- function(.Data, ...)
keep(NextMethod(), .Attr=keep.attr(.Data))
> newData <- data # dataset “data” has attributes which will be copied
> DescribeTable(newData, displayLabels=TRUE, displaySASFormats = TRUE)
My data set
_______________________________________________________________________________________________________________________________________________________
Rows: 5
dat [Date] DAT maxL: 19 W: D: SASf: yymmdd10. T: N: 4 NA: 1 U: 5 | 01Feb2011, 21Apr2010, NA, 02Nov1999, 15Oct2000
dt [Date & Time (ISO 8601)]DAT maxL: 19 W: D: SASf:e8601dt19. T: N: 4 NA: 1 U: 5 | 2011-02-01 08:00:00, 2010-04-21 12:30:00, NA, 1 ...
dv [Double value] dbl maxL: 18 W: D:2 SASf: 8.2 T: N: 4 NA: 1 U: 5 | Min -0.65, Q1 -0.44, Me 0, Q3 1.23, Max 2.24 | ...
int [Integer] int maxL: 2 W: D:0 SASf: T: N: 4 NA: 1 U: 5 | Min 1, Q1 3, Me 5.5, Q3 6.5, Max 7 | 5, NA, 6, ...
pct [Percentage] dbl maxL: 18 W: D:1 SASf: T: N: 4 NA: 1 U: 5 | Min 0.05, Q1 0.16, Me 0.29, Q3 0.34, Max 0.37 | ...
tim [Time] DAT maxL: 19 W: D: SASf: T: N: 4 NA: 1 U: 5 | 08:00, 12:30, NA, 14:15, 07:30
trt [Translated] dbl maxL: 2 W: D:2 SASf: T:Y N: 4 NA: 1 U: 5 | Min 1, Q1 1.5, Me 2.5, Q3 3.5, Max 4 | (MyDict) ...
unlabeled txt maxL: 2 W: D: SASf: T: N: 4 NA: 1 U: 5 | NA, A, B, C, D
vlt [Very long text] txt maxL: 25 W: 15 D: SASf: $15. T: N: 4 NA: 1 U: 5 | This is a long string, Another long string, Muc ...
Transfer attributes when datasets are copied via <- or =](https://image.slidesharecdn.com/is-r-suitable-enough-for-clinical-research-160113193220/75/GNU-R-in-Clinical-Research-and-Evidence-Based-Medicine-361-2048.jpg)
![362
Metadata – reading *.sasXmlMap
# Quick and dirty reading labels from the *.sasXmlMap file. This can be easily extended.
ApplyLabelsFromSasXmlMap <- function(collectionOfTables, pathToSasXmlMap) {
nameOfTablesCollection <- deparse(substitute(collectionOfTables))
if(file.exists(pathToSasXmlMap)) {
DOM <- xmlParse(pathToSasXmlMap)
for(tab in names(collectionOfTables)) {
for(col in toupper(colnames(collectionOfTables[[tab]]))) {
labelList <- xpathApply(DOM, paste0("//TABLE[@name = '", tab, "']/COLUMN[@name = '", col,
"']/DESCRIPTION"), xmlValue)
if(length(labelList) > 0) {
cat(paste("Table:", tab, " Column:", col, "=", labelList[[1]], "n"))
SetSVarAttributes(varName = paste0(nameOfTablesCollection, "$", tab, "$",
tolower(col)), label = labelList[[1]])
}
}
}
}
}
With R one can easily parse additional XML files containing definition of metadata.](https://image.slidesharecdn.com/is-r-suitable-enough-for-clinical-research-160113193220/75/GNU-R-in-Clinical-Research-and-Evidence-Based-Medicine-362-2048.jpg)

![373
R implementation of useful SAS functions #1
FirstRowsBy <- function(dataFrame, byColumns) {
DT <- data.table(dataFrame, key=byColumns)
as.data.frame(DT[unique(DT[, key(DT), with = FALSE]), mult = 'first'])
}
LastRowsBy <- function(dataFrame, byColumns) {
DT <- data.table(dataFrame, key=byColumns)
as.data.frame(DT[unique(DT[, key(DT), with = FALSE]), mult = 'last'])
}
MarkFirstLastBy <- function(dataFrame, byColumns) {
idName <- paste0("ID", paste0(sample(c(LETTERS, letters, 0:9), size=5), collapse=""))
dataFrame[, idName] <- seq_len(nrow(dataFrame))
firstIDs <- FirstRowsBy(dataFrame = dataFrame, byColumns = byColumns)[, idName]
lastIDs <- LastRowsBy(dataFrame = dataFrame, byColumns = byColumns)[, idName]
dataFrame$FIRST <- dataFrame[, idName] %in% firstIDs
dataFrame$LAST <- dataFrame[, idName] %in% lastIDs
dataFrame[, idName] <- NULL
return(dataFrame)
}](https://image.slidesharecdn.com/is-r-suitable-enough-for-clinical-research-160113193220/75/GNU-R-in-Clinical-Research-and-Evidence-Based-Medicine-373-2048.jpg)


![[DSC Europe 25] Marija Vlajkovic & Andrea Radonjanin - Integration of AI tool...](https://cdn.slidesharecdn.com/ss_thumbnails/qf1jrglttoc3bm8s3aop-final-integration-of-ai-tools-251208151905-394f3a6a-thumbnail.jpg?width=640&height=640&fit=bounds)
![[DSC Europe 25] Petar Zivanov - AI meets documents From chatbots to AI-powere...](https://cdn.slidesharecdn.com/ss_thumbnails/xer2bb6nrdc8pdpev0pc-8-251204082258-7c2fa4a1-thumbnail.jpg?width=640&height=640&fit=bounds)


![[DSC Europe 25] Goran Obradovic - The Rise of Sovereign AI: Building the Regi...](https://cdn.slidesharecdn.com/ss_thumbnails/7nw2xxixrxqdxvrb5wca-6-251205085714-ab09a2ac-thumbnail.jpg?width=640&height=640&fit=bounds)

![[DSC Europe 25] Dragana Ilic - AI for Big Data in Astronomy.pptx](https://cdn.slidesharecdn.com/ss_thumbnails/8palya86qaatvjhva1ms-2-dragana-ilic-ai-ilic-251208151906-652b819c-thumbnail.jpg?width=640&height=640&fit=bounds)


