SlideShare a Scribd company logo
1 of 30
Download to read offline
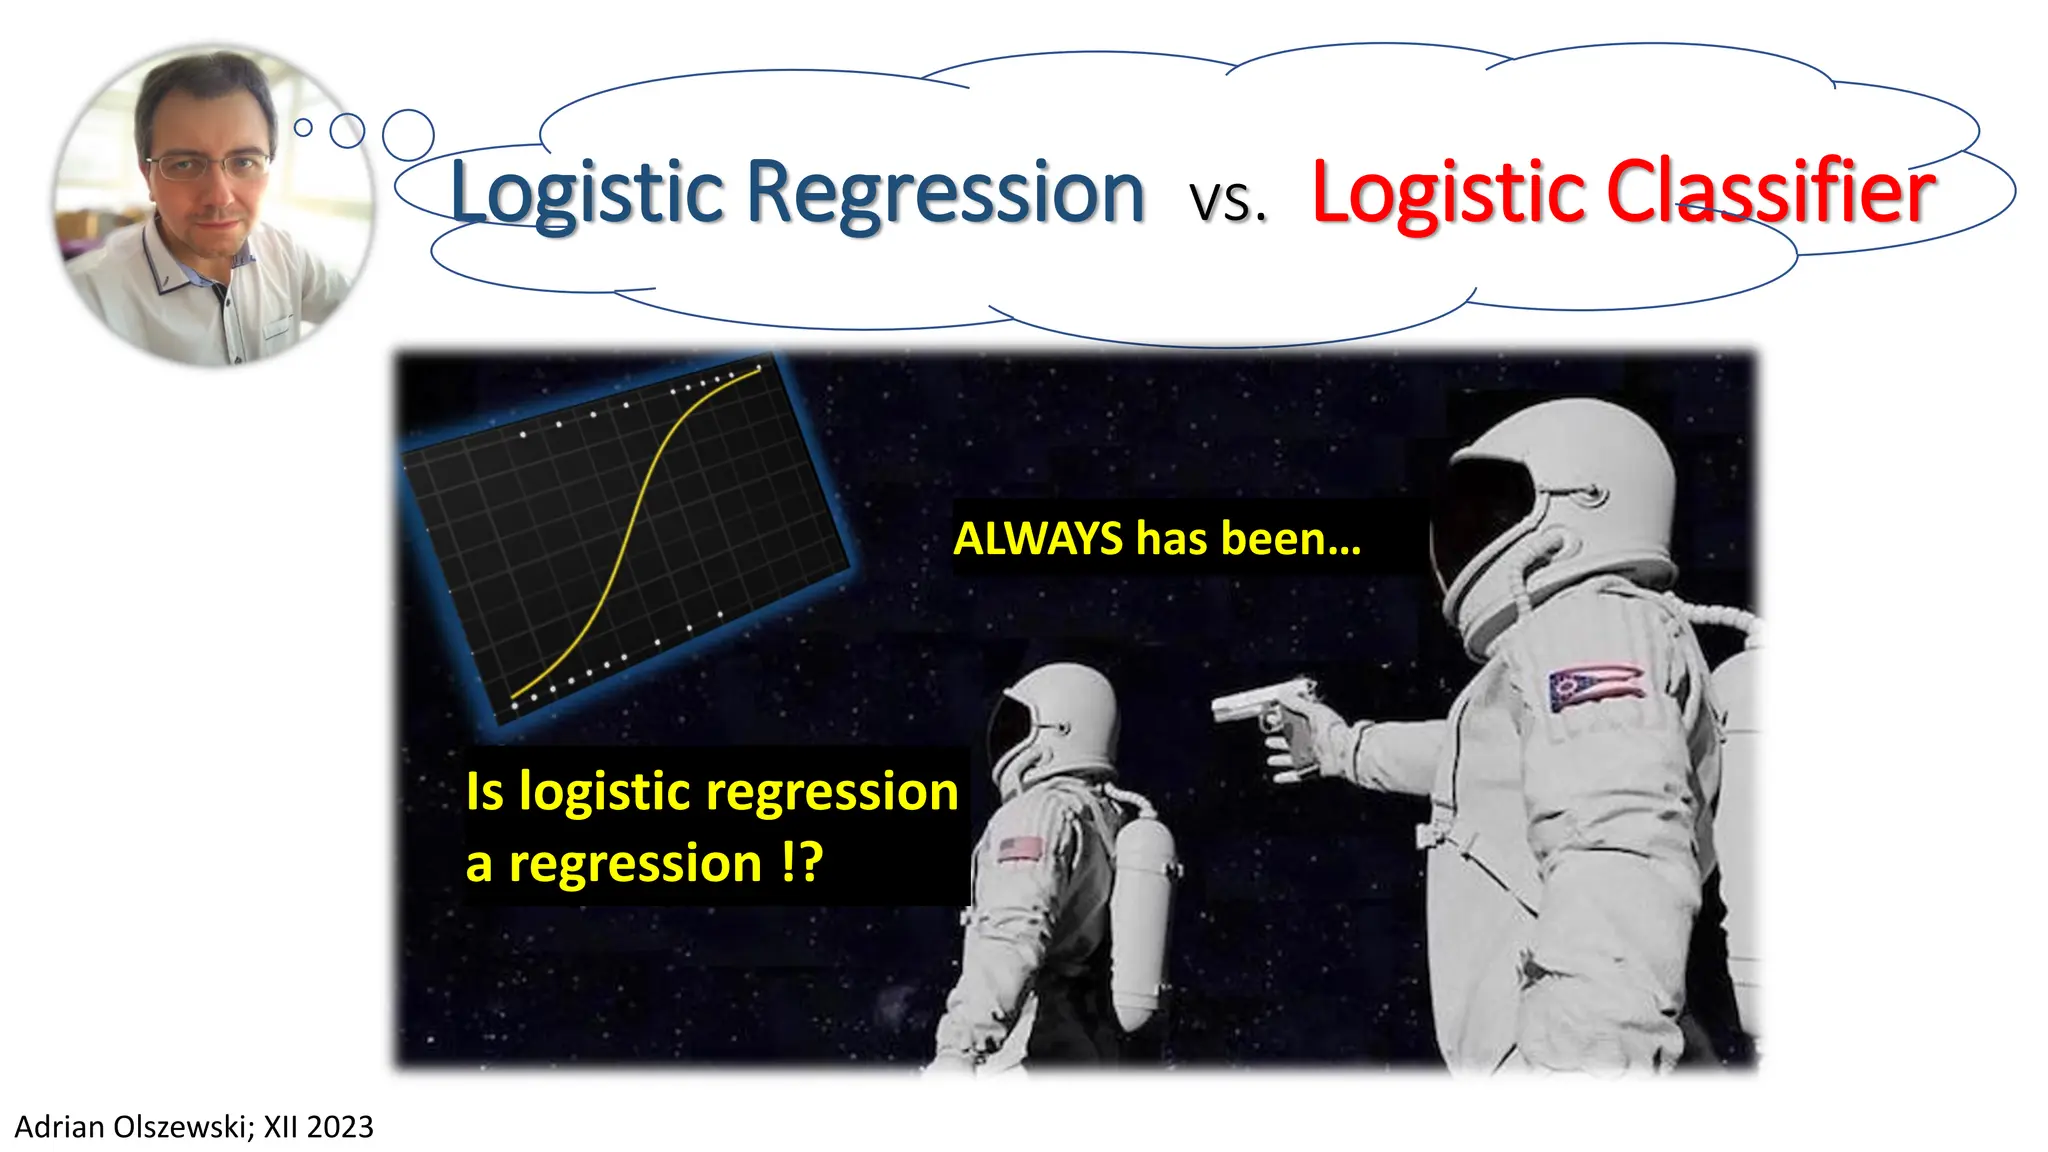
Logistic Regression vs. Logistic Classifier
Is logistic regression
a regression !?
ALWAYS has been…
Adrian Olszewski; XII 2023
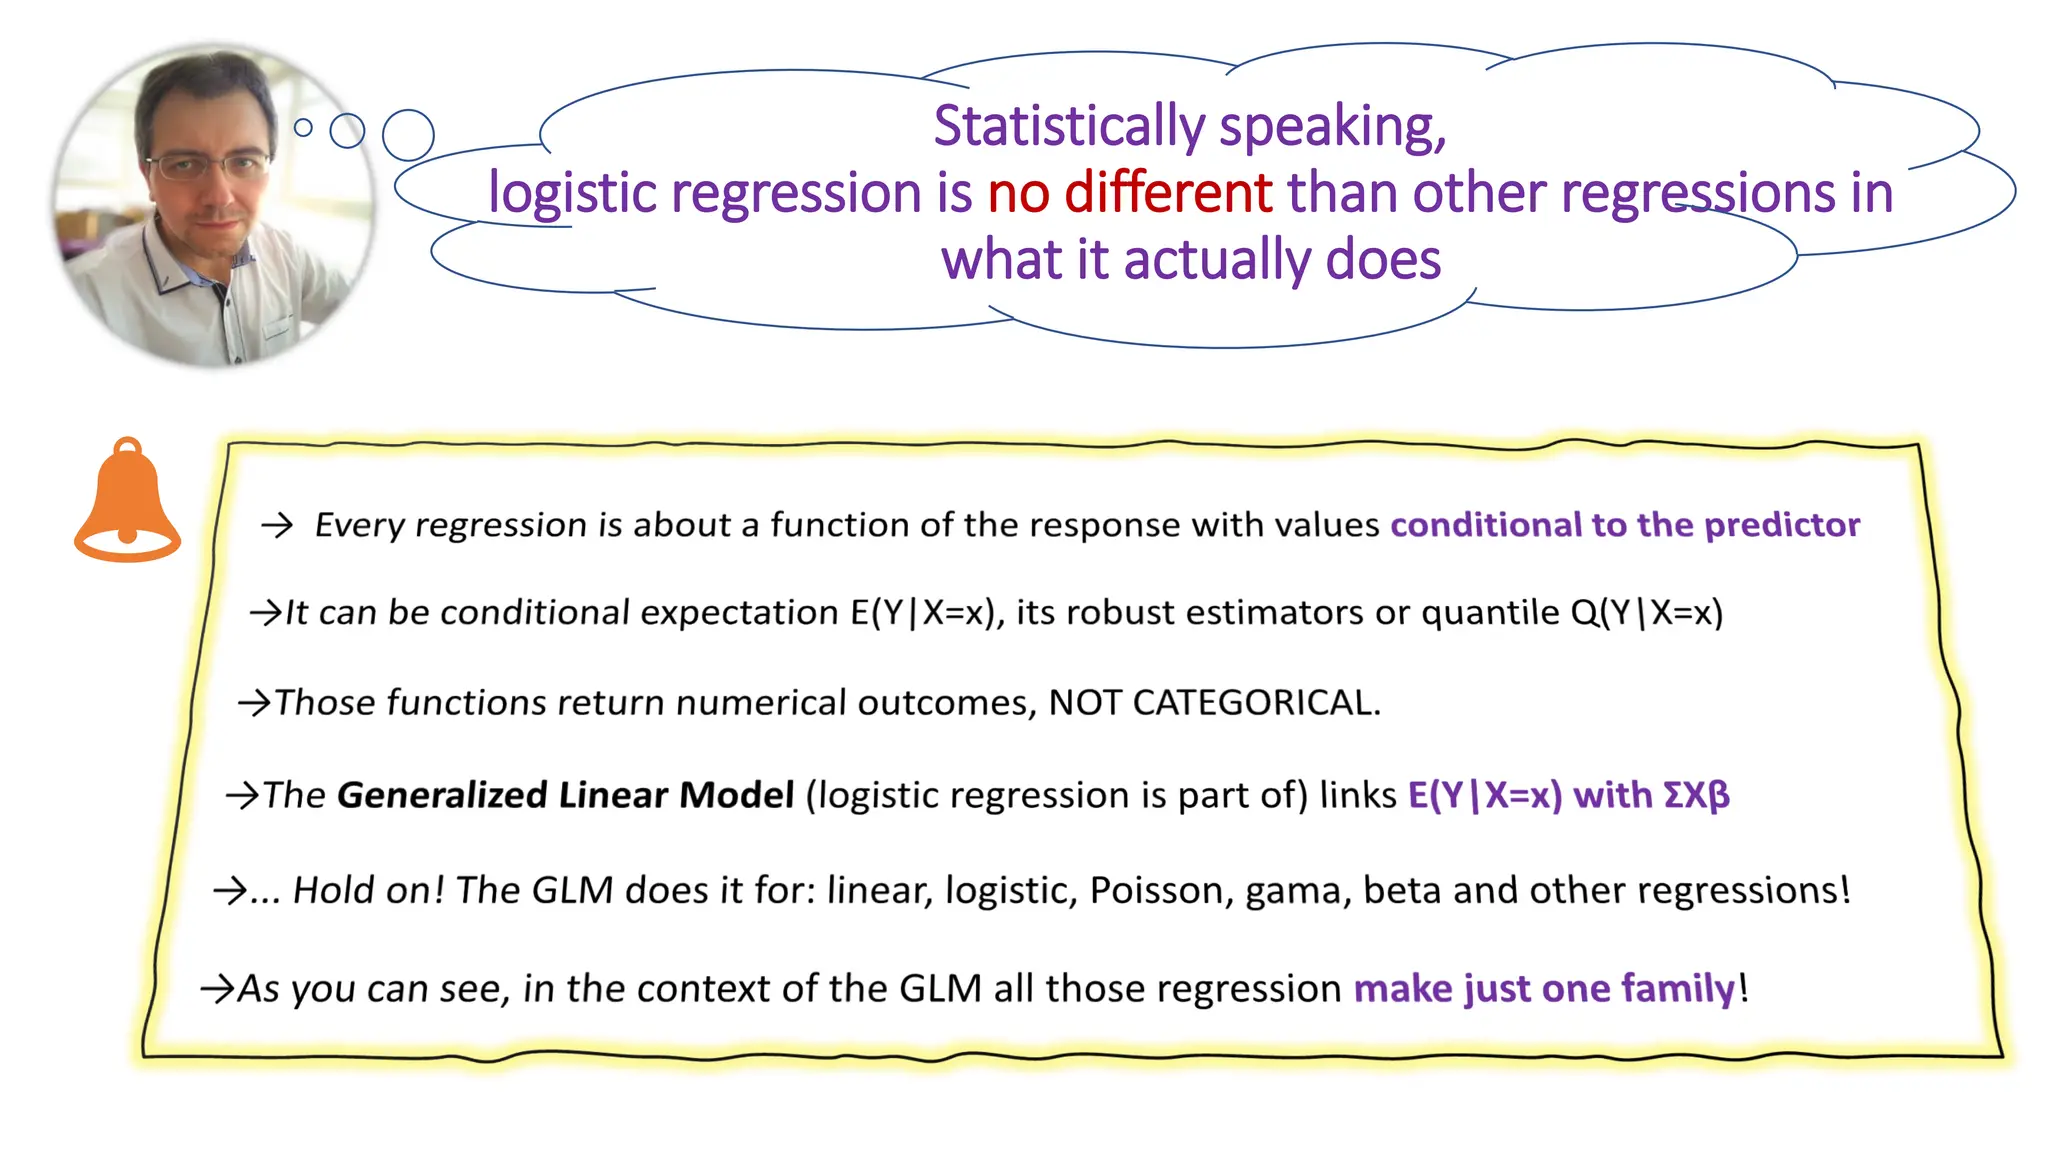
Statistically speaking,
logistic regression is no different than other regressions in
what it actually does
Brief story #1
Brief story #2
…but one day…
Instead of using a proper name: „logistic classifier” (which gives categorical output), some
people from the #ML world have decided to completely replace well-known terms:
→ they left the „regression” for the classifier and announced that „LR is not a regression”
In my work, I’ve been using the logistic regression for about 10+ years on regular basis, but
I’ve never used it for classification.
So by saying that it’s not a regression, people simply deny what thousands statisticians and
experimental researchers do every day at work. Not nice.
Curious learners should read these books
And many more on the next slide.
And NEITHER will tell you that „logistic regression is not a regression!”
Conditional expectation? But how?
Logistic regression
(Bernoulli)
E(Y|X=x1) g(E(Y|X=x1))
g(E(Y|X=x2))
g(E(Y|X=x3))
g(E(Y|X=x1))
g(E(Y|X=x2))
g(E(Y|X=x3))
E(Y|X=x2)
E(Y|X=x3)
Linear regression
(Gaussian)
Beta regression Gamma regression
Poisson regression Negative-binomial
regression
g(…) stands traditionally for the
„link” function in the GLM family,
used to transform the conditional
expectation to allow for the linear
relationship g(E(Y|X=x) = ΣXβ
- For linear regression it’s identity.
- For Poisson – logarithm.
- For logistic – logit
logit(E(Y|X=x1))
logit(E(Y|X=x2))
logit(E(Y|X=x3))
OK, so how is the logistic regression
related to the logistic classifier?
Training
data
Estimate
coefficients of the
logistic regression
Predict
probability
of success
E(Y|X=x)
„p”
New data
Apply decision rule
to „p" using a threshold
IF p > t THEN a ELSE b
Predicted
CLASS
Logistic Regression Logistic Classifier
ML people call it: „training a model”
The #ML world treats it as a whole…
Training
data
Estimate
coefficients of the
logistic regression
Predict
probability
of success
E(Y|X=x)
„p”
New data
Apply decision rule
for „p" using a threshold
IF p > t THEN a ELSE b
Predicted
CLASS
Logistic Regression
Logistic Classifier
ONLY IN #ML !
…to obtain „class” from „class” (binary from binary)
Binary input Binary output
Regression
Decision
rule
Logistic classifier, called by ML „logistic regression”
And then they have problems with justifying the existing name, so they try:
- „... Oh! This name is a „misnomer”
- „… Because equation XYZ has similar form to those in linear regression”
- „…Despite the name, it must be said that this is not a regression…”
Numerical output:
E(Y|X=x)
Such nomenclature does NOT HOLD elsewhere!
Training
data
Estimate
coefficients of the
logistic regression
Predict
probability
of success
E(Y|X=x)
„p”
New data
Apply decision rule
for „p" using a threshold
IF p > t THEN a ELSE b
Predicted
CLASS
Logistic Regression
Logistic Classifier
ML people call it: „training a model”
In the experimental research
the logistic regression
is used for REGRESSION and TESTING hypotheses
Logistic
Regression
Classifier
• Numerical outcome: g(E(Y|X=x))
• Gives the impact (direction + magnitude) of the predictor variables on the
response (marginal effect)
• Inference: about parameters & effects (main, simple, interaction,
marginal) - testing hypotheses & confidence intervals
• Prediction of the E(Y|X=x) for various purposes, (e.g. to implement the
inverse probability weighting (IPW), propensity matching, etc.)
• Categorical outcome: {A, B, …}
• Uses the prediction with a decision rule: IF prediction ≥ η THEN A else B
➡️ assessment of specific contrasts (simple effects): Tukey (all-pairwise), Dunnett (all-vs. control), selected, trends.
➡️ n-way comparisons across many categorical variables & their interactions.
➡️ the comparisons can be adjusted for numerical covariates.
➡️ followed by the LRT or Wald’s procedure we get AN(C)OVA („analysis of deviance”)
for the main (and interaction) effects.
➡️ marginal effects express the predictions in „%-points” rather than „odds ratios”
➡️ we can employ time-varying covariates and piecewise analysis.
➡️ the GEE estimation allows for population-average comparisons. Mixed-effect models allow for comparisons
conditional on subject (the two answer different questions and cannot be used interchangeably)
➡️ In presence of missing data, the Inverse Probability Weighting can be employed . The IPW also uses the LR ☺
A1
B
C
A1:B
1
We use it to analyze if & how certain variables affect
the % (or odds) of success of events & to test hypotheses
➡️ Assessment (= direction, magnitude, inference) of the impact of model predictors on the response expressed as: log-odds, odds-
ratios or probability (via predicted means or LS-means or marginal effects), which covers:
➡️ Assessment of the marginal effects of the model predictors for the GLM (non-identity link)
➡️ Inference on the main effects, exploration of interactions for categorical variables = AN[C]OVA
➡️ Inference on the simple effects of interest (via contrasts), both planned and ad hoc.
➡️ Testing for trends in proportions (linear/quadratic/cubic, etc)
➡️ Extending the classic statistical tests of proportions, odd-ratios and stochastic superiority (Wald's and Rao z test, chi2, Cochran-
Armitage, Breslow-Day, Cochran-Mantel-Haenszel, McNemar, Cochran Q, Friedman, Mann-Whitney (Wilcoxon)) for: multiple
variables and their interactions, numerical covariates;
➡️ Bonus: model-based approach allows one to employ advanced parametric adjustment for multiple comparisons via multivariate t
distribution, adjust numerical covariates, employ time-varying covariates, account for repeated and clustered observations and more!
➡️ Direct probability estimator used to implement the IPW - inverse probability weighting and propensity score matching algorithms
➡️ Assessment of the MCAR pattern of missing observations
More precisely speaking…
In the experimental research
the logistic regression
is used for REGRESSION and TESTING hypotheses
A few exemplary tasks, where the logistic regresison is routinely used:
➡️ comparison of the log-odds or the % of some clinical success between the treatments (at certain timepoints)
➡️ performing a non-inferiority, equivalence or superiority testing (→ employs clinical significance) at 2 selected
timepoints via appropriately defined confidence intervals of difference between %s (average marginal effect)
➡️ an assessment of the impact (magnitude, direction) of certain covariates on the clinical success and provide the
covariate-adjusted EM-means for their main effects, their interactions and finally their appropriate contrasts to
explore the nature of the (2 and 3-level) interactions.
➡️ analyzing the over-time within-arm trends of % of successes for the treatment persistence.
Study arm 1 Baseline numerical
covariates to adjust for
2% 15% 30% 60% 78%
Study arm 2 0% 12% 18% 20% 45%
Time Baseline (T0) T1 T2 T3 T4 ….
Pre-treatment Post-treatment
• All-pairwise comparisons (rather exploratory, not much useful if not supported by some clinical justification):
• Arm1 @ T1 vs. Arm1 @ T2
• Arm1 @ T1 vs. Arm1-…
• Arm1 @ T1 vs. Arm2 @ T1
• Arm1 @ T1 vs. Arm2 @ T2, …
• Between-treatment comparison (typical analysis in clinical trials; particular focus on selected timepoint(s) → primary objective)
• T1 @ Arm1 vs. T1 @ Arm2
• T2 @ Arm1 vs. T2 @ Arm2
• T3 @ Arm1 vs. T3 @ Arm2, …
• Within-treatment comparison (sometimes practiced, but much criticized as not a valid measure of clinical effect)
• Arm1: T1 vs. T2, T1 vs. T3, T1 vs. T…, T2 vs. T3, T2 vs. T…
• Arm2: T1 vs. T2, T1 vs. T3, T1 vs. T…, T2 vs. T3, T2 vs. T…
• Comparison of difference in trends (sometimes practiced, must be supported by valid clinical reasoning)
• Arm1 – Linear (Quadratic, …) vs. Arm2 – Linear (Quadratic, …)
Analyses of contrasts over a longitudinal model with a binary endpoint (SUCCESS/FAILURE)
Term Estimate SE p-value
Treatment xxx xxx p=0.0032
Time xxx xxx p=0.0001
Site xxx xxx p=0.98
Numerical_covar_1 xxx xxx p=0.101
Treatment*Time xxx xxx p=0.004
Treatment*Site xxx xxx p=0.87
….
Analyses of deviance = Type-2 or Type-3 ANOVA (or ANCOVA, when numerical covariates exist)
Success ~ Treatment * Time * Site * Numerical_covariate1 + Baseline_covariate_1 + …..
Analyses of interactions
(numeric vs. numeric, categorical vs. categorical, mixed)
T1 T2 T3 T4 T5 0 0.1 0.2 0.3 0.4 0.5 0.6 0.7 0.8 0.9
Comparing (nested) models – one per model term – via
sequence of Likelihood Ratio Tests (LRT)
Using Wald’s joint testing over appropriate model
coefficients (less precise but faster and always available)
Log-odds or % (probabilities) over time
Logistic Regression
Ordinal
Logistic Regression
Logistic Regression
via GEE & GLMM
Conditional
Logistic Regression
In general for
paired / dependent data
Paired testing via GEE
Testing hypotheses about binary outcomes
with the Logistic Regression & selected friends
https://github.com/adrianolszewski/Logistic-regression-is-
regression/blob/main/Testing%20hypotheses%20about%20proportions%20using%20logistic%20regression.md
There are so many members of the Logistic Regression family!
✅ Binary Logistic Regression = binomial regression with logit link, case of the Generalized Linear Model, modelling the % of successes.
✅ Multinomial Logistic Regression (MLR) = if we deal with a response consisting of multiple non-ordered classes (e.g. colours).
✅ Nested MLR - when the classes in MLR are related
✅ Ordinal LR (aka Proportional Odds Model) = if we deal with multiple ordered classes, like responses in questionnaires, called Likert
items, e.g. {bad, average, good}. The OLR is a generalization of the Mann-Whitney (-Wilcoxon) test, if you need a flexible non-parametric
test, that: a) handles multiple categorical variables, b) adjusts for numerical covariates (like ANCOVA)
✅ Generalized OLR = Partial Proportional Odds M. when the proportionality of odds doesn't hold.
✅ Alternating Logistic Regression = if we deal with correlated observations, e.g. when we analyse repeated or clustered data. We
have 3 alternatives: mixed-effect LR, LR fit via GEE (generalized estimating equations), or alternatively, the ALR. ALR models the
dependency between pairs of observations by using log odds ratios instead of correlations (like GEE). It handles ordinal responses.
✅ Fractional LR = if we deal with a bounded range. Typically used with [0-100] percentages rather than just [TRUE] and [FALSE]. More
flexible than beta reg., but not as powerful as the simplex reg. or 0-1-inflated beta r.
✅ Logistic Quantile Regression - application as above.
✅ Conditional LR = if we deal with stratification and matching groups of data, e.g. in observational studies without randomization, to
match subjects by some characteristics and create homogenous "baseline".
If you google for „logistic regression is not a regression”, or „…is a misnomer”
etc, you’ll see how serious the problem is! Below is a situation from my work,
years ago. I still cannot believe it actually happenend.
Logistic
regression is not
a regression XD
Statisticians
sir David Cox
(key inventor of the logistic regression)
Nelder, Wedderburn,
(inventors of the GLM)
Hastie, Tibshirani, J. Friedman
(inventors of the GAM)
Pharmaceutical industry
(key regression tool in drug approval)
Joseph Berkson
(contributor to the theory)
Daniel L. McFadden
(contributor & popularizer)
Other experimental researchers
Medicine, physics, sociology, econometrics, psyschology, ecology…
(using it this way on daily basis)
NO!
NO!
NO!
WHAT
My
goodness
…..
Look how
they
massacred
my boy!
…”but in their book, Hastie and Tibshirani put the logistic
regression in the »classification« chapter!!!”
Of course they did! It's a book about MACHINE LEARNING, so this kind of *application* is of interest ☺
BUT they’ve never said it's not a regression model. They both wrote also a series of articles on the application of the
proportional hazard models and the logistic regression in biostatistical (they worked in the division of biostatistics)
applications in the regression manner (assessment of the prognostic factors, assessment of the treatment effect) and
call it a regression model. Please look the screenshots on the next slide for examples.
In the book you mention, on page 121-122 + the following examples they say: "Logistic regression models are used
mostly as a data analysis and inference tool, where the goal is to understand the role of the input variables in
explaining the outcome. Typically many models are fit in a search for a parsimonious model involving a subset of the
variables, possibly with some interactions terms."
A piece of history, if you’re curious ☺
Prof. Hastie implemented the glm() in the S package at AT&T (nowadays it’s the GNU R) and both
invented the GAM, which extends the GLM.
Other authors of ML books acknowledge the true
regression nature of the logistic regression:
PS: don’t be tempted to say it’s just OLS with logit transform!
https://stats.stackexchange.com/questions/48485/what-is-the-difference-between-logit-transformed-linear-regression-logistic-reg
Logistic regression vs. logistic classifier. History of the confusion and the role of Logistic Regression in experimental research

More Related Content

What's hot

Unified Approach to Interpret Machine Learning Model: SHAP + LIME
Unified Approach to Interpret Machine Learning Model: SHAP + LIMEUnified Approach to Interpret Machine Learning Model: SHAP + LIME
Unified Approach to Interpret Machine Learning Model: SHAP + LIMEDatabricks
 
Feature Engineering
Feature Engineering Feature Engineering
Feature Engineering odsc
 
Ways to evaluate a machine learning model’s performance
Ways to evaluate a machine learning model’s performanceWays to evaluate a machine learning model’s performance
Ways to evaluate a machine learning model’s performanceMala Deep Upadhaya
 
CounterFactual Explanations.pdf
CounterFactual Explanations.pdfCounterFactual Explanations.pdf
CounterFactual Explanations.pdfBong-Ho Lee
 
Quantile Quantile Plot qq plot
Quantile Quantile Plot qq plot  Quantile Quantile Plot qq plot
Quantile Quantile Plot qq plot Saeed Siddik
 
Cross-validation Tutorial: What, how and which?
Cross-validation Tutorial: What, how and which?Cross-validation Tutorial: What, how and which?
Cross-validation Tutorial: What, how and which?Pradeep Redddy Raamana
 
Machine Learning and Causal Inference
Machine Learning and Causal InferenceMachine Learning and Causal Inference
Machine Learning and Causal InferenceNBER
 
Causal Inference Introduction.pdf
Causal Inference Introduction.pdfCausal Inference Introduction.pdf
Causal Inference Introduction.pdfYuna Koyama
 
Data Science - Part VI - Market Basket and Product Recommendation Engines
Data Science - Part VI - Market Basket and Product Recommendation EnginesData Science - Part VI - Market Basket and Product Recommendation Engines
Data Science - Part VI - Market Basket and Product Recommendation EnginesDerek Kane
 
Customer churn prediction for telecom data set.
Customer churn prediction for telecom data set.Customer churn prediction for telecom data set.
Customer churn prediction for telecom data set.Kuldeep Mahani
 
Causality without headaches
Causality without headachesCausality without headaches
Causality without headachesBenoît Rostykus
 
ANOVA in R by Aman Chauhan
ANOVA in R by Aman ChauhanANOVA in R by Aman Chauhan
ANOVA in R by Aman ChauhanAman Chauhan
 
Interpretable machine learning : Methods for understanding complex models
Interpretable machine learning : Methods for understanding complex modelsInterpretable machine learning : Methods for understanding complex models
Interpretable machine learning : Methods for understanding complex modelsManojit Nandi
 
Logistic regression (blyth 2006) (simplified)
Logistic regression (blyth 2006) (simplified)Logistic regression (blyth 2006) (simplified)
Logistic regression (blyth 2006) (simplified)MikeBlyth
 
Data mining approaches and methods
Data mining approaches and methodsData mining approaches and methods
Data mining approaches and methodssonangrai
 
Evolutionary Computing - Genetic Algorithms - An Introduction
Evolutionary Computing - Genetic Algorithms - An IntroductionEvolutionary Computing - Genetic Algorithms - An Introduction
Evolutionary Computing - Genetic Algorithms - An Introductionmartinp
 
Exploratory Factor Analysis
Exploratory Factor AnalysisExploratory Factor Analysis
Exploratory Factor AnalysisMark Ng
 
PCA (Principal component analysis)
PCA (Principal component analysis)PCA (Principal component analysis)
PCA (Principal component analysis)Learnbay Datascience
 
Introduction to principal component analysis (pca)
Introduction to principal component analysis (pca)Introduction to principal component analysis (pca)
Introduction to principal component analysis (pca)Mohammed Musah
 

What's hot (20)

Unified Approach to Interpret Machine Learning Model: SHAP + LIME
Unified Approach to Interpret Machine Learning Model: SHAP + LIMEUnified Approach to Interpret Machine Learning Model: SHAP + LIME
Unified Approach to Interpret Machine Learning Model: SHAP + LIME
 
Feature Engineering
Feature Engineering Feature Engineering
Feature Engineering
 
Ways to evaluate a machine learning model’s performance
Ways to evaluate a machine learning model’s performanceWays to evaluate a machine learning model’s performance
Ways to evaluate a machine learning model’s performance
 
CounterFactual Explanations.pdf
CounterFactual Explanations.pdfCounterFactual Explanations.pdf
CounterFactual Explanations.pdf
 
Quantile Quantile Plot qq plot
Quantile Quantile Plot qq plot  Quantile Quantile Plot qq plot
Quantile Quantile Plot qq plot
 
Cross-validation Tutorial: What, how and which?
Cross-validation Tutorial: What, how and which?Cross-validation Tutorial: What, how and which?
Cross-validation Tutorial: What, how and which?
 
Machine Learning and Causal Inference
Machine Learning and Causal InferenceMachine Learning and Causal Inference
Machine Learning and Causal Inference
 
probability.ppt
probability.pptprobability.ppt
probability.ppt
 
Causal Inference Introduction.pdf
Causal Inference Introduction.pdfCausal Inference Introduction.pdf
Causal Inference Introduction.pdf
 
Data Science - Part VI - Market Basket and Product Recommendation Engines
Data Science - Part VI - Market Basket and Product Recommendation EnginesData Science - Part VI - Market Basket and Product Recommendation Engines
Data Science - Part VI - Market Basket and Product Recommendation Engines
 
Customer churn prediction for telecom data set.
Customer churn prediction for telecom data set.Customer churn prediction for telecom data set.
Customer churn prediction for telecom data set.
 
Causality without headaches
Causality without headachesCausality without headaches
Causality without headaches
 
ANOVA in R by Aman Chauhan
ANOVA in R by Aman ChauhanANOVA in R by Aman Chauhan
ANOVA in R by Aman Chauhan
 
Interpretable machine learning : Methods for understanding complex models
Interpretable machine learning : Methods for understanding complex modelsInterpretable machine learning : Methods for understanding complex models
Interpretable machine learning : Methods for understanding complex models
 
Logistic regression (blyth 2006) (simplified)
Logistic regression (blyth 2006) (simplified)Logistic regression (blyth 2006) (simplified)
Logistic regression (blyth 2006) (simplified)
 
Data mining approaches and methods
Data mining approaches and methodsData mining approaches and methods
Data mining approaches and methods
 
Evolutionary Computing - Genetic Algorithms - An Introduction
Evolutionary Computing - Genetic Algorithms - An IntroductionEvolutionary Computing - Genetic Algorithms - An Introduction
Evolutionary Computing - Genetic Algorithms - An Introduction
 
Exploratory Factor Analysis
Exploratory Factor AnalysisExploratory Factor Analysis
Exploratory Factor Analysis
 
PCA (Principal component analysis)
PCA (Principal component analysis)PCA (Principal component analysis)
PCA (Principal component analysis)
 
Introduction to principal component analysis (pca)
Introduction to principal component analysis (pca)Introduction to principal component analysis (pca)
Introduction to principal component analysis (pca)
 

Similar to Logistic regression vs. logistic classifier. History of the confusion and the role of Logistic Regression in experimental research

Logistic regression - one of the key regression tools in experimental research
Logistic regression - one of the key regression tools in experimental researchLogistic regression - one of the key regression tools in experimental research
Logistic regression - one of the key regression tools in experimental researchAdrian Olszewski
 
Multinomial Logistic Regression.pdf
Multinomial Logistic Regression.pdfMultinomial Logistic Regression.pdf
Multinomial Logistic Regression.pdfAlemAyahu
 
7. logistics regression using spss
7. logistics regression using spss7. logistics regression using spss
7. logistics regression using spssDr Nisha Arora
 
3010l8.pdf
3010l8.pdf3010l8.pdf
3010l8.pdfdawitg2
 
Logistic regression with SPSS examples
Logistic regression with SPSS examplesLogistic regression with SPSS examples
Logistic regression with SPSS examplesGaurav Kamboj
 
Regression with Time Series Data
Regression with Time Series DataRegression with Time Series Data
Regression with Time Series DataRizano Ahdiat R
 
Linear Regression and Logistic Regression in ML
Linear Regression and Logistic Regression in MLLinear Regression and Logistic Regression in ML
Linear Regression and Logistic Regression in MLKumud Arora
 
Quantitative_analysis.ppt
Quantitative_analysis.pptQuantitative_analysis.ppt
Quantitative_analysis.pptmousaderhem1
 
Sct2013 boston,randomizationmetricsposter,d6.2
Sct2013 boston,randomizationmetricsposter,d6.2Sct2013 boston,randomizationmetricsposter,d6.2
Sct2013 boston,randomizationmetricsposter,d6.2Dennis Sweitzer
 
Introduction to correlation and regression analysis
Introduction to correlation and regression analysisIntroduction to correlation and regression analysis
Introduction to correlation and regression analysisFarzad Javidanrad
 
Logistic Regression in Case-Control Study
Logistic Regression in Case-Control StudyLogistic Regression in Case-Control Study
Logistic Regression in Case-Control StudySatish Gupta
 
correlation.pptx
correlation.pptxcorrelation.pptx
correlation.pptxSmHasiv
 
linear model multiple predictors.pdf
linear model multiple predictors.pdflinear model multiple predictors.pdf
linear model multiple predictors.pdfssuser7d5314
 
Week 5 Lecture 14 The Chi Square TestQuite often, patterns of .docx
Week 5 Lecture 14 The Chi Square TestQuite often, patterns of .docxWeek 5 Lecture 14 The Chi Square TestQuite often, patterns of .docx
Week 5 Lecture 14 The Chi Square TestQuite often, patterns of .docxcockekeshia
 

Similar to Logistic regression vs. logistic classifier. History of the confusion and the role of Logistic Regression in experimental research (20)

Logistic regression - one of the key regression tools in experimental research
Logistic regression - one of the key regression tools in experimental researchLogistic regression - one of the key regression tools in experimental research
Logistic regression - one of the key regression tools in experimental research
 
Multinomial Logistic Regression.pdf
Multinomial Logistic Regression.pdfMultinomial Logistic Regression.pdf
Multinomial Logistic Regression.pdf
 
7. logistics regression using spss
7. logistics regression using spss7. logistics regression using spss
7. logistics regression using spss
 
3010l8.pdf
3010l8.pdf3010l8.pdf
3010l8.pdf
 
Logistic regression with SPSS examples
Logistic regression with SPSS examplesLogistic regression with SPSS examples
Logistic regression with SPSS examples
 
Regression with Time Series Data
Regression with Time Series DataRegression with Time Series Data
Regression with Time Series Data
 
Linear Regression and Logistic Regression in ML
Linear Regression and Logistic Regression in MLLinear Regression and Logistic Regression in ML
Linear Regression and Logistic Regression in ML
 
Lecture 4
Lecture 4Lecture 4
Lecture 4
 
Quantitative_analysis.ppt
Quantitative_analysis.pptQuantitative_analysis.ppt
Quantitative_analysis.ppt
 
Sct2013 boston,randomizationmetricsposter,d6.2
Sct2013 boston,randomizationmetricsposter,d6.2Sct2013 boston,randomizationmetricsposter,d6.2
Sct2013 boston,randomizationmetricsposter,d6.2
 
Introduction to correlation and regression analysis
Introduction to correlation and regression analysisIntroduction to correlation and regression analysis
Introduction to correlation and regression analysis
 
Logistic Regression in Case-Control Study
Logistic Regression in Case-Control StudyLogistic Regression in Case-Control Study
Logistic Regression in Case-Control Study
 
Cost indexes
Cost indexesCost indexes
Cost indexes
 
correlation.pptx
correlation.pptxcorrelation.pptx
correlation.pptx
 
Program on Mathematical and Statistical Methods for Climate and the Earth Sys...
Program on Mathematical and Statistical Methods for Climate and the Earth Sys...Program on Mathematical and Statistical Methods for Climate and the Earth Sys...
Program on Mathematical and Statistical Methods for Climate and the Earth Sys...
 
linear model multiple predictors.pdf
linear model multiple predictors.pdflinear model multiple predictors.pdf
linear model multiple predictors.pdf
 
Medical statistics2
Medical statistics2Medical statistics2
Medical statistics2
 
Discriminant analysis.pptx
Discriminant analysis.pptxDiscriminant analysis.pptx
Discriminant analysis.pptx
 
Week 5 Lecture 14 The Chi Square TestQuite often, patterns of .docx
Week 5 Lecture 14 The Chi Square TestQuite often, patterns of .docxWeek 5 Lecture 14 The Chi Square TestQuite often, patterns of .docx
Week 5 Lecture 14 The Chi Square TestQuite often, patterns of .docx
 
chapter15c.ppt
chapter15c.pptchapter15c.ppt
chapter15c.ppt
 

More from Adrian Olszewski

Meet a 100% R-based CRO - The summary of a 5-year journey
Meet a 100% R-based CRO - The summary of a 5-year journeyMeet a 100% R-based CRO - The summary of a 5-year journey
Meet a 100% R-based CRO - The summary of a 5-year journeyAdrian Olszewski
 
Why are data transformations a bad choice in statistics
Why are data transformations a bad choice in statisticsWhy are data transformations a bad choice in statistics
Why are data transformations a bad choice in statisticsAdrian Olszewski
 
Modern statistical techniques
Modern statistical techniquesModern statistical techniques
Modern statistical techniquesAdrian Olszewski
 
Dealing with outliers in Clinical Research
Dealing with outliers in Clinical ResearchDealing with outliers in Clinical Research
Dealing with outliers in Clinical ResearchAdrian Olszewski
 
The use of R statistical package in controlled infrastructure. The case of Cl...
The use of R statistical package in controlled infrastructure. The case of Cl...The use of R statistical package in controlled infrastructure. The case of Cl...
The use of R statistical package in controlled infrastructure. The case of Cl...Adrian Olszewski
 
Rcommander - a menu-driven GUI for R
Rcommander - a menu-driven GUI for RRcommander - a menu-driven GUI for R
Rcommander - a menu-driven GUI for RAdrian Olszewski
 
GNU R in Clinical Research and Evidence-Based Medicine
GNU R in Clinical Research and Evidence-Based MedicineGNU R in Clinical Research and Evidence-Based Medicine
GNU R in Clinical Research and Evidence-Based MedicineAdrian Olszewski
 

More from Adrian Olszewski (8)

Meet a 100% R-based CRO - The summary of a 5-year journey
Meet a 100% R-based CRO - The summary of a 5-year journeyMeet a 100% R-based CRO - The summary of a 5-year journey
Meet a 100% R-based CRO - The summary of a 5-year journey
 
Flextable and Officer
Flextable and OfficerFlextable and Officer
Flextable and Officer
 
Why are data transformations a bad choice in statistics
Why are data transformations a bad choice in statisticsWhy are data transformations a bad choice in statistics
Why are data transformations a bad choice in statistics
 
Modern statistical techniques
Modern statistical techniquesModern statistical techniques
Modern statistical techniques
 
Dealing with outliers in Clinical Research
Dealing with outliers in Clinical ResearchDealing with outliers in Clinical Research
Dealing with outliers in Clinical Research
 
The use of R statistical package in controlled infrastructure. The case of Cl...
The use of R statistical package in controlled infrastructure. The case of Cl...The use of R statistical package in controlled infrastructure. The case of Cl...
The use of R statistical package in controlled infrastructure. The case of Cl...
 
Rcommander - a menu-driven GUI for R
Rcommander - a menu-driven GUI for RRcommander - a menu-driven GUI for R
Rcommander - a menu-driven GUI for R
 
GNU R in Clinical Research and Evidence-Based Medicine
GNU R in Clinical Research and Evidence-Based MedicineGNU R in Clinical Research and Evidence-Based Medicine
GNU R in Clinical Research and Evidence-Based Medicine
 

Recently uploaded

microwave assisted reaction. General introduction
microwave assisted reaction. General introductionmicrowave assisted reaction. General introduction
microwave assisted reaction. General introductionMaksud Ahmed
 
“Oh GOSH! Reflecting on Hackteria's Collaborative Practices in a Global Do-It...
“Oh GOSH! Reflecting on Hackteria's Collaborative Practices in a Global Do-It...“Oh GOSH! Reflecting on Hackteria's Collaborative Practices in a Global Do-It...
“Oh GOSH! Reflecting on Hackteria's Collaborative Practices in a Global Do-It...Marc Dusseiller Dusjagr
 
Mastering the Unannounced Regulatory Inspection
Mastering the Unannounced Regulatory InspectionMastering the Unannounced Regulatory Inspection
Mastering the Unannounced Regulatory InspectionSafetyChain Software
 
Solving Puzzles Benefits Everyone (English).pptx
Solving Puzzles Benefits Everyone (English).pptxSolving Puzzles Benefits Everyone (English).pptx
Solving Puzzles Benefits Everyone (English).pptxOH TEIK BIN
 
Science 7 - LAND and SEA BREEZE and its Characteristics
Science 7 - LAND and SEA BREEZE and its CharacteristicsScience 7 - LAND and SEA BREEZE and its Characteristics
Science 7 - LAND and SEA BREEZE and its CharacteristicsKarinaGenton
 
Contemporary philippine arts from the regions_PPT_Module_12 [Autosaved] (1).pptx
Contemporary philippine arts from the regions_PPT_Module_12 [Autosaved] (1).pptxContemporary philippine arts from the regions_PPT_Module_12 [Autosaved] (1).pptx
Contemporary philippine arts from the regions_PPT_Module_12 [Autosaved] (1).pptxRoyAbrique
 
CARE OF CHILD IN INCUBATOR..........pptx
CARE OF CHILD IN INCUBATOR..........pptxCARE OF CHILD IN INCUBATOR..........pptx
CARE OF CHILD IN INCUBATOR..........pptxGaneshChakor2
 
Grant Readiness 101 TechSoup and Remy Consulting
Grant Readiness 101 TechSoup and Remy ConsultingGrant Readiness 101 TechSoup and Remy Consulting
Grant Readiness 101 TechSoup and Remy ConsultingTechSoup
 
Q4-W6-Restating Informational Text Grade 3
Q4-W6-Restating Informational Text Grade 3Q4-W6-Restating Informational Text Grade 3
Q4-W6-Restating Informational Text Grade 3JemimahLaneBuaron
 
Accessible design: Minimum effort, maximum impact
Accessible design: Minimum effort, maximum impactAccessible design: Minimum effort, maximum impact
Accessible design: Minimum effort, maximum impactdawncurless
 
How to Make a Pirate ship Primary Education.pptx
How to Make a Pirate ship Primary Education.pptxHow to Make a Pirate ship Primary Education.pptx
How to Make a Pirate ship Primary Education.pptxmanuelaromero2013
 
Measures of Central Tendency: Mean, Median and Mode
Measures of Central Tendency: Mean, Median and ModeMeasures of Central Tendency: Mean, Median and Mode
Measures of Central Tendency: Mean, Median and ModeThiyagu K
 
A Critique of the Proposed National Education Policy Reform
A Critique of the Proposed National Education Policy ReformA Critique of the Proposed National Education Policy Reform
A Critique of the Proposed National Education Policy ReformChameera Dedduwage
 
Paris 2024 Olympic Geographies - an activity
Paris 2024 Olympic Geographies - an activityParis 2024 Olympic Geographies - an activity
Paris 2024 Olympic Geographies - an activityGeoBlogs
 
MENTAL STATUS EXAMINATION format.docx
MENTAL     STATUS EXAMINATION format.docxMENTAL     STATUS EXAMINATION format.docx
MENTAL STATUS EXAMINATION format.docxPoojaSen20
 
The Most Excellent Way | 1 Corinthians 13
The Most Excellent Way | 1 Corinthians 13The Most Excellent Way | 1 Corinthians 13
The Most Excellent Way | 1 Corinthians 13Steve Thomason
 
18-04-UA_REPORT_MEDIALITERAСY_INDEX-DM_23-1-final-eng.pdf
18-04-UA_REPORT_MEDIALITERAСY_INDEX-DM_23-1-final-eng.pdf18-04-UA_REPORT_MEDIALITERAСY_INDEX-DM_23-1-final-eng.pdf
18-04-UA_REPORT_MEDIALITERAСY_INDEX-DM_23-1-final-eng.pdfssuser54595a
 
PSYCHIATRIC History collection FORMAT.pptx
PSYCHIATRIC   History collection FORMAT.pptxPSYCHIATRIC   History collection FORMAT.pptx
PSYCHIATRIC History collection FORMAT.pptxPoojaSen20
 

Recently uploaded (20)

Código Creativo y Arte de Software | Unidad 1
Código Creativo y Arte de Software | Unidad 1Código Creativo y Arte de Software | Unidad 1
Código Creativo y Arte de Software | Unidad 1
 
Staff of Color (SOC) Retention Efforts DDSD
Staff of Color (SOC) Retention Efforts DDSDStaff of Color (SOC) Retention Efforts DDSD
Staff of Color (SOC) Retention Efforts DDSD
 
microwave assisted reaction. General introduction
microwave assisted reaction. General introductionmicrowave assisted reaction. General introduction
microwave assisted reaction. General introduction
 
“Oh GOSH! Reflecting on Hackteria's Collaborative Practices in a Global Do-It...
“Oh GOSH! Reflecting on Hackteria's Collaborative Practices in a Global Do-It...“Oh GOSH! Reflecting on Hackteria's Collaborative Practices in a Global Do-It...
“Oh GOSH! Reflecting on Hackteria's Collaborative Practices in a Global Do-It...
 
Mastering the Unannounced Regulatory Inspection
Mastering the Unannounced Regulatory InspectionMastering the Unannounced Regulatory Inspection
Mastering the Unannounced Regulatory Inspection
 
Solving Puzzles Benefits Everyone (English).pptx
Solving Puzzles Benefits Everyone (English).pptxSolving Puzzles Benefits Everyone (English).pptx
Solving Puzzles Benefits Everyone (English).pptx
 
Science 7 - LAND and SEA BREEZE and its Characteristics
Science 7 - LAND and SEA BREEZE and its CharacteristicsScience 7 - LAND and SEA BREEZE and its Characteristics
Science 7 - LAND and SEA BREEZE and its Characteristics
 
Contemporary philippine arts from the regions_PPT_Module_12 [Autosaved] (1).pptx
Contemporary philippine arts from the regions_PPT_Module_12 [Autosaved] (1).pptxContemporary philippine arts from the regions_PPT_Module_12 [Autosaved] (1).pptx
Contemporary philippine arts from the regions_PPT_Module_12 [Autosaved] (1).pptx
 
CARE OF CHILD IN INCUBATOR..........pptx
CARE OF CHILD IN INCUBATOR..........pptxCARE OF CHILD IN INCUBATOR..........pptx
CARE OF CHILD IN INCUBATOR..........pptx
 
Grant Readiness 101 TechSoup and Remy Consulting
Grant Readiness 101 TechSoup and Remy ConsultingGrant Readiness 101 TechSoup and Remy Consulting
Grant Readiness 101 TechSoup and Remy Consulting
 
Q4-W6-Restating Informational Text Grade 3
Q4-W6-Restating Informational Text Grade 3Q4-W6-Restating Informational Text Grade 3
Q4-W6-Restating Informational Text Grade 3
 
Accessible design: Minimum effort, maximum impact
Accessible design: Minimum effort, maximum impactAccessible design: Minimum effort, maximum impact
Accessible design: Minimum effort, maximum impact
 
How to Make a Pirate ship Primary Education.pptx
How to Make a Pirate ship Primary Education.pptxHow to Make a Pirate ship Primary Education.pptx
How to Make a Pirate ship Primary Education.pptx
 
Measures of Central Tendency: Mean, Median and Mode
Measures of Central Tendency: Mean, Median and ModeMeasures of Central Tendency: Mean, Median and Mode
Measures of Central Tendency: Mean, Median and Mode
 
A Critique of the Proposed National Education Policy Reform
A Critique of the Proposed National Education Policy ReformA Critique of the Proposed National Education Policy Reform
A Critique of the Proposed National Education Policy Reform
 
Paris 2024 Olympic Geographies - an activity
Paris 2024 Olympic Geographies - an activityParis 2024 Olympic Geographies - an activity
Paris 2024 Olympic Geographies - an activity
 
MENTAL STATUS EXAMINATION format.docx
MENTAL     STATUS EXAMINATION format.docxMENTAL     STATUS EXAMINATION format.docx
MENTAL STATUS EXAMINATION format.docx
 
The Most Excellent Way | 1 Corinthians 13
The Most Excellent Way | 1 Corinthians 13The Most Excellent Way | 1 Corinthians 13
The Most Excellent Way | 1 Corinthians 13
 
18-04-UA_REPORT_MEDIALITERAСY_INDEX-DM_23-1-final-eng.pdf
18-04-UA_REPORT_MEDIALITERAСY_INDEX-DM_23-1-final-eng.pdf18-04-UA_REPORT_MEDIALITERAСY_INDEX-DM_23-1-final-eng.pdf
18-04-UA_REPORT_MEDIALITERAСY_INDEX-DM_23-1-final-eng.pdf
 
PSYCHIATRIC History collection FORMAT.pptx
PSYCHIATRIC   History collection FORMAT.pptxPSYCHIATRIC   History collection FORMAT.pptx
PSYCHIATRIC History collection FORMAT.pptx
 

Logistic regression vs. logistic classifier. History of the confusion and the role of Logistic Regression in experimental research

  • 1. Logistic Regression vs. Logistic Classifier Is logistic regression a regression !? ALWAYS has been… Adrian Olszewski; XII 2023
  • 2. Statistically speaking, logistic regression is no different than other regressions in what it actually does
  • 5. …but one day… Instead of using a proper name: „logistic classifier” (which gives categorical output), some people from the #ML world have decided to completely replace well-known terms: → they left the „regression” for the classifier and announced that „LR is not a regression” In my work, I’ve been using the logistic regression for about 10+ years on regular basis, but I’ve never used it for classification. So by saying that it’s not a regression, people simply deny what thousands statisticians and experimental researchers do every day at work. Not nice.
  • 6. Curious learners should read these books And many more on the next slide. And NEITHER will tell you that „logistic regression is not a regression!”
  • 7.
  • 8. Conditional expectation? But how? Logistic regression (Bernoulli) E(Y|X=x1) g(E(Y|X=x1)) g(E(Y|X=x2)) g(E(Y|X=x3)) g(E(Y|X=x1)) g(E(Y|X=x2)) g(E(Y|X=x3)) E(Y|X=x2) E(Y|X=x3) Linear regression (Gaussian) Beta regression Gamma regression Poisson regression Negative-binomial regression g(…) stands traditionally for the „link” function in the GLM family, used to transform the conditional expectation to allow for the linear relationship g(E(Y|X=x) = ΣXβ - For linear regression it’s identity. - For Poisson – logarithm. - For logistic – logit logit(E(Y|X=x1)) logit(E(Y|X=x2)) logit(E(Y|X=x3))
  • 9. OK, so how is the logistic regression related to the logistic classifier? Training data Estimate coefficients of the logistic regression Predict probability of success E(Y|X=x) „p” New data Apply decision rule to „p" using a threshold IF p > t THEN a ELSE b Predicted CLASS Logistic Regression Logistic Classifier ML people call it: „training a model”
  • 10. The #ML world treats it as a whole… Training data Estimate coefficients of the logistic regression Predict probability of success E(Y|X=x) „p” New data Apply decision rule for „p" using a threshold IF p > t THEN a ELSE b Predicted CLASS Logistic Regression Logistic Classifier ONLY IN #ML !
  • 11. …to obtain „class” from „class” (binary from binary) Binary input Binary output Regression Decision rule Logistic classifier, called by ML „logistic regression” And then they have problems with justifying the existing name, so they try: - „... Oh! This name is a „misnomer” - „… Because equation XYZ has similar form to those in linear regression” - „…Despite the name, it must be said that this is not a regression…” Numerical output: E(Y|X=x)
  • 12. Such nomenclature does NOT HOLD elsewhere! Training data Estimate coefficients of the logistic regression Predict probability of success E(Y|X=x) „p” New data Apply decision rule for „p" using a threshold IF p > t THEN a ELSE b Predicted CLASS Logistic Regression Logistic Classifier ML people call it: „training a model”
  • 13. In the experimental research the logistic regression is used for REGRESSION and TESTING hypotheses Logistic Regression Classifier • Numerical outcome: g(E(Y|X=x)) • Gives the impact (direction + magnitude) of the predictor variables on the response (marginal effect) • Inference: about parameters & effects (main, simple, interaction, marginal) - testing hypotheses & confidence intervals • Prediction of the E(Y|X=x) for various purposes, (e.g. to implement the inverse probability weighting (IPW), propensity matching, etc.) • Categorical outcome: {A, B, …} • Uses the prediction with a decision rule: IF prediction ≥ η THEN A else B
  • 14. ➡️ assessment of specific contrasts (simple effects): Tukey (all-pairwise), Dunnett (all-vs. control), selected, trends. ➡️ n-way comparisons across many categorical variables & their interactions. ➡️ the comparisons can be adjusted for numerical covariates. ➡️ followed by the LRT or Wald’s procedure we get AN(C)OVA („analysis of deviance”) for the main (and interaction) effects. ➡️ marginal effects express the predictions in „%-points” rather than „odds ratios” ➡️ we can employ time-varying covariates and piecewise analysis. ➡️ the GEE estimation allows for population-average comparisons. Mixed-effect models allow for comparisons conditional on subject (the two answer different questions and cannot be used interchangeably) ➡️ In presence of missing data, the Inverse Probability Weighting can be employed . The IPW also uses the LR ☺ A1 B C A1:B 1 We use it to analyze if & how certain variables affect the % (or odds) of success of events & to test hypotheses
  • 15. ➡️ Assessment (= direction, magnitude, inference) of the impact of model predictors on the response expressed as: log-odds, odds- ratios or probability (via predicted means or LS-means or marginal effects), which covers: ➡️ Assessment of the marginal effects of the model predictors for the GLM (non-identity link) ➡️ Inference on the main effects, exploration of interactions for categorical variables = AN[C]OVA ➡️ Inference on the simple effects of interest (via contrasts), both planned and ad hoc. ➡️ Testing for trends in proportions (linear/quadratic/cubic, etc) ➡️ Extending the classic statistical tests of proportions, odd-ratios and stochastic superiority (Wald's and Rao z test, chi2, Cochran- Armitage, Breslow-Day, Cochran-Mantel-Haenszel, McNemar, Cochran Q, Friedman, Mann-Whitney (Wilcoxon)) for: multiple variables and their interactions, numerical covariates; ➡️ Bonus: model-based approach allows one to employ advanced parametric adjustment for multiple comparisons via multivariate t distribution, adjust numerical covariates, employ time-varying covariates, account for repeated and clustered observations and more! ➡️ Direct probability estimator used to implement the IPW - inverse probability weighting and propensity score matching algorithms ➡️ Assessment of the MCAR pattern of missing observations More precisely speaking…
  • 16. In the experimental research the logistic regression is used for REGRESSION and TESTING hypotheses A few exemplary tasks, where the logistic regresison is routinely used: ➡️ comparison of the log-odds or the % of some clinical success between the treatments (at certain timepoints) ➡️ performing a non-inferiority, equivalence or superiority testing (→ employs clinical significance) at 2 selected timepoints via appropriately defined confidence intervals of difference between %s (average marginal effect) ➡️ an assessment of the impact (magnitude, direction) of certain covariates on the clinical success and provide the covariate-adjusted EM-means for their main effects, their interactions and finally their appropriate contrasts to explore the nature of the (2 and 3-level) interactions. ➡️ analyzing the over-time within-arm trends of % of successes for the treatment persistence.
  • 17. Study arm 1 Baseline numerical covariates to adjust for 2% 15% 30% 60% 78% Study arm 2 0% 12% 18% 20% 45% Time Baseline (T0) T1 T2 T3 T4 …. Pre-treatment Post-treatment • All-pairwise comparisons (rather exploratory, not much useful if not supported by some clinical justification): • Arm1 @ T1 vs. Arm1 @ T2 • Arm1 @ T1 vs. Arm1-… • Arm1 @ T1 vs. Arm2 @ T1 • Arm1 @ T1 vs. Arm2 @ T2, … • Between-treatment comparison (typical analysis in clinical trials; particular focus on selected timepoint(s) → primary objective) • T1 @ Arm1 vs. T1 @ Arm2 • T2 @ Arm1 vs. T2 @ Arm2 • T3 @ Arm1 vs. T3 @ Arm2, … • Within-treatment comparison (sometimes practiced, but much criticized as not a valid measure of clinical effect) • Arm1: T1 vs. T2, T1 vs. T3, T1 vs. T…, T2 vs. T3, T2 vs. T… • Arm2: T1 vs. T2, T1 vs. T3, T1 vs. T…, T2 vs. T3, T2 vs. T… • Comparison of difference in trends (sometimes practiced, must be supported by valid clinical reasoning) • Arm1 – Linear (Quadratic, …) vs. Arm2 – Linear (Quadratic, …) Analyses of contrasts over a longitudinal model with a binary endpoint (SUCCESS/FAILURE)
  • 18. Term Estimate SE p-value Treatment xxx xxx p=0.0032 Time xxx xxx p=0.0001 Site xxx xxx p=0.98 Numerical_covar_1 xxx xxx p=0.101 Treatment*Time xxx xxx p=0.004 Treatment*Site xxx xxx p=0.87 …. Analyses of deviance = Type-2 or Type-3 ANOVA (or ANCOVA, when numerical covariates exist) Success ~ Treatment * Time * Site * Numerical_covariate1 + Baseline_covariate_1 + ….. Analyses of interactions (numeric vs. numeric, categorical vs. categorical, mixed) T1 T2 T3 T4 T5 0 0.1 0.2 0.3 0.4 0.5 0.6 0.7 0.8 0.9 Comparing (nested) models – one per model term – via sequence of Likelihood Ratio Tests (LRT) Using Wald’s joint testing over appropriate model coefficients (less precise but faster and always available) Log-odds or % (probabilities) over time
  • 19. Logistic Regression Ordinal Logistic Regression Logistic Regression via GEE & GLMM Conditional Logistic Regression In general for paired / dependent data Paired testing via GEE Testing hypotheses about binary outcomes with the Logistic Regression & selected friends
  • 21. There are so many members of the Logistic Regression family! ✅ Binary Logistic Regression = binomial regression with logit link, case of the Generalized Linear Model, modelling the % of successes. ✅ Multinomial Logistic Regression (MLR) = if we deal with a response consisting of multiple non-ordered classes (e.g. colours). ✅ Nested MLR - when the classes in MLR are related ✅ Ordinal LR (aka Proportional Odds Model) = if we deal with multiple ordered classes, like responses in questionnaires, called Likert items, e.g. {bad, average, good}. The OLR is a generalization of the Mann-Whitney (-Wilcoxon) test, if you need a flexible non-parametric test, that: a) handles multiple categorical variables, b) adjusts for numerical covariates (like ANCOVA) ✅ Generalized OLR = Partial Proportional Odds M. when the proportionality of odds doesn't hold. ✅ Alternating Logistic Regression = if we deal with correlated observations, e.g. when we analyse repeated or clustered data. We have 3 alternatives: mixed-effect LR, LR fit via GEE (generalized estimating equations), or alternatively, the ALR. ALR models the dependency between pairs of observations by using log odds ratios instead of correlations (like GEE). It handles ordinal responses. ✅ Fractional LR = if we deal with a bounded range. Typically used with [0-100] percentages rather than just [TRUE] and [FALSE]. More flexible than beta reg., but not as powerful as the simplex reg. or 0-1-inflated beta r. ✅ Logistic Quantile Regression - application as above. ✅ Conditional LR = if we deal with stratification and matching groups of data, e.g. in observational studies without randomization, to match subjects by some characteristics and create homogenous "baseline".
  • 22. If you google for „logistic regression is not a regression”, or „…is a misnomer” etc, you’ll see how serious the problem is! Below is a situation from my work, years ago. I still cannot believe it actually happenend.
  • 23. Logistic regression is not a regression XD Statisticians sir David Cox (key inventor of the logistic regression) Nelder, Wedderburn, (inventors of the GLM) Hastie, Tibshirani, J. Friedman (inventors of the GAM) Pharmaceutical industry (key regression tool in drug approval) Joseph Berkson (contributor to the theory) Daniel L. McFadden (contributor & popularizer) Other experimental researchers Medicine, physics, sociology, econometrics, psyschology, ecology… (using it this way on daily basis) NO! NO! NO! WHAT My goodness ….. Look how they massacred my boy!
  • 24. …”but in their book, Hastie and Tibshirani put the logistic regression in the »classification« chapter!!!” Of course they did! It's a book about MACHINE LEARNING, so this kind of *application* is of interest ☺ BUT they’ve never said it's not a regression model. They both wrote also a series of articles on the application of the proportional hazard models and the logistic regression in biostatistical (they worked in the division of biostatistics) applications in the regression manner (assessment of the prognostic factors, assessment of the treatment effect) and call it a regression model. Please look the screenshots on the next slide for examples. In the book you mention, on page 121-122 + the following examples they say: "Logistic regression models are used mostly as a data analysis and inference tool, where the goal is to understand the role of the input variables in explaining the outcome. Typically many models are fit in a search for a parsimonious model involving a subset of the variables, possibly with some interactions terms."
  • 25.
  • 26. A piece of history, if you’re curious ☺ Prof. Hastie implemented the glm() in the S package at AT&T (nowadays it’s the GNU R) and both invented the GAM, which extends the GLM.
  • 27. Other authors of ML books acknowledge the true regression nature of the logistic regression:
  • 28. PS: don’t be tempted to say it’s just OLS with logit transform! https://stats.stackexchange.com/questions/48485/what-is-the-difference-between-logit-transformed-linear-regression-logistic-reg