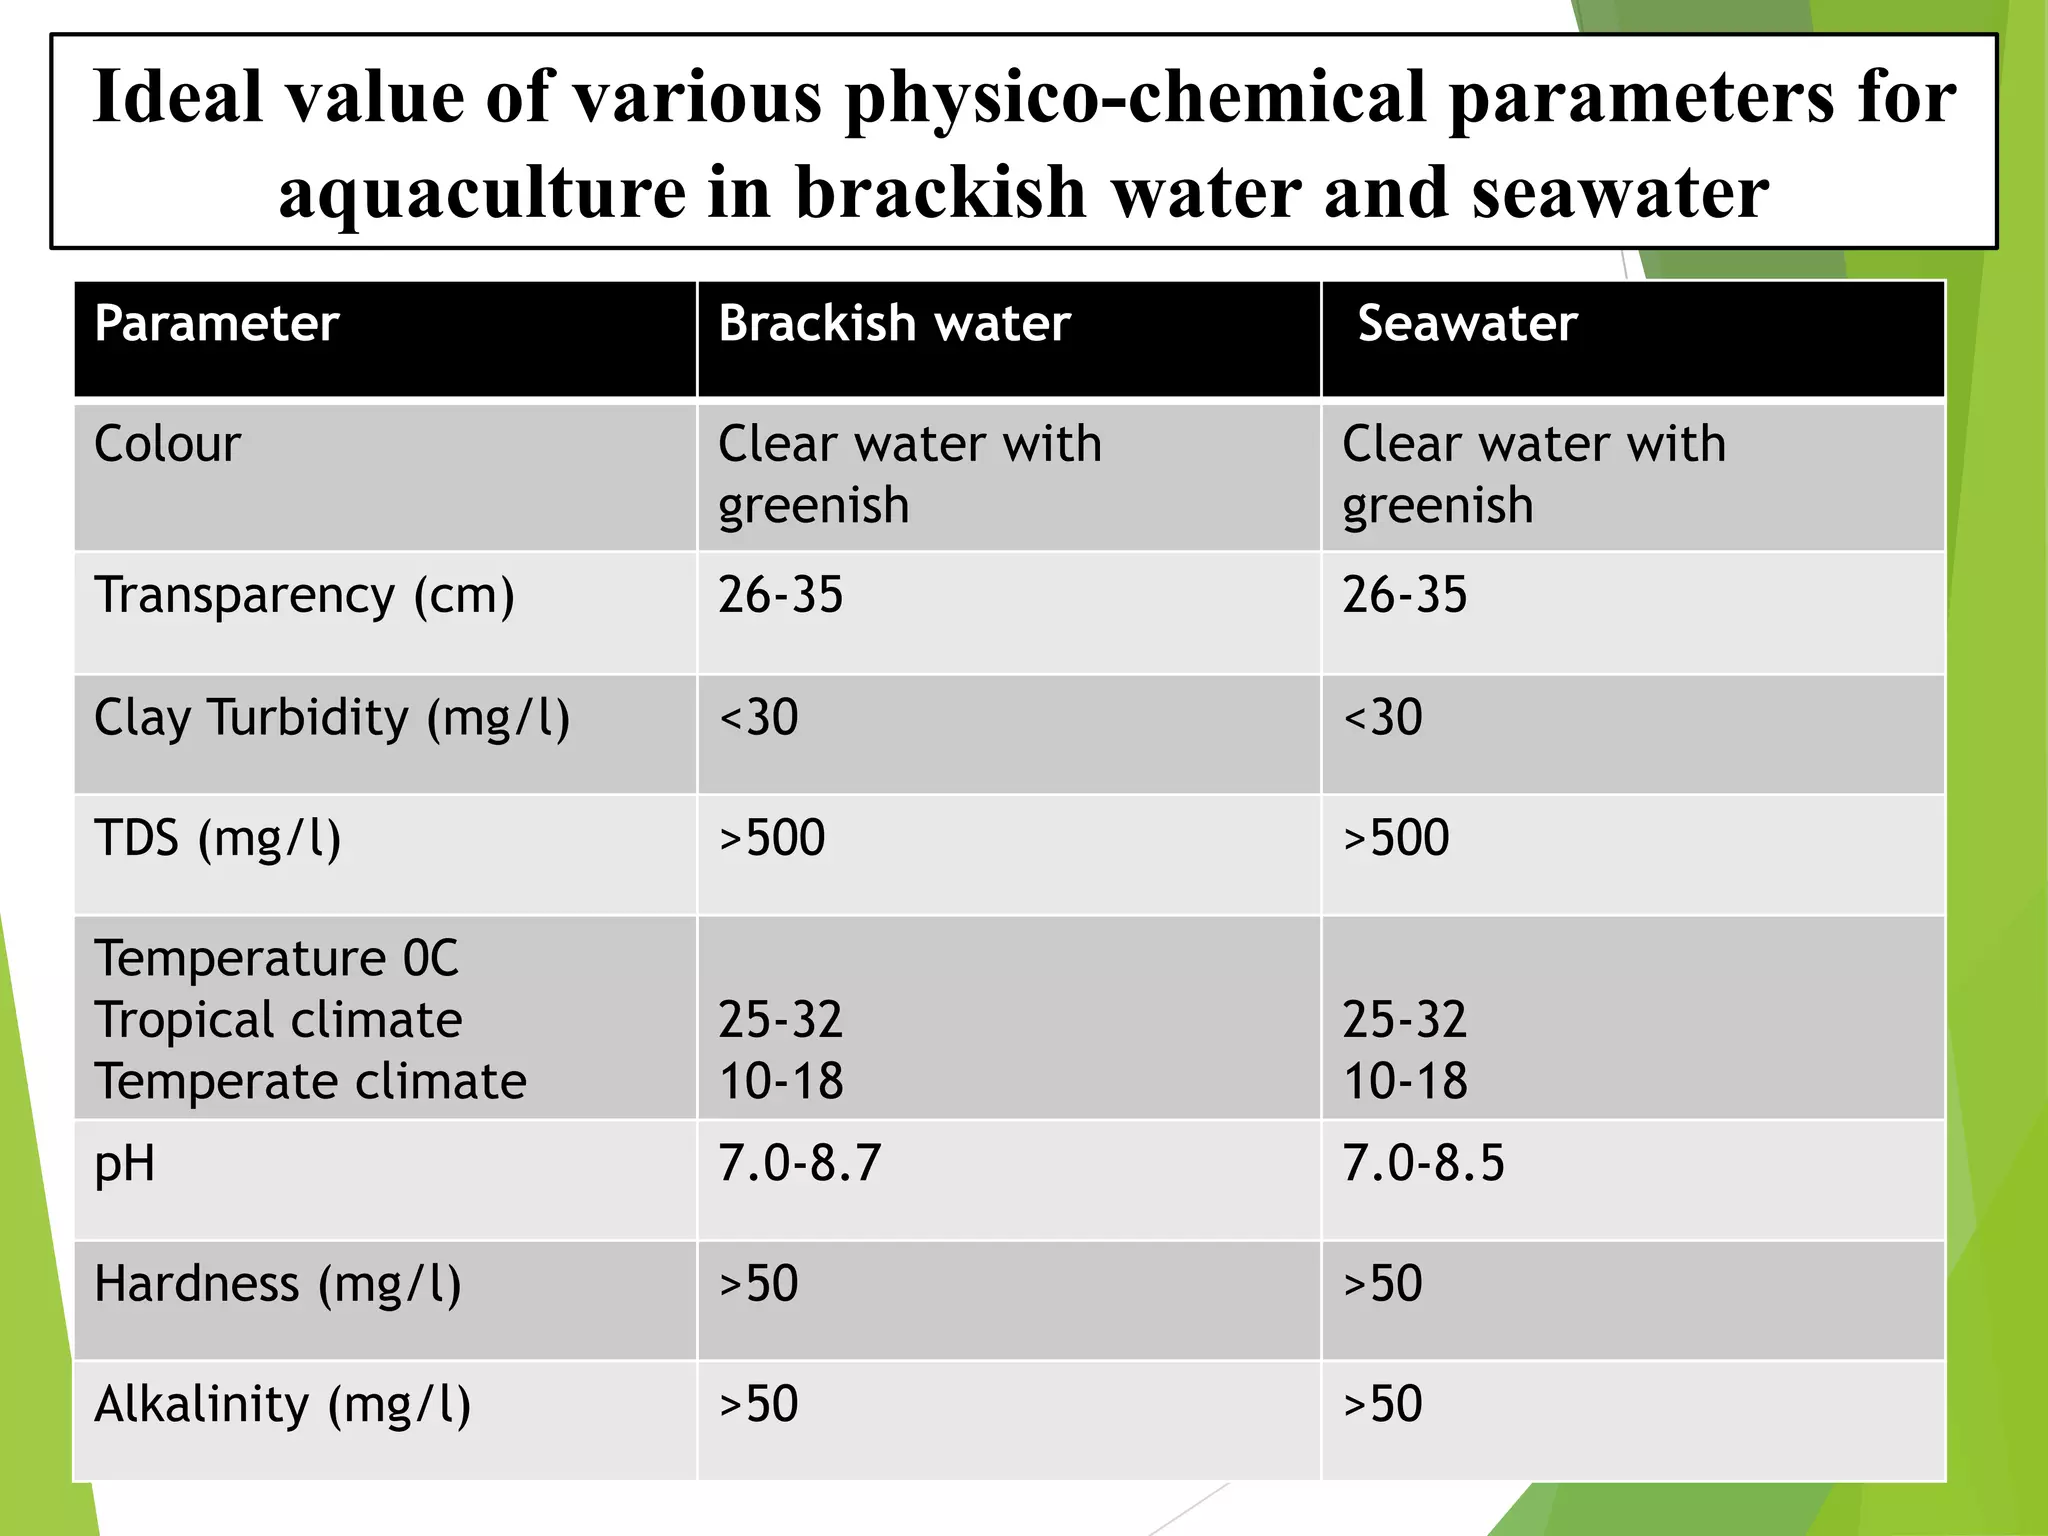
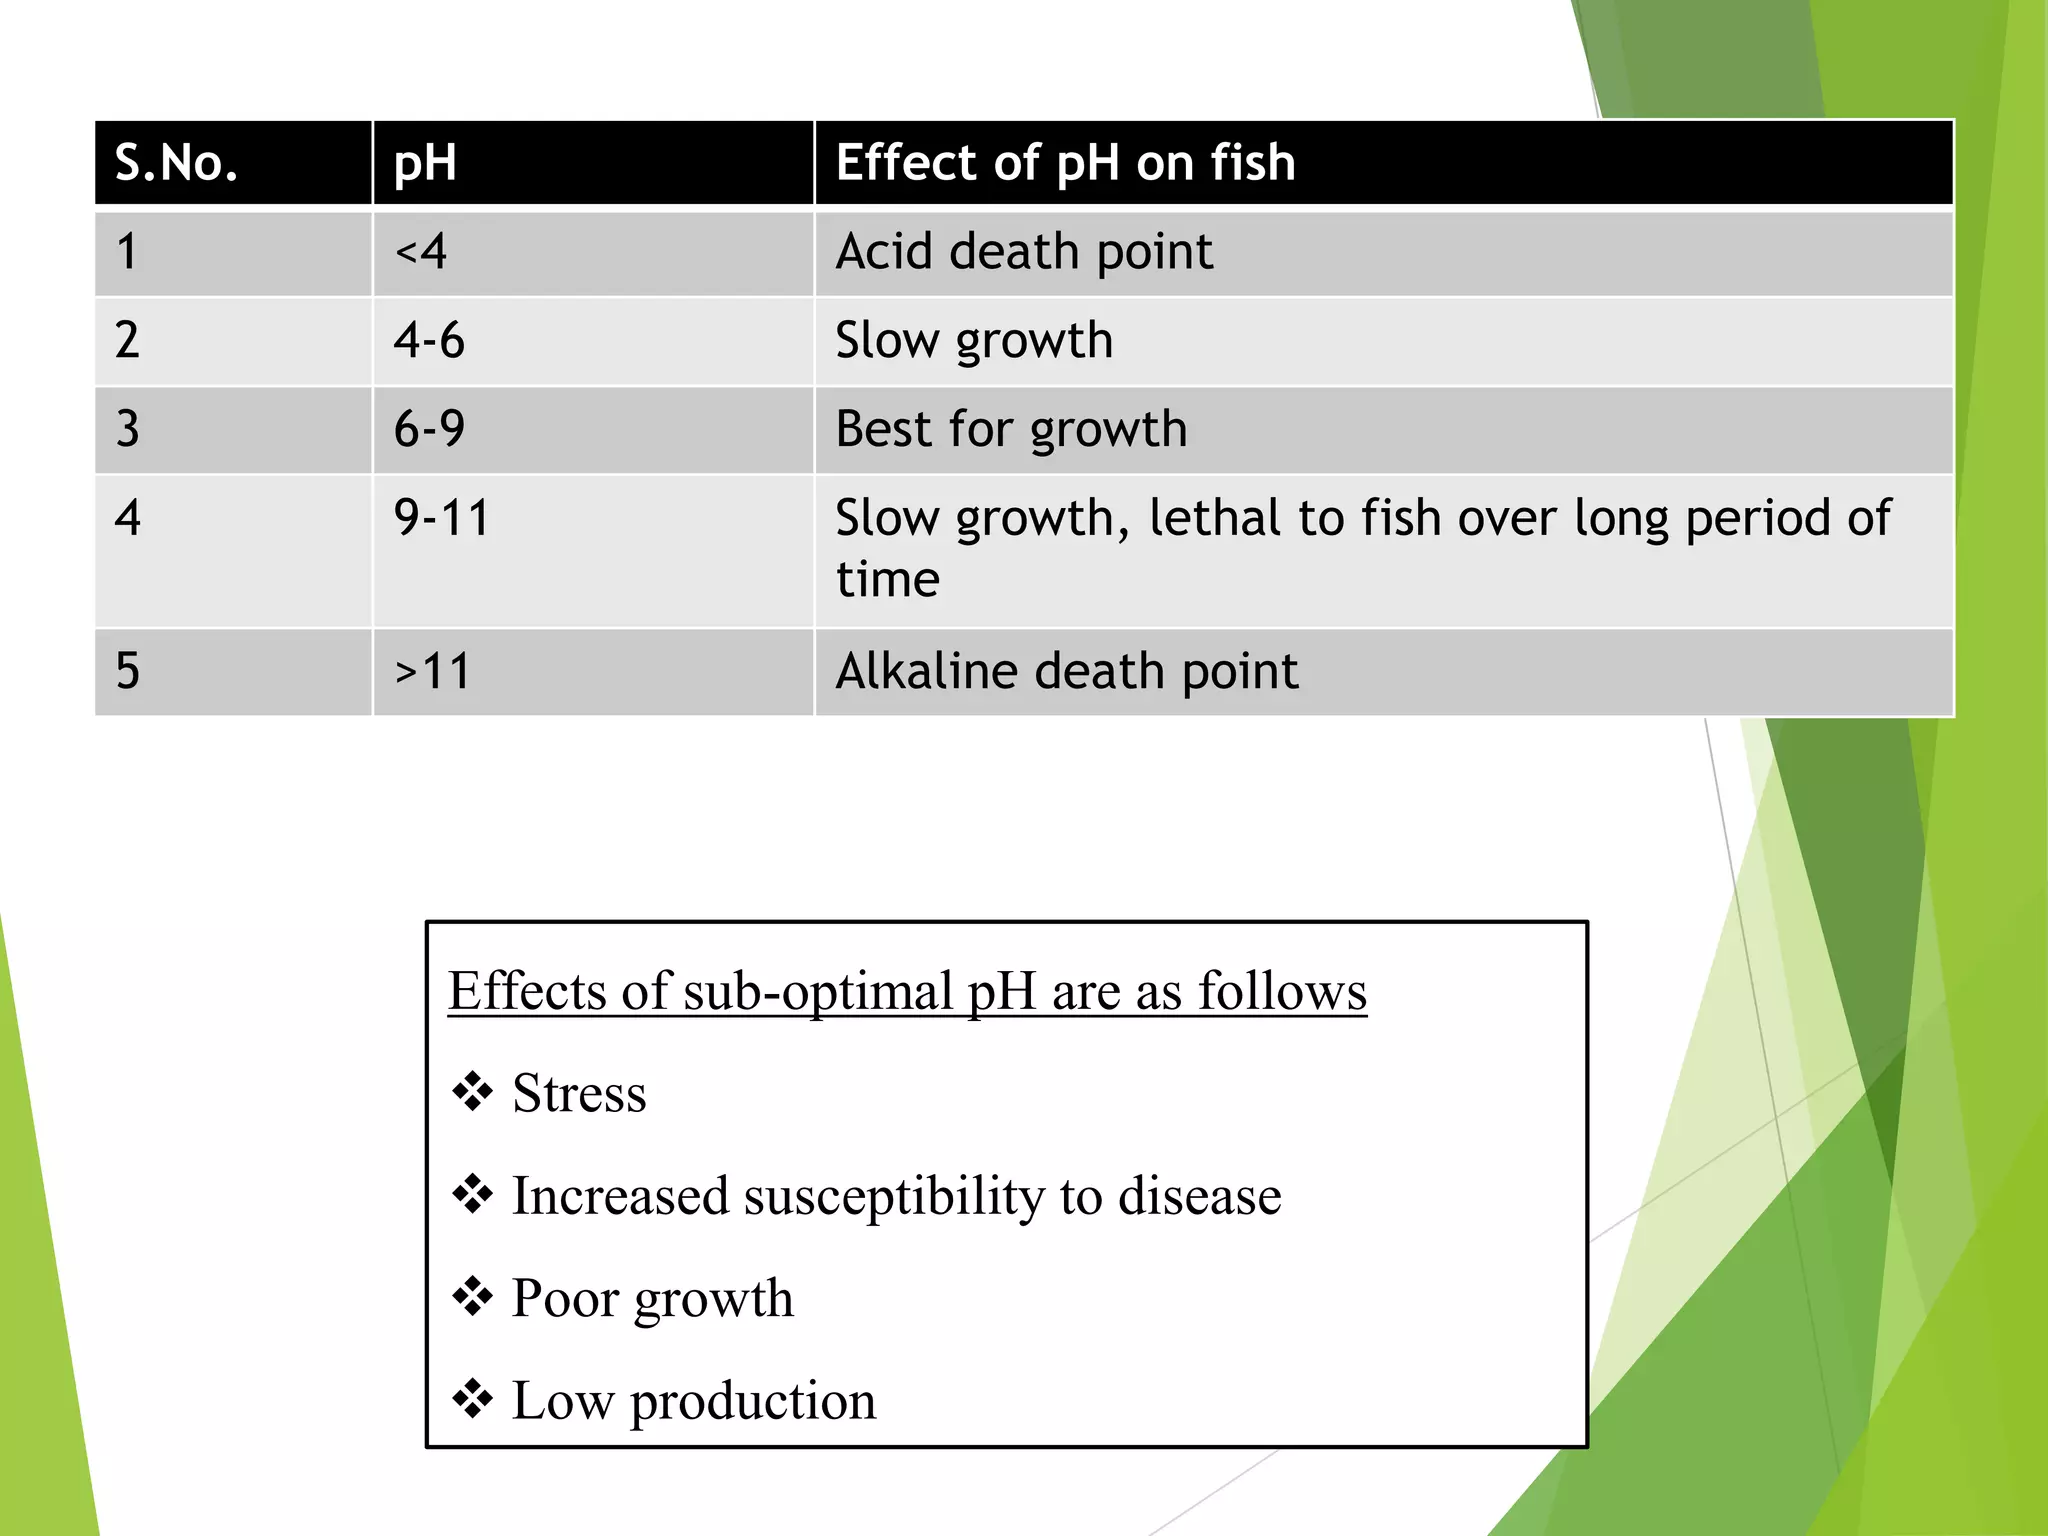
WATER AND SOIL QUALITY
MANAGEMENT IN PONDS AND
OTHER MARICULTURE &
COASTALAQUACULTURE
Presented by..
Dr. Rohitash Yadav
Department of Aquaculture
COFS, BAU, Gumla, Ranchi,
Jharkhand
 Water properties and environmental parameters -affect the choice of an
aquaculture site and the cultured species
 In the recent years, intensification of aquaculture practices have posed
question regarding maintenance of optimum nutrients in the culture
system as well as impact of practices on the surrounding environment
 Reverse effect of Fish culture -oxygen consumption and metabolic by
products such as ammonia and carbon dioxide
 Fish are in equilibrium with potential disease organisms and their
environment.
▪ Changes of equilibrium, such as deterioration in water quality can
result in fish becoming stressed and at risk to disease
▪ Important to know water quality parameters and their management
that influence on growth and survival of aquatic organisms
▪ Soil and water quality problems are common in aquaculture
ponds, and many methods are used for improving pond soil and
water.
▪ Water quality standards for aquaculture are presented in the
following table-
Ideal value of various physico-chemical parameters for
aquaculture in brackish water and seawater
Parameter Brackish water Seawater
Colour Clear water with
greenish
Clear water with
greenish
Transparency (cm) 26-35 26-35
Clay Turbidity (mg/l) <30 <30
TDS (mg/l) >500 >500
Temperature 0C
Tropical climate
Temperate climate
25-32
10-18
25-32
10-18
pH 7.0-8.7 7.0-8.5
Hardness (mg/l) >50 >50
Alkalinity (mg/l) >50 >50
Parameter Brackish water Seawater
Chlorides (mg/l) >500 >500
Salinity (ppt) 10-25 >30
D.O. (mg/l) 5-10 5-10
Free Carbon dioxide
(mg/l)
<3 <3
Unionized ammonia
(mg/l)
0-0.1 0-0.1
Ionized ammonia (mg/l) 0-1.0 0-1.0
Nitrite nitrogen (mg/l) 0-0.5 0-0.5
Nitrate nitrogen (mg/l) 0.1-3 0.1-3
Total phosphorous (mg/l) 0.05-0.5 0.05-0.5
Potassium (mg/l) >0.5 >0.5
Physical variables
Temperature:
 Has greatest effect on fish - poikilotherms
 Fishes are ectotherms as heat is obtained from outside the animal, unlike
endotherms (mammals) that generate their own body heat.
 Temperature also affects oxygen solubility and causes interactions of
several other water quality parameters
 Also influence physiological processes such as respiration rate, efficiency
of feeding and assimilation, growth, behaviour and reproduction
 A temperature increase of 10°C will generally cause rate of chemical and
biological reactions to double or triple
❖ Because of this dissolved oxygen requirements are more critical
in warm water than in cold water
❖ Optimum temperature varies with the species
❖ Within a species’ tolerable limits growth will increase with
increasing temperature
❖ Fish -healthiest - optimum temperature
❖ Temperature partly determines oxygen concentration in water
❖ Under favorable conditions, optimum temperature range for
many Coldwater and warmwater fishes is 14-18 0C and 24 to
30 0C respectively.
Salinity
❖ Total concentration of all ions in the water is its salinity
❖ Salinity - measure of the concentration of dissolved ions in water
expressed as parts per thousand (ppt)
❖ Seawater salinity - 33 to 37 ppt with an average of about 35
❖ Estuarine and brackish waters - from full strength seawater to about 3
ppt.
❖ The composition and concentration of dissolved salts in the body fluids
of fish and invertebrates must be maintained within fairly narrow limits
to buffer against changes that can cause physiological disruptions
❖ Salinity not only affects osmoregulation, but also influences
concentration of un-ionized ammonia.
❖ Fish maintain homeostasis through osmoregulation which is
influenced by salinity of water
❖ Species tolerating wide rage of salinity - ‘Euryhaline’
❖ Limited tolerance to salinity changes -‘stenohaline’
❖ Euryhaline species (Asian sea bass) can be cultured in a broad
range of salinity from fresh to seawater but stenohaline fish
(cobia) can be cultured only in full strength seawater
Turbidity
❖ It is produced by dissolved and suspended substances such as clay
particles, humic substances, plankton, coloured compounds etc.
❖ It’s a very general term that describes cloudiness or muddiness
❖ Turbidity -measure of light penetration in water
❖ Excessive turbidity can be troublesome in fish ponds and flow-
through systems
❖ Turbidity by plankton -desirable since it enhances fish production
❖ Turbidity due to clay and other colloidal particles - undesirable
since it can choke the gills of fish and shellfish; can also restrict the
growth of phytoplankton
❖Water turbidity in ponds - measured with the Secchi disc
❖Clay turbidity affects dissolved oxygen.
❖Turbidity also causes off-flavoured fish
Control of turbidity
❖The most effective coagulants is alum or aluminum
sulphate, which has been used to clarify muddy waters
❖As effective as alum and gypsum can also be used to
control turbidity but without loss of alkalinity
Transparency
❖ Water transparency depends on the amount of particles in the
water.
❖ Particles can be inorganic (e.g. sediment from erosion) or organic
(such as algae, phytoplankton).
❖ Transparency of water relates to the depth that light will penetrate
water.
❖ It is important, because aquatic plants need sunlight for
photosynthesis. The clearer the water, the deeper sunlight will
penetrate.
Secchi disc
 Is a round disk having a diameter of 30 cm
 The disk is divided into quadrants, two opposite quadrants are painted
white and the other two black
 Disc is attached to a rope or cable marked in increments
 A measurement is taken by lowering the disk into water body until it just
disappears from sight
 The depth at which the disk disappears is the Secchi disc visibility usually
expressed in centimetres
 Optimum Secchi disc visibility in extensive and semi-intensive ponds is 25
to 40 cm
Water colour
❖Fish farmers pay much attention to colour of pond water.
❖In other words, they give more importance on the promotion of
phytoplankton in pond water.
❖Light or bright green: this colour is due to green algae,
especially chlorella.
❖Fish and prawns grow very well in this pond type. Therefore,
water of this colour should be the target of farmer.
❖Reddish-brown or pinkish-red: blooming diatoms cause this
colour. its nutritious to fish and farmers.
Five following objectives associated with water colour can
be identified:
❖ To increase DO and to decrease CO2,NH3, H2S,and CH4 in
pond water.
❖ To stabilize water quality and to lower content of toxic
compounds
❖ To make use of plankton as natural feed
❖ To provide shade and to decrease cannibalism
❖ To increase and stabilize water temperature
Chemical variables
Dissolved oxygen:
 Critical and limiting factors in intensive aquaculture.
 Oxygen enters water through photosynthesis by aquatic plants
(phytoplankton).
 Diffusion at air water interface
 Dissolved oxygen - controls the metabolism of fish and invertebrates
 Phytoplankton and macrophytes - through photosynthesis
 Increase in temperature and salinity reduce the saturation point of DO in
water
❖ Fish oxygen consumption rates –
➢ Vary with water temperature,
➢ DO concentration,
➢ Fish size,
➢ Level of activity,
➢ Time after feeding and other factors
❖ Oxygen is lost from water through respiration by fish, plankton and other
organisms.
❖ Diurnal fluctuations in oxygen
❖ Optimum DO content of ponds waters should be in the range of 5 mg/l to
saturation level for good fish growth
❖ Small fish consume more oxygen per unit weight than larger fish of the
same species
❖ Warm water species tolerate lower DO concentration than cold water fish
❖ Oxygen consumption increases when fish are forced to exercise, and
metabolic energy demands can cause oxygen consumption to double from
one to six hours after feeding
 Following are some guidelines for DO for fish production
1. 5mg/l –optimum for normal growth and reproduction in tropical waters
2. 1 to 5 mg/l -sub-lethal effects on growth feed conversion and tolerance
to disease
3. 0.3 to 0.8mg/l –lethal to finfish and shellfish
Control of oxygen depletion in water
❖Manual-Water surface is splashed with bamboo-sticks
❖Mechanical-
▪ Pump- water exchange
▪ Aerators- Floating
Total alkalinity:
 Total alkalinity is the total amount of bases in water expressed as
mg/L of equivalent calcium carbonate
 Principal ions contribute to alkalinity are carbonate and
bicarbonate and, to a lesser degree, hydroxides, ammonium,
borate, silicates and phosphates
 These ions are buffers in waters, that is they buffer water against
sudden changes in pH
 Seawaters have a mean total alkalinity of about 116 mg/L
 Alkalinity is a measure of pH buffering capacity or acid
neutralizing capacity
❖Alkalinity below <20 mg/L is considered poorly buffered
against pH changes
Guidelines for alkalinity for fish growth are as follows
▪ 300mg/l -create stress to fish
▪ 75-300mg/l –ideal for fish
▪ <75mg/l – create stress to fish
pH:
❖pH - indicator of hydrogen ion concentration in water
❖pH scale ranges 0 to 14 with 7 as neutral
❖Carbon dioxide has an acidic reaction in water
❖pH in ponds rises during day because phytoplankton or
other aquatic plants remove carbon dioxide from the water
during photosynthesis
❖Water pH affects metabolism and physiological process of
fish
❖ Guidelines for pH value for fish production are given in
Table…
S.No. pH Effect of pH on fish
1 <4 Acid death point
2 4-6 Slow growth
3 6-9 Best for growth
4 9-11 Slow growth, lethal to fish over long period of
time
5 >11 Alkaline death point
Effects of sub-optimal pH are as follows
❖ Stress
❖ Increased susceptibility to disease
❖ Poor growth
❖ Low production
Control of alkaline and acidic waters
I. Alkaline waters
❖ Application of acid forming fertilizers
❖ Gypsum
❖ CAN
❖ Urea
I. Acidic waters
❖ Lime (Calcium carbonate, calcium hydroxide, Calcium oxide, and
Dolomite)
❖ Salt water like sea-water may be flushed through water-bodies of coastal
farms to neutralize acidity
Total hardness
❖ It’s the concentration of metal ions (calcium and magnesium) expressed
in mg/l of calcium carbonate.
❖ Desirable levels for fish culture generally fall within the range of 75-
300 mg/l.
❖ If alkalinity is high and hardness low, pH may rise to very high levels
during rapid photosynthesis
❖ Guidelines for hardness value for fish growth
✓ 60 mg/l satisfactory for pond productivity and helps protect fish
against harmful effects
✓ <60 mg/l creates stress to fish
Carbon dioxide
❖Atmosphere in very small quantity
❖High solubility in water
❖Concentration in most water-bodies is low
❖Main source of carbon dioxide to water is by respiration of
organisms and biological oxidation of organic matter
❖Carbon dioxide is not particularly toxic to fish provided
sufficient dissolved oxygen is available
❖CO₂ concentration of 5-15 mg/L is recommended as
maximum for fish culture
❖ Occurs in water in three closely related forms
i. Free carbon dioxide
ii. Bicarbonate ions (HCO3
-)
iii. Carbonate ion (CO3
2-)
Guidelines for carbon dioxide value for fish pond…
❖ 12-50 mg/l – sub-lethal effects include respiratory stress and
development of kidney stones in some species
❖ >50 mg/l – lethal to fish species
Measures for controlling high carbon dioxide
❖Repeated aeration of water
❖Increasing pH of water by hydrated lime that can control
high carbon- dioxide
❖Experiments have shown that 1mg/l of hydrated lime can
remove 1.68mg/l of free carbon dioxide
❖Correct stocking, feeding and fertilization should regulate
Ammonia:
 Ammonia exists in water in two states - ionized ammonia, also called the
ammonium ion (NH4+) and un-ionized ammonia (NH3) (Free ammonia)
 The sum of two is called total ammonia or simply ammonia
 Toxicity of total ammonia depends on what fraction of the total is in the un-
ionized form, since this form is by far the more toxic of the two
 Which fraction dominates depends on the pH, temperature and salinity of
water; out of this water pH has the strongest influence
 At higher pH un-ionized ammonia dominates and hence more toxic
 A maximum concentration of 0.02mg/L is recommended for marine fish
❖ At high DO and high carbon dioxide concentration toxicity of ammonia to
fish is reduced
❖ Following are guidelines for unionized ammonia level for fish growth
✓ 0.02-0.05 mg/l –safe concentration
✓ 0.05 to 0.4 mg/l sub- lethal effects depending on the species
✓ 0.4 to 2.5 mg/l lethal to many species
Some recommended measures to reduce effects of ammonia
❖ Aeration
❖ Water exchange
❖ Healthy phytoplankton populations remove ammonia from water
❖ Biological filters may be used treat water for converting ammonia to
nitrite and nitrite to nitrate
Nitrite:
 Nitrite -toxic to fish
 Toxicity of nitrite is due to its effect on oxygen transport and tissue
damage
 Fish deaths increase when low dissolved oxygen is coupled with
higher nitrite concentrations
 Water bodies with high organic pollution and low oxygen
concentration, nitrate conc. may increase
 At higher levels of chloride the toxicity of nitrite is reduced. Hence
nitrite toxicity in seawater is not as serious as in freshwater systems.
❖ Following are guidelines for nitrite level for fish growth
✓ 0.01-0.02 mg/l –safe concentration
✓ 0.02 to 1.0 mg/l sub- lethal effects depending on the species
✓ 1.0 to 10 mg/l lethal to many species
Some recommended measures to reduce effects of nitrite
❖ Aeration
❖ Correct stocking
❖ Feeding and fertilization should be maintained
❖ Healthy phytoplankton populations remove ammonia from water
❖ Biological filters may be used treat water for converting ammonia to
nitrite and nitrite to nitrate
Nitrate:
❖ Nitrates are the least toxic of the inorganic
nitrogenous compounds
❖ Nitrates are more of a problem in recirculatory
systems and the problem is controlled with daily water
exchanges
Hydrogen sulphide:
❖ Hydrogen sulphide is generated by certain heterotrophic bacteria under
anaerobic conditions
❖ Hydrogen sulphide is produced by chemical reduction of organic matter
that accumulates and forms a thick layer of organic deposit at the bottom.
❖ Distribution of hydrogen sulphide and other sulphur species is regulated
by water pH
❖ Un-ionized hydrogen sulphide is toxic to fish and invertebrates at low
concentrations. Therefore, detectable concentrations should be considered
as hazardous
Guidelines for hydrogen sulphide value for fish growth
❖ 0.01- 0.5 mg/l lethal to fish
❖ 0.1-0.2 mg/l sub lethal stress
❖ 3 mg/l Die instantly
Measures to rectify increase in hydrogen sulphide
✓ As the value of pH rises, the percent of hydrogen sulphide decreases
✓ Frequent water exchange to prevent building –up of hydrogen sulphide
in water body
Bottom soil management
❖ Role of the bottom soil in determining productivity of a pond
❖ Production of various primary food organisms depends
largely on the availability of different nutrients
❖ Bottom soil is designated as the chemical laboratory of the
pond
❖ Suitable soil problems are common in aquaculture ponds,
and therefore, many methods are used for improving soils of
pond
Texture:
❖ Nature and properties of the parent material forming soil determine soil
texture
❖ Many important physic-chemical properties for fertility of fish ponds
are influenced
❖ Ideal pond soil should not be too sandy to allow leaching of nutrients
❖ Should not be too clayey to keep all nutrients adsorbed
❖ Pond constructed on the sandy soils, heavy doses of organic manure are
essential to control seepage loss of water
❖ Raw or FYM dose varies from 10 to 15 tones/ha/yr
Soil acidity
❖ Soil may be acidic, alkaline or neutral; the ideal range of pH
is 6-8.
❖ Water passing over acid soil tends to be acidic with low
alkalinity and hardness
❖ High concentration of metal ions particularly aluminum and
iron may also be present
❖ Acid ponds do not respond well to fertilization
❖ Liming is the only way to improve water quality in ponds
with acid soils
Acid sulphate soils
❖ Acid sulphate soils from mine spoils and coastal
mangroves contain high levels of pyrite
❖ Sulphuric acid reduces water pH when pond is filled
❖ In pond, problems with acid sulphate soils usually
originate in pond-dyke.
❖ Dykes dry and sulphuric acid formed during dry period
enters pond through run-off water after rains
❖ Acidity on dykes can be controlled by liming and by
establishing good cover with an acid-resistant grass species
Bottom-soil oxidation
❖ DO can not move rapidly into water saturated soil, and pond
soils become anaerobic below the depth of a few millimeters
❖ Aeration and water circulation are beneficial in improving
bottom-soil oxidation, but the surface layer of the soil may still
become anaerobic in intensive fish culture ponds
❖ Sodium nitrate can serve as a source of oxygen for microbes in
poorly oxygenated environments
Drying pond bottom
❖ Pond bottoms are dried between crops, evaporation of
water from soil-pores and cracking of soil enhances
aeration and favours microbial decomposition of soil
organic matter
❖ Tilling of dry soil with a disk harrow can improve
aeration, but tilled bottoms of aerated ponds should be
compacted before refilling to reduce tendency of erosion
WATER AND SOIL QUALITY MANAGEMENT.pdf

WATER AND SOIL QUALITY MANAGEMENT.pdf

  • 1.
    WATER AND SOILQUALITY MANAGEMENT IN PONDS AND OTHER MARICULTURE & COASTALAQUACULTURE Presented by.. Dr. Rohitash Yadav Department of Aquaculture COFS, BAU, Gumla, Ranchi, Jharkhand
  • 2.
     Water propertiesand environmental parameters -affect the choice of an aquaculture site and the cultured species  In the recent years, intensification of aquaculture practices have posed question regarding maintenance of optimum nutrients in the culture system as well as impact of practices on the surrounding environment  Reverse effect of Fish culture -oxygen consumption and metabolic by products such as ammonia and carbon dioxide  Fish are in equilibrium with potential disease organisms and their environment.
  • 3.
    ▪ Changes ofequilibrium, such as deterioration in water quality can result in fish becoming stressed and at risk to disease ▪ Important to know water quality parameters and their management that influence on growth and survival of aquatic organisms ▪ Soil and water quality problems are common in aquaculture ponds, and many methods are used for improving pond soil and water. ▪ Water quality standards for aquaculture are presented in the following table-
  • 4.
    Ideal value ofvarious physico-chemical parameters for aquaculture in brackish water and seawater Parameter Brackish water Seawater Colour Clear water with greenish Clear water with greenish Transparency (cm) 26-35 26-35 Clay Turbidity (mg/l) <30 <30 TDS (mg/l) >500 >500 Temperature 0C Tropical climate Temperate climate 25-32 10-18 25-32 10-18 pH 7.0-8.7 7.0-8.5 Hardness (mg/l) >50 >50 Alkalinity (mg/l) >50 >50
  • 5.
    Parameter Brackish waterSeawater Chlorides (mg/l) >500 >500 Salinity (ppt) 10-25 >30 D.O. (mg/l) 5-10 5-10 Free Carbon dioxide (mg/l) <3 <3 Unionized ammonia (mg/l) 0-0.1 0-0.1 Ionized ammonia (mg/l) 0-1.0 0-1.0 Nitrite nitrogen (mg/l) 0-0.5 0-0.5 Nitrate nitrogen (mg/l) 0.1-3 0.1-3 Total phosphorous (mg/l) 0.05-0.5 0.05-0.5 Potassium (mg/l) >0.5 >0.5
  • 6.
    Physical variables Temperature:  Hasgreatest effect on fish - poikilotherms  Fishes are ectotherms as heat is obtained from outside the animal, unlike endotherms (mammals) that generate their own body heat.  Temperature also affects oxygen solubility and causes interactions of several other water quality parameters  Also influence physiological processes such as respiration rate, efficiency of feeding and assimilation, growth, behaviour and reproduction  A temperature increase of 10°C will generally cause rate of chemical and biological reactions to double or triple
  • 7.
    ❖ Because ofthis dissolved oxygen requirements are more critical in warm water than in cold water ❖ Optimum temperature varies with the species ❖ Within a species’ tolerable limits growth will increase with increasing temperature ❖ Fish -healthiest - optimum temperature ❖ Temperature partly determines oxygen concentration in water ❖ Under favorable conditions, optimum temperature range for many Coldwater and warmwater fishes is 14-18 0C and 24 to 30 0C respectively.
  • 8.
    Salinity ❖ Total concentrationof all ions in the water is its salinity ❖ Salinity - measure of the concentration of dissolved ions in water expressed as parts per thousand (ppt) ❖ Seawater salinity - 33 to 37 ppt with an average of about 35 ❖ Estuarine and brackish waters - from full strength seawater to about 3 ppt. ❖ The composition and concentration of dissolved salts in the body fluids of fish and invertebrates must be maintained within fairly narrow limits to buffer against changes that can cause physiological disruptions
  • 9.
    ❖ Salinity notonly affects osmoregulation, but also influences concentration of un-ionized ammonia. ❖ Fish maintain homeostasis through osmoregulation which is influenced by salinity of water ❖ Species tolerating wide rage of salinity - ‘Euryhaline’ ❖ Limited tolerance to salinity changes -‘stenohaline’ ❖ Euryhaline species (Asian sea bass) can be cultured in a broad range of salinity from fresh to seawater but stenohaline fish (cobia) can be cultured only in full strength seawater
  • 10.
    Turbidity ❖ It isproduced by dissolved and suspended substances such as clay particles, humic substances, plankton, coloured compounds etc. ❖ It’s a very general term that describes cloudiness or muddiness ❖ Turbidity -measure of light penetration in water ❖ Excessive turbidity can be troublesome in fish ponds and flow- through systems ❖ Turbidity by plankton -desirable since it enhances fish production ❖ Turbidity due to clay and other colloidal particles - undesirable since it can choke the gills of fish and shellfish; can also restrict the growth of phytoplankton
  • 11.
    ❖Water turbidity inponds - measured with the Secchi disc ❖Clay turbidity affects dissolved oxygen. ❖Turbidity also causes off-flavoured fish
  • 12.
    Control of turbidity ❖Themost effective coagulants is alum or aluminum sulphate, which has been used to clarify muddy waters ❖As effective as alum and gypsum can also be used to control turbidity but without loss of alkalinity
  • 13.
    Transparency ❖ Water transparencydepends on the amount of particles in the water. ❖ Particles can be inorganic (e.g. sediment from erosion) or organic (such as algae, phytoplankton). ❖ Transparency of water relates to the depth that light will penetrate water. ❖ It is important, because aquatic plants need sunlight for photosynthesis. The clearer the water, the deeper sunlight will penetrate.
  • 14.
    Secchi disc  Isa round disk having a diameter of 30 cm  The disk is divided into quadrants, two opposite quadrants are painted white and the other two black  Disc is attached to a rope or cable marked in increments  A measurement is taken by lowering the disk into water body until it just disappears from sight  The depth at which the disk disappears is the Secchi disc visibility usually expressed in centimetres  Optimum Secchi disc visibility in extensive and semi-intensive ponds is 25 to 40 cm
  • 15.
    Water colour ❖Fish farmerspay much attention to colour of pond water. ❖In other words, they give more importance on the promotion of phytoplankton in pond water. ❖Light or bright green: this colour is due to green algae, especially chlorella. ❖Fish and prawns grow very well in this pond type. Therefore, water of this colour should be the target of farmer. ❖Reddish-brown or pinkish-red: blooming diatoms cause this colour. its nutritious to fish and farmers.
  • 16.
    Five following objectivesassociated with water colour can be identified: ❖ To increase DO and to decrease CO2,NH3, H2S,and CH4 in pond water. ❖ To stabilize water quality and to lower content of toxic compounds ❖ To make use of plankton as natural feed ❖ To provide shade and to decrease cannibalism ❖ To increase and stabilize water temperature
  • 17.
    Chemical variables Dissolved oxygen: Critical and limiting factors in intensive aquaculture.  Oxygen enters water through photosynthesis by aquatic plants (phytoplankton).  Diffusion at air water interface  Dissolved oxygen - controls the metabolism of fish and invertebrates  Phytoplankton and macrophytes - through photosynthesis  Increase in temperature and salinity reduce the saturation point of DO in water
  • 18.
    ❖ Fish oxygenconsumption rates – ➢ Vary with water temperature, ➢ DO concentration, ➢ Fish size, ➢ Level of activity, ➢ Time after feeding and other factors ❖ Oxygen is lost from water through respiration by fish, plankton and other organisms. ❖ Diurnal fluctuations in oxygen ❖ Optimum DO content of ponds waters should be in the range of 5 mg/l to saturation level for good fish growth
  • 19.
    ❖ Small fishconsume more oxygen per unit weight than larger fish of the same species ❖ Warm water species tolerate lower DO concentration than cold water fish ❖ Oxygen consumption increases when fish are forced to exercise, and metabolic energy demands can cause oxygen consumption to double from one to six hours after feeding  Following are some guidelines for DO for fish production 1. 5mg/l –optimum for normal growth and reproduction in tropical waters 2. 1 to 5 mg/l -sub-lethal effects on growth feed conversion and tolerance to disease 3. 0.3 to 0.8mg/l –lethal to finfish and shellfish
  • 20.
    Control of oxygendepletion in water ❖Manual-Water surface is splashed with bamboo-sticks ❖Mechanical- ▪ Pump- water exchange ▪ Aerators- Floating
  • 21.
    Total alkalinity:  Totalalkalinity is the total amount of bases in water expressed as mg/L of equivalent calcium carbonate  Principal ions contribute to alkalinity are carbonate and bicarbonate and, to a lesser degree, hydroxides, ammonium, borate, silicates and phosphates  These ions are buffers in waters, that is they buffer water against sudden changes in pH  Seawaters have a mean total alkalinity of about 116 mg/L  Alkalinity is a measure of pH buffering capacity or acid neutralizing capacity
  • 22.
    ❖Alkalinity below <20mg/L is considered poorly buffered against pH changes Guidelines for alkalinity for fish growth are as follows ▪ 300mg/l -create stress to fish ▪ 75-300mg/l –ideal for fish ▪ <75mg/l – create stress to fish
  • 23.
    pH: ❖pH - indicatorof hydrogen ion concentration in water ❖pH scale ranges 0 to 14 with 7 as neutral ❖Carbon dioxide has an acidic reaction in water ❖pH in ponds rises during day because phytoplankton or other aquatic plants remove carbon dioxide from the water during photosynthesis ❖Water pH affects metabolism and physiological process of fish ❖ Guidelines for pH value for fish production are given in Table…
  • 24.
    S.No. pH Effectof pH on fish 1 <4 Acid death point 2 4-6 Slow growth 3 6-9 Best for growth 4 9-11 Slow growth, lethal to fish over long period of time 5 >11 Alkaline death point Effects of sub-optimal pH are as follows ❖ Stress ❖ Increased susceptibility to disease ❖ Poor growth ❖ Low production
  • 25.
    Control of alkalineand acidic waters I. Alkaline waters ❖ Application of acid forming fertilizers ❖ Gypsum ❖ CAN ❖ Urea I. Acidic waters ❖ Lime (Calcium carbonate, calcium hydroxide, Calcium oxide, and Dolomite) ❖ Salt water like sea-water may be flushed through water-bodies of coastal farms to neutralize acidity
  • 26.
    Total hardness ❖ It’sthe concentration of metal ions (calcium and magnesium) expressed in mg/l of calcium carbonate. ❖ Desirable levels for fish culture generally fall within the range of 75- 300 mg/l. ❖ If alkalinity is high and hardness low, pH may rise to very high levels during rapid photosynthesis ❖ Guidelines for hardness value for fish growth ✓ 60 mg/l satisfactory for pond productivity and helps protect fish against harmful effects ✓ <60 mg/l creates stress to fish
  • 27.
    Carbon dioxide ❖Atmosphere invery small quantity ❖High solubility in water ❖Concentration in most water-bodies is low ❖Main source of carbon dioxide to water is by respiration of organisms and biological oxidation of organic matter ❖Carbon dioxide is not particularly toxic to fish provided sufficient dissolved oxygen is available ❖CO₂ concentration of 5-15 mg/L is recommended as maximum for fish culture
  • 28.
    ❖ Occurs inwater in three closely related forms i. Free carbon dioxide ii. Bicarbonate ions (HCO3 -) iii. Carbonate ion (CO3 2-) Guidelines for carbon dioxide value for fish pond… ❖ 12-50 mg/l – sub-lethal effects include respiratory stress and development of kidney stones in some species ❖ >50 mg/l – lethal to fish species
  • 29.
    Measures for controllinghigh carbon dioxide ❖Repeated aeration of water ❖Increasing pH of water by hydrated lime that can control high carbon- dioxide ❖Experiments have shown that 1mg/l of hydrated lime can remove 1.68mg/l of free carbon dioxide ❖Correct stocking, feeding and fertilization should regulate
  • 30.
    Ammonia:  Ammonia existsin water in two states - ionized ammonia, also called the ammonium ion (NH4+) and un-ionized ammonia (NH3) (Free ammonia)  The sum of two is called total ammonia or simply ammonia  Toxicity of total ammonia depends on what fraction of the total is in the un- ionized form, since this form is by far the more toxic of the two  Which fraction dominates depends on the pH, temperature and salinity of water; out of this water pH has the strongest influence  At higher pH un-ionized ammonia dominates and hence more toxic  A maximum concentration of 0.02mg/L is recommended for marine fish
  • 31.
    ❖ At highDO and high carbon dioxide concentration toxicity of ammonia to fish is reduced ❖ Following are guidelines for unionized ammonia level for fish growth ✓ 0.02-0.05 mg/l –safe concentration ✓ 0.05 to 0.4 mg/l sub- lethal effects depending on the species ✓ 0.4 to 2.5 mg/l lethal to many species Some recommended measures to reduce effects of ammonia ❖ Aeration ❖ Water exchange ❖ Healthy phytoplankton populations remove ammonia from water ❖ Biological filters may be used treat water for converting ammonia to nitrite and nitrite to nitrate
  • 32.
    Nitrite:  Nitrite -toxicto fish  Toxicity of nitrite is due to its effect on oxygen transport and tissue damage  Fish deaths increase when low dissolved oxygen is coupled with higher nitrite concentrations  Water bodies with high organic pollution and low oxygen concentration, nitrate conc. may increase  At higher levels of chloride the toxicity of nitrite is reduced. Hence nitrite toxicity in seawater is not as serious as in freshwater systems.
  • 33.
    ❖ Following areguidelines for nitrite level for fish growth ✓ 0.01-0.02 mg/l –safe concentration ✓ 0.02 to 1.0 mg/l sub- lethal effects depending on the species ✓ 1.0 to 10 mg/l lethal to many species Some recommended measures to reduce effects of nitrite ❖ Aeration ❖ Correct stocking ❖ Feeding and fertilization should be maintained ❖ Healthy phytoplankton populations remove ammonia from water ❖ Biological filters may be used treat water for converting ammonia to nitrite and nitrite to nitrate
  • 34.
    Nitrate: ❖ Nitrates arethe least toxic of the inorganic nitrogenous compounds ❖ Nitrates are more of a problem in recirculatory systems and the problem is controlled with daily water exchanges
  • 35.
    Hydrogen sulphide: ❖ Hydrogensulphide is generated by certain heterotrophic bacteria under anaerobic conditions ❖ Hydrogen sulphide is produced by chemical reduction of organic matter that accumulates and forms a thick layer of organic deposit at the bottom. ❖ Distribution of hydrogen sulphide and other sulphur species is regulated by water pH ❖ Un-ionized hydrogen sulphide is toxic to fish and invertebrates at low concentrations. Therefore, detectable concentrations should be considered as hazardous
  • 36.
    Guidelines for hydrogensulphide value for fish growth ❖ 0.01- 0.5 mg/l lethal to fish ❖ 0.1-0.2 mg/l sub lethal stress ❖ 3 mg/l Die instantly Measures to rectify increase in hydrogen sulphide ✓ As the value of pH rises, the percent of hydrogen sulphide decreases ✓ Frequent water exchange to prevent building –up of hydrogen sulphide in water body
  • 37.
    Bottom soil management ❖Role of the bottom soil in determining productivity of a pond ❖ Production of various primary food organisms depends largely on the availability of different nutrients ❖ Bottom soil is designated as the chemical laboratory of the pond ❖ Suitable soil problems are common in aquaculture ponds, and therefore, many methods are used for improving soils of pond
  • 38.
    Texture: ❖ Nature andproperties of the parent material forming soil determine soil texture ❖ Many important physic-chemical properties for fertility of fish ponds are influenced ❖ Ideal pond soil should not be too sandy to allow leaching of nutrients ❖ Should not be too clayey to keep all nutrients adsorbed ❖ Pond constructed on the sandy soils, heavy doses of organic manure are essential to control seepage loss of water ❖ Raw or FYM dose varies from 10 to 15 tones/ha/yr
  • 39.
    Soil acidity ❖ Soilmay be acidic, alkaline or neutral; the ideal range of pH is 6-8. ❖ Water passing over acid soil tends to be acidic with low alkalinity and hardness ❖ High concentration of metal ions particularly aluminum and iron may also be present ❖ Acid ponds do not respond well to fertilization ❖ Liming is the only way to improve water quality in ponds with acid soils
  • 40.
    Acid sulphate soils ❖Acid sulphate soils from mine spoils and coastal mangroves contain high levels of pyrite ❖ Sulphuric acid reduces water pH when pond is filled ❖ In pond, problems with acid sulphate soils usually originate in pond-dyke. ❖ Dykes dry and sulphuric acid formed during dry period enters pond through run-off water after rains ❖ Acidity on dykes can be controlled by liming and by establishing good cover with an acid-resistant grass species
  • 41.
    Bottom-soil oxidation ❖ DOcan not move rapidly into water saturated soil, and pond soils become anaerobic below the depth of a few millimeters ❖ Aeration and water circulation are beneficial in improving bottom-soil oxidation, but the surface layer of the soil may still become anaerobic in intensive fish culture ponds ❖ Sodium nitrate can serve as a source of oxygen for microbes in poorly oxygenated environments
  • 42.
    Drying pond bottom ❖Pond bottoms are dried between crops, evaporation of water from soil-pores and cracking of soil enhances aeration and favours microbial decomposition of soil organic matter ❖ Tilling of dry soil with a disk harrow can improve aeration, but tilled bottoms of aerated ponds should be compacted before refilling to reduce tendency of erosion