Download as PDF, PPTX

![References
[1]Jeffrey Dean, Sanjay Ghemawat, Google Inc., MapReduce:
Simplified Data Processing on Large Clusters, In Sixth Symposium
on Operating System Design and Implementation(OSDI’04), San
Francisco, CA, December, 2004
[2] Eben Hewitt, Cassandra: The Definitive Guide, OReilly
Publications, November 2010.
[3] eBay Open Source Project, Turmeric SOA platform,
http:
//www.ebayopensource.org/index.php/Turmeric/HomePage](https://image.slidesharecdn.com/firstreviewpresentation-120221143859-phpapp01/85/First-review-presentation-12-320.jpg)
![References
[4] eBay Open Source Project, Documentation of Turmeric SOA
platform,
https://www.ebayopensource.org/wiki/display/
TURMERICDOC110GA/Turmeric+Documentation+Overview
[5] eBay Open Source Project, Turmeric Source Code,
http://www.github.com/ebayopensource
[6] Internal eBay documentation
[7] Google Web Toolkit,
http://code.google.com/webtoolkit
[8] Apache Cassandra,
http://cassandra.apache.org/](https://image.slidesharecdn.com/firstreviewpresentation-120221143859-phpapp01/85/First-review-presentation-13-320.jpg)

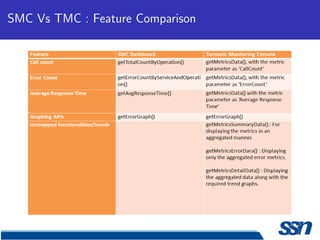
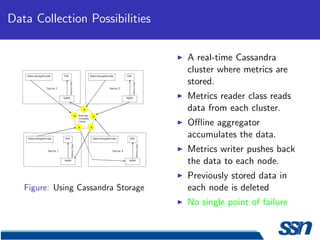
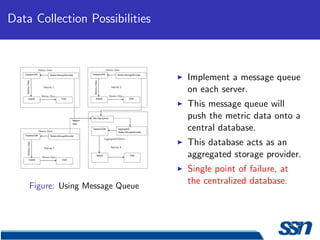
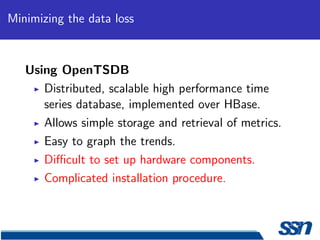
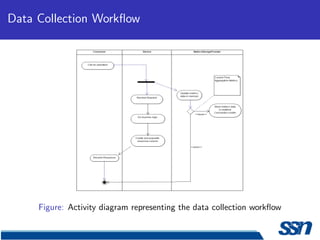
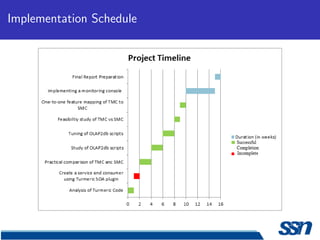
This document describes the design and implementation of a service monitoring console within a service oriented architecture framework. It discusses using Cassandra for data collection and storage, implementing message queues for data collection, and using OpenTSDB as a time series database. It also provides an implementation schedule and references several technologies including MapReduce, Cassandra, Turmeric, and Google Web Toolkit.