Valuation Of ASHOK LEYLAND
•
1 like•788 views

- Ashok Leyland's total operating revenues increased 45% year-over-year to Rs. 107,035 crore in FY21 from Rs. 73,817 crore in FY20. Total expenses also increased 44% to Rs. 103,824 crore in FY21 from Rs. 72,341 crore in FY20. - EBITDA more than doubled to Rs. 4,253 crore in FY21 from Rs. 2,377 crore in FY20, with the EBITDA margin expanding to 4% from 3%. - Net profit for the year increased 24% to Rs. 6,422 crore in FY21 from Rs. 5

Recommended
More Related Content
What's hot
What's hot (20)
Viewers also liked
Similar to Valuation Of ASHOK LEYLAND
Similar to Valuation Of ASHOK LEYLAND (20)
More from Aakash Singh
Valuation Of ASHOK LEYLAND
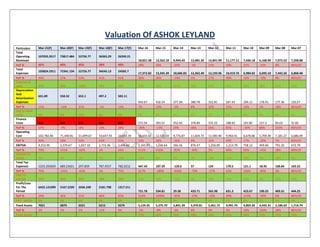
- 1. Valuation Of ASHOK LEYLAND Particulars Mar-21(F) Mar-20(F) Mar-19(F) Mar-18(F) Mar-17(F) Mar-16 Mar-15 Mar-14 Mar-13 Mar-12 Mar-11 Mar-10 Mar-09 Mar-08 Mar-07 Total Operating Revenues 107035.3517 73817.484 52726.77 36363.29 26350.21 18,821.58 13,562.18 9,943.43 12,481.20 12,841.99 11,177.11 7,436.18 6,168.99 7,972.52 7,358.88 YoY % 45% 40% 45% 38% 40% 39% 36% -20% -3% 15% 50% 21% -23% 8% #DIV/0! Total Expenses 103824.2911 72341.134 52726.77 34545.13 24505.7 17,372.82 13,345.39 10,606.83 12,362.40 12,193.96 10,419.76 6,984.02 6,045.10 7,442.26 6,868.48 YoY % 44% 37% 53% 41% 41% 30% 26% -14% 1% 17% 49% 16% -19% 8% #DIV/0! Expense to sales 97% 98% 100% 95% 93% 92% 98% 107% 99% 95% 93% 94% 98% 93% 93% Depreciation And Amortisation Expenses 631.89 550.32 652.1 497.2 502.11 443.67 416.34 377.04 380.78 352.81 267.43 204.11 178.41 177.36 150.57 YoY % 15% -16% 31% -1% 13% 7% 10% -1% 8% 32% 31% 14% 1% 18% #DIV/0! Dep to fixed asset 9% 8% 10% 8% 9% 9% 8% 6% 6% 6% 5% 4% 4% 8% 9% Finance Costs 410 350 375 400 350 273.54 393.51 452.92 376.89 255.25 188.92 101.85 157.3 83.63 31.82 YoY % 17% -7% -6% 14% 28% -30% -13% 20% 48% 35% 85% -35% 88% 163% #DIV/0! Operating Cost 102,782.40 71,440.81 51,699.67 33,647.93 23,653.59 16,655.61 12,535.54 9,776.87 11,604.73 11,585.90 9,963.41 6,678.06 5,709.39 7,181.27 6,686.09 YoY % 44% 38% 54% 42% 42% 33% 28% -16% 0% 16% 49% 17% -20% 7% #DIV/0! EBITDA 4,252.95 2,376.67 1,027.10 2,715.36 2,696.62 2,165.97 1,026.64 166.56 876.47 1,256.09 1,213.70 758.12 459.60 791.25 672.79 YoY % 79% 131% -62% 1% 24% 111% 516% -81% -30% 3% 60% 65% -42% 18% #DIV/0! EBITDA TO SALES 4% 3% 2% 7% 10% 12% 8% 2% 7% 10% 11% 10% 7% 10% 9% Total Tax Expenses 1233.355659 689.23421 297.859 787.4557 782.0212 447.43 107.39 -120.6 37 124 170.5 121.1 18.45 168.84 163.22 YoY % 79% 131% -62% 1% 75% 317% -189% -426% -70% -27% 41% 556% -89% 3% #DIV/0! TAX TO EBITDA 29% 29% 29% 29% 29% 21% 10% -72% 4% 10% 14% 16% 4% 21% 24% Profit/Loss For The Period 6422.121099 5167.2239 2636.339 2181.798 1317.511 721.78 334.81 29.38 433.71 565.98 631.3 423.67 190.25 469.31 444.25 YoY % 24% 96% 21% 66% 83% 116% 1040% -93% -23% -10% 49% 123% -59% 6% #DIV/0! PAT - SALES 6% 7% 5% 6% 5% 4% 2% 0% 3% 4% 6% 6% 3% 6% 6% Fixed Assets 7021 6879 6521 6215 5579 5,129.35 5,375.70 5,841.39 5,970.81 5,461.72 4,991.76 4,869.26 4,442.31 2,186.63 1,714.74 YoY % 2% 5% 5% 11% 9% -5% -8% -2% 9% 9% 3% 10% 103% 28% #DIV/0! Fixed Assets 27% 40% 59% 48% 43% 45% 65% 72% 27% 23%
- 2. - SALES Margin Total Current Liabilities 37462.37308 28050.644 18454.37 13454.42 8695.57 5,209.86 5,035.52 4,586.60 5,296.10 4,843.70 3,759.87 2,960.76 2,136.95 2,275.95 1,922.61 YoY % 34% 52% 37% 55% 67% 3% 10% -13% 9% 29% 27% 39% -6% 18% #DIV/0! CL to Sales 35% 38% 35% 37% 33% 28% 37% 46% 42% 38% 34% 40% 35% 29% 26% Total Current Assets 40673.43363 29526.994 18981.64 14545.32 9222.574 5,290.61 4,693.00 3,855.44 4,296.53 4,303.89 3,983.77 4,081.45 3,120.71 2,743.42 2,527.50 YoY % 38% 56% 31% 58% 74% 13% 22% -10% 0% 8% -2% 31% 14% 9% #DIV/0! CA to Sales 38% 40% 36% 40% 35% 28% 35% 39% 34% 34% 36% 55% 51% 34% 34% Working Capital 3,211.06 1,476.35 527.27 1,090.90 527.00 80.75 -342.52 -731.16 -999.57 -539.81 223.90 1,120.69 983.76 467.47 604.89 change in WC 1,734.71 949.08 -563.63 563.89 446.25 423.27 388.64 268.41 -459.76 -763.71 -896.79 136.93 516.29 -137.42 604.89 CAPEX -489.89 -192.32 -346.10 138.80 -52.46 -690.02 -882.03 -506.46 128.31 117.15 -144.93 222.84 2,077.27 294.53 1,564.17 FCFF(revenue model) 1,774.77 930.67 1,638.97 1,225.21 1,520.81 1,985.29 1,412.64 525.21 1,170.92 1,778.65 2,084.92 277.25 - 2,152.41 465.30 ######## Total Assets 23,166.77 20,870.96 18,634.79 16,490.96 14,991.78 13,385.52 13,311.49 12,808.00 13,096.70 11,915.75 10,593.31 9,308.12 7,911.26 5,578.20 4,505.17 YoY % 11% 12% 13% 10% 12% 1% 4% -2% 10% 12% 14% 18% 42% 24% #DIV/0! Cost Of Materials Consumed 73,694.46 52,638.90 35,566.82 24,871.91 17,765.65 12,252.17 8,626.64 5,909.69 7,539.42 9,121.48 8,064.50 5,333.83 4,390.59 5,834.61 5,491.44 YoY % 40% 48% 43% 40% 45% 42% 46% -22% -17% 13% 51% 21% -25% 6% #DIV/0! Purchase Of Stock-In Trade 3,595.57 2,663.38 2,315.99 1,852.79 1,684.35 1,531.23 1,391.19 1,269.03 1,311.74 507.37 273.37 244.88 202.19 163.53 124.18 YoY % 35% 15% 25% 10% 10% 10% 10% -3% 159% 86% 12% 21% 24% 32% #DIV/0! Operating And Direct Expenses 0.00 0.00 0.00 0.00 0.00 0.00 0.00 0.00 0.00 0 0 45.51 50.3 57.48 41.7 YoY % #DIV/0! #DIV/0! #DIV/0! #DIV/0! #DIV/0! -100% -10% -12% 38% #DIV/0! Changes In Inventories Of FG,WIP And Stock-In Trade 200 -350 200 400 -300 -521.44 -52.61 423.87 271.98 -167.01 -165.22 -251.85 -1.05 -97.48 -48.98 YoY % 891% -112% 56% -263% 1% -34% 23886% -99% 99% #DIV/0! COGS 77,490.03 54,952.28 38,082.81 27,124.69 19,150.00 13,261.96 9,965.22 7,602.59 9,123.14 9,461.84 8,172.65 5,326.86 4,591.73 5,900.66 5,566.64 Total Shareholders Funds 7,805.46 7,227.28 6,691.93 6,254.14 5,844.99 5,514.14 5,118.69 4,447.88 4,455.10 4,208.17 3,962.96 3,656.31 3,473.90 2,148.98 1,894.57 YoY % 8% 8% 7% 7% 6% 8% 15% 0% 6% 6% 8% 5% 62% 13% #DIV/0! Total Capital And Liabilities 23,166.77 20,870.96 18,634.79 16,490.96 14,991.78 13,385.52 13,311.49 12,808.00 13,096.70 11,915.75 10,593.31 9,308.12 7,911.26 5,578.20 4,505.17
- 3. YoY % 11% 12% 13% 10% 12% 1% 4% -2% 10% 12% 14% 18% 42% 24% #DIV/0! Inventories 7,119.45 5,234.89 3,766.11 2,789.71 2,249.77 1,730.59 1,398.53 1,188.70 1,896.02 2,230.63 2,208.90 1,638.24 1,330.01 1,223.91 1,070.32 YoY % 36% 39% 35% 24% 30% 24% 18% -37% -15% 1% 35% 23% 9% 14% #DIV/0! Cash And Cash Equivalents 65,905.32 33,797.60 16,094.09 7,450.97 3,371.48 1,568.13 751.29 11.69 13.94 32.56 179.53 518.92 88.08 451.37 434.94 YoY % 95% 110% 116% 121% 115% 109% 6327% -16% -57% -82% -65% 489% -80% 4% #DIV/0! Current Investments 0.00 0.00 0.00 0.00 0.00 0 408.45 384.37 0 0 YoY % #DIV/0! #DIV/0! Trade Receivables 1,414.06 1,400.06 1,372.60 1,307.24 1,188.40 1,250.95 1,257.69 1,299.01 1,419.41 1,230.25 1,164.50 1,022.06 957.97 375.84 522.88 YoY % 1% 2% 5% 10% -5% -1% -3% -8% 15% 6% 14% 7% 155% -28% #DIV/0! Trade Payables 4,065.22 3,534.97 3,213.61 3,382.75 3,075.23 2,562.69 2,828.32 2,214.15 2,485.37 2,772.46 2,308.51 2,331.68 1,771.29 1,735.11 1,433.69 YoY % 15% 10% -5% 10% 20% -9% 28% -11% -10% 20% -1% 32% 2% 21% #DIV/0! EBIT 3,621.06 1,826.35 375.00 2,218.16 2,194.51 1,722.30 610.30 -210.48 495.69 903.28 946.27 554.01 281.19 613.89 522.22 Basic EPS (Rs.) 22.57 18.16 9.26 7.67 4.63 2.54 1.18 0.11 1.63 2.13 4.75 3.18 1.43 3.53 3.36 CURRENT MARKET PRICE AS ON 31 MAR 2016 108.55 108.55 108.55 108.55 108.55 108.55 108.55 108.55 108.55 108.55 108.55 108.55 108.55 108.55 108.55 Equity Share Capital 284.59 284.59 284.59 284.59 284.59 284.59 284.59 266.07 266.07 266.07 133.03 133.03 133.03 133.03 132.39 Profit/Loss Before Tax 7,655.48 5,856.46 2,934.20 2,969.25 2,099.53 1,169.21 442.20 -91.22 470.71 689.98 801.80 544.77 208.70 638.15 607.47 YoY % 31% 100% -1% 41% 80% 164% -585% -119% -32% -14% 47% 161% -67% 5% #DIV/0!
- 4. DCF ANALYSIS Particulars Mar-21 Mar-20 Mar-19 Mar- 18 Mar-17 Mar- 16 Mar-15 Mar- 14 Mar-13 Mar- 12 Mar-11 Mar-10 Mar-09 Dec- 07 Dec- 06 FCFF (EBITDA Formula) 1958.0221 1090.27 1828.08 1369.4 1666.42 2076.9 1456.19 252.21 1186.995 1813.5 2122.49 309.854 - 2145.25 503.15 WACC 9% 9% 9% 9% 9% Years (t) 5 4 3 2 1 Discounted FCFF 1273 772 1412 1153 1529 Sum of Discounted FCFF 6138 Terminal Value (Growth 5%) 51398 Dicsounted Terminal Value (t=5) 33405 Value of company (Sum of Discounted FCFF+Discounted Terminal Value) 39543 Shares Outstanding 284.59 FCFF per share 138.94802 Current Market Price (As on 12 Aug 2016) 89 Upside 56% BUY CALL
- 5. Forecasting Financial Ratios Profitability Ratios Profitability Ratios Mar-21 Mar-20 Mar-19 Mar-18 Mar-17 Mar-16 Mar-15 Mar-14 Mar-13 Mar-12 Mar-11 Mar-10 Mar-09 Dec-07 Dec-06 Gross Profit Ratio ((Total Operating Revenues- COGS)/Total Operating Revenues) 28% 26% 28% 25% 27% 30% 27% 24% 27% 26% 27% 28% 26% 26% 24% Return on Sales [PAT/Total Operating Revenues) 6% 7% 5% 6% 5% 4% 2% 0% 3% 4% 6% 6% 3% 6% 6% Return on Assets [PAT/ Average Total Assets] 28% 25% 14% 13% 9% 5% 3% 0% 3% 5% 6% 5% 2% 8% 10% Return on Equity [PAT / Average Stockholders' Equity] 82% 71% 39% 35% 23% 13% 7% 1% 10% 13% 16% 12% 5% 22% 23% Net Profit Ratio [PAT/Total Operating Revenue] 6% 7% 5% 6% 5% 4% 2% 0% 3% 4% 6% 6% 3% 6% 6% Liquidity Ratios Liquidity Ratios Current Ratio [Current Assets / Current Liabilities] 1.085714 1.0526316 1.0285714 1.0810811 1.060606 1.015499 0.931979 0.840588 0.811263 0.888554 1.05955 1.378514 1.4603571 1.205396 1.314619 Quick Ratio [(Current Assets- Inventory) / Current Liabilities] 0.895671 0.8660087 0.8244946 0.8737357 0.80188 0.683324 0.654246 0.58142 0.45326 0.428032 0.47206 0.825197 0.83797 0.667638 0.757918 Cash Ratio [(Cash and cash equi. + current investment) / Current Liabilities] 1.75924 1.2048778 0.872102 0.5537935 0.387724 0.300993 0.230312 0.086352 0.002632 0.006722 0.04775 0.175266 0.0412176 0.198322 0.226224 Net Working Capital [Current Assets - Current Liabilities] 3211.061 1476.3497 527.26774 1090.8988 527.0042 80.75 -342.52 -731.16 -999.57 -539.81 223.9 1120.69 983.76 467.47 604.89 Management Efficiency Ratios Management Efficiency Ratios Receivable Turnover [Sales / Accounts Receivable] 75.69377 52.724628 38.413658 27.816787 22.1728 15.04583 10.7834 7.654622 8.793231 10.43852 9.59821 7.275679 6.4396484 21.21254 14.07375 Day Sales Outstanding [365*( Trade Receivables/Sales)] 4.822061 6.922761 9.5018288 13.121573 16.46161 24.25921 33.84831 47.68361 41.5092 34.96664 38.0279 50.16714 56.680113 17.20681 25.93482 Inventory Turnover (COGS/Avg. Inventory) 10.88427 10.497308 10.111975 9.7231192 8.511992 7.663259 7.125496 6.395718 4.811732 4.241779 3.69987 3.251575 3.4524026 4.821155 5.200912 Days Inventory Outstanding [365*( Inventory/ COGS)] 33.53465 34.770819 36.095817 37.539394 42.88068 47.62986 51.2245 57.06943 75.85626 86.0488 98.652 112.2533 105.72347 75.708 70.18
- 6. Accounts Payable Turnover (COGS / Accounts Payable) 19.0617 15.545312 11.850464 8.0185314 6.22718 5.175015 3.523371 3.433638 3.670737 3.412796 3.54023 2.284559 2.5923084 3.400741 3.882736 Days Payable Outstanding [365*(Accounts Payable/COGS)] 19.14834 23.479747 30.800481 45.519558 58.61401 70.53119 103.594 106.3012 99.43507 106.9504 103.101 159.7683 140.80115 107.3295 94.00587 Operating Cycle [Days Inventory+Days Sales] 38.35671 41.69358 45.597646 50.660967 59.34229 71.88908 85.07281 104.753 117.3655 121.0154 136.68 162.4204 162.40359 92.9148 96.11482 Cash Conversion Cycle [Day Sales O/S+Days Inventory O/S-Days Payable O/S] 19.20837 18.213833 14.797165 5.1414093 0.72828 1.357886 - 18.52117 -1.5482 17.9304 14.065 33.5792 2.652171 21.602441 - 14.41474 2.108945 Total Asset Turnover [Sales/ Total Assets] 4.620211 3.5368514 2.8294811 2.2050439 1.757644 1.406115 1.018833 0.776345 0.953003 1.077732 1.05511 0.798892 0.7797734 1.429228 1.63343 Leverage Ratios Leverage Ratios Debt Ratio [Total Liabilities/Total Assets] 1 1 1 1 1 1 1 1 1 1 1 1 1 1 1 Equity Ratio [Total Equity / Total Assets] 0.336925 0.3462841 0.3591094 0.3792464 0.389879 0.411948 0.384532 0.347274 0.34017 0.35316 0.3741 0.392809 0.4391083 0.385246 0.420532 Debt-Equity Ratio [Total Liabilities / Total Equity] 2.968019 2.8878023 2.7846665 2.6368081 2.564895 2.42749 2.600566 2.879574 2.93971 2.831575 2.67308 2.545769 2.2773425 2.595743 2.377938 Times Interest Earned [(PBT+Finance Cost) / Finance Cost] 19.67189 17.732737 8.8245272 8.4231332 6.998662 5.274366 2.123733 0.798596 2.248932 3.703154 5.24412 6.348748 2.3267641 8.630635 20.09082 Valuation Growth Ratios EPS [PAT/NO. Of Share] 22.56622 18.15673 9.2636379 7.666459 4.629504 2.53621 1.176464 0.110422 1.63006 2.127185 4.74555 3.18477 1.4301285 3.527851 3.355616 Price-Earnings Ratio [Current Market Price/EPS] 4.810287 5.9784993 11.717859 14.159079 23.44744 42.80008 92.26799 983.0462 66.59265 51.02989 22.8741 34.08409 75.902268 30.76944 32.34876 Book Value per Share [Shareholder's Funds/No Of Share] 27.42705 25.395416 23.514274 21.975957 20.53828 19.37573 17.98619 16.71695 16.74409 15.81603 29.79 27.48485 26.113659 16.1541 14.31052 PB Ratio [Current Market Price/BV] 3.957772 4.2743935 4.616345 4.9394891 5.285253 5.602369 6.035186 6.493408 6.482884 6.863292 3.64384 3.949448 4.1568285 6.719656 7.585328
- 7. Valuation Ratios DATA Required 2016 CMP ON 31 MARCH 2016 108.55 P/E 42.80008382 EPS ON 31 MARCH 2016 2.536209986 P/B 5.602368547 REVENUE ON 31 MARCH 2016 18,821.58 P/SALES RATIO 1.641320468 NO . O/S SHARE 285 PRICE TO CASH FLOW 18.43641689 NET WORTH 5,514.14 PRICE TO EARNING GROWTH RATIO 5.887803507 ANNUAL DIVIDEND 45.00 DIVIDEND YIELD 0.414555504 CASH FLOW FROM OPERATION 1675.61 MARKET CAP 30892.2445 EPS GROWTH 116% ENTERPRISE VALUE 30475.9945 SHORT TERM BORROWING 0 NET DEBT 416.25 LONG TERM BORROWING 1,984.38 EV/EBITDA 14.07036778 CASH & CASH EQUIVALENT 1,568.13 EV/SALES 1.619204897 EBITDA 2,165.97 EV/EBIT 17.69493962 Net Debt= SHORT TERM BORROWING+LONG TERM BORROWING-CASH & CASH EQUIVALENT
- 8. Analysis Company Profiles: Company : Ashok Leyland: Ashok Leyland is an Indian automobile manufacturing company based in Chennai, India. Founded in 1948, it is the 2nd largest commercial vehicle manufacturer in India, 4th largest manufacturer of buses in the world and 16th largest manufacturer of trucks globally. Operating six plants, Ashok Leyland also makes spare parts and engines for industrial and marine applications. With a joint venture with Nissan Motors of Japan the company made its presence in the Light Commercial Vehicle (LCV) segment (<7.5 tons). Discounted Cash Flow Valuation 1. Revenue Growth: The revenue growth of the companies has been assumed as follows: Company : Ashok Leyland: Ashok Leyland is an 2nd largest commercial vehicle manufacturer in India Ashok Leyland has an potential to grow with an average growth of 40-45% and on this basis the future operating revenue forecasting has been done with an growth rate of 40-45%. Fall in fuel prices has substantially improved interest serviceability of the fleet operators leading to higher demand. The company expects to earn over one-fourth of its revenues from exports in the next 3-5 years by expanding presence in Africa, South East and Latin American market. 2. The other financials are based on the revenue and the average/estimated of the last three –five years. 3. WACC (Weighted Average Cost of Capital) for all the three companies are calculated as follows: WACC Calculation Ashok Leyland WACC 9% Weight of Debt 38.0% Weight of Equity 62.0% After-tax Cost of Debt 2.1% Corporate tax rate 29.0% Cost of Debt 3.0% Cost of Equity 13.2%
- 9. Adjusted Risk free Rate 5.0% Annual inflation rate 9.0% Country Risk Premium 1.5% Risk free Rate 8.0% Unlevered Beta 1.82 Market Premium 4.0% 4. Terminal Growth Rate Assumption: T growth rate is taken 5 % assumption for all the three companies. 5. After calculating the value of the company the following recommendation can be given for each of the companies: Name of the Company FCFF/ Share (Rs) Current Market Price (Rs) Upside (%) Recommendation Ashok Leyland 138.9480213 89 (As on 12 Aug 2016) 56% BUY This report has been prepared by Aakash Singh, MBA Finance Student (SIBM HYD) only for the learning purpose. It includes research analysis, projections, forecasts and other predictive statements providing a basis for investment decisions. The views expressed therein are based solely on information available publicly/internal data/other reliable sources believed to be true. The information is provided merely as a complementary service and do not constitute an offer, solicitation for the purchase or sale of any financial instruments or neither me nor anyone responsible for the risk held by the investor.